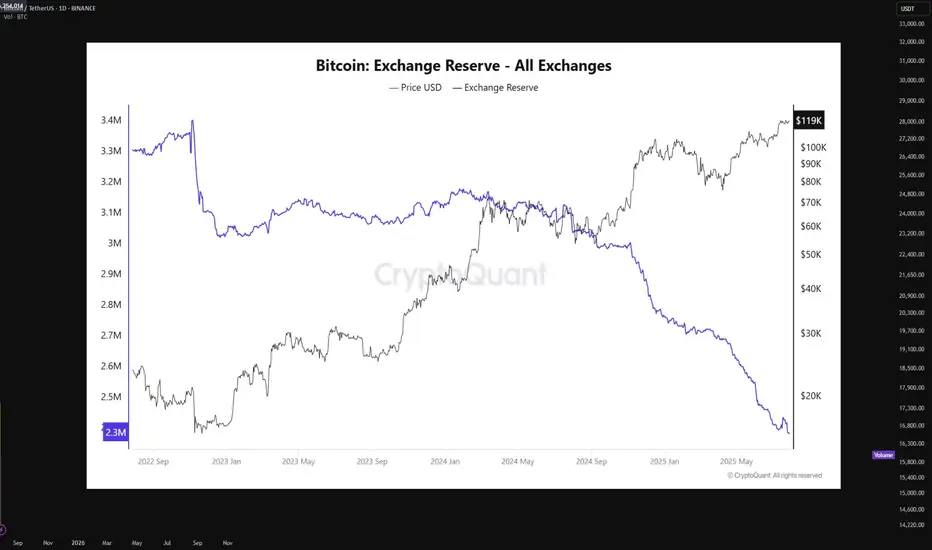
Bitcoin supply on exchanges is at an all-time lowBitcoin is currently undergoing a textbook supply-side shock, a rare phenomenon that historically precedes vertical price expansion. The latest on-chain data from CryptoQuant shows that BTC exchange reserves have declined to an all-time low of just 2.3 million BTC, down from approximately 3.3 million BTC in mid-2022. This marks a 27% drop in immediately sellable supply — a net outflow of over 900,000 BTC from centralized exchanges.
This trend signifies that a substantial portion of BTC holders have opted for long-term self-custody, indicating growing conviction among market participants. When coins leave exchanges, they are typically sent to cold wallets for long-term storage, effectively removing them from the liquid supply pool. This restricts the ability for large-volume sell orders to materialize, especially during rapid price appreciation, thereby creating a supply squeeze.
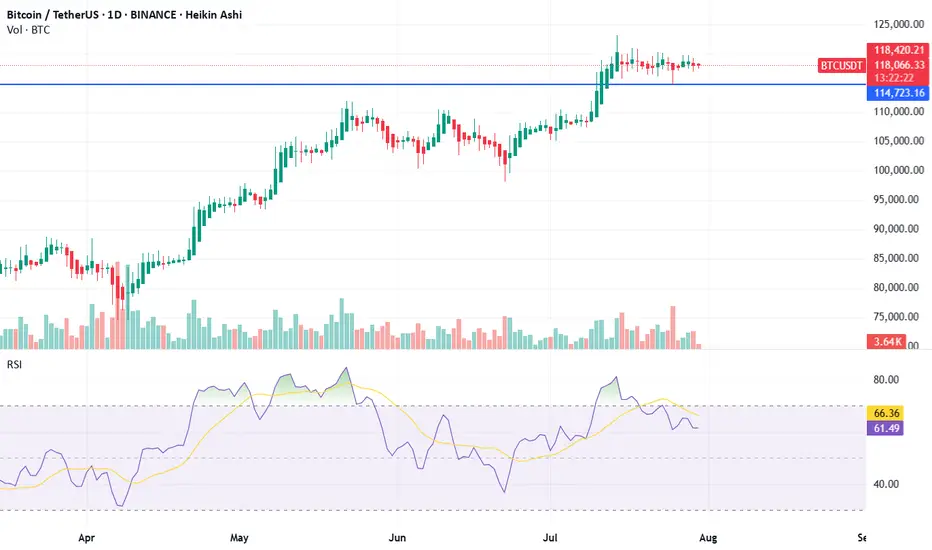
In parallel, the price of Bitcoin has risen steadily, now trading around $119,000, with a clear break above prior resistance clusters in the $75K–$85K zone. The price has shown strong momentum divergence against exchange reserves, with reserves falling while price rallies, a bullish continuation signal. This decoupling indicates aggressive spot accumulation in the background, often a signal of institutional or whale-level interest.
Technically, BTC is also showing signs of a parabolic structure forming, supported by rising volume on upward moves and decreasing volume on retracements — confirming bullish market structure. Price action has respected key Fibonacci levels throughout the rally, and is currently pressing into a price discovery phase with minimal historical resistance above.
The macro backdrop further supports this narrative. With Bitcoin ETFs now live and facilitating regulated inflows, capital has increasingly favored BTC as a store-of-value hedge amid fiat debasement and monetary policy uncertainty. Combined with the 2024 halving, which cut block rewards from 6.25 to 3.125 BTC per block, new supply issuance has halved, while demand remains elevated.
When supply dries up — as it clearly is — and demand persists or increases, price must equilibrate higher. This is a fundamental economic principle now playing out in real-time. The current environment mirrors late 2020 to early 2021, when a similar supply drop from exchanges preceded Bitcoin’s rally from $20K to $64K.
In summary, Bitcoin is entering a phase of constrained supply coupled with aggressive demand, pushing the asset toward price discovery territory. With on-chain reserves at historic lows, minimal overhead resistance, and strong macro alignment, the technicals now point to a structurally bullish setup.
If this trend persists, a sustained breakout beyond $120K could trigger a feedback loop of FOMO-driven spot bids, further deepening the supply shock and accelerating the next leg of the bull cycle.
BTCUSDT trade ideas
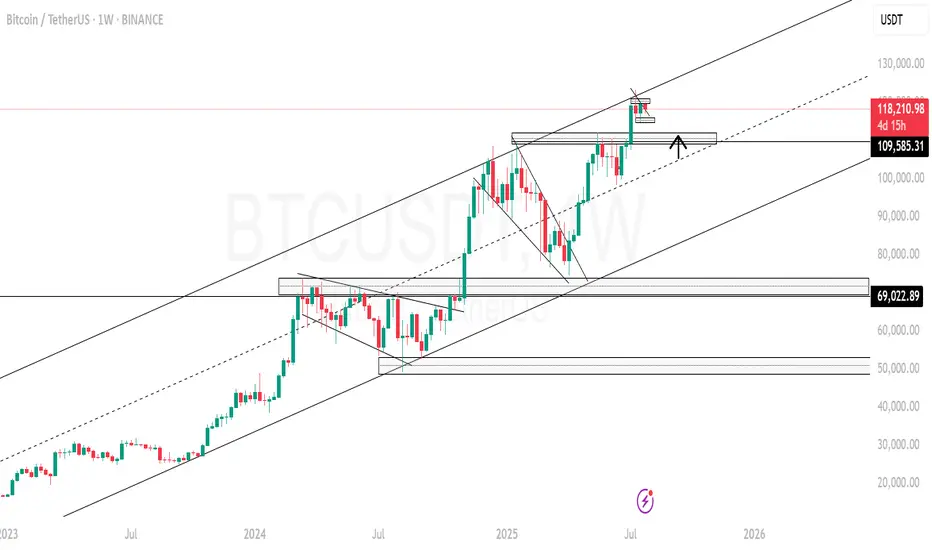
BTCUSD As I prepare for the continuation of the weekly Bitcoin bullish trend, I foresee a potential price retracement down to the 109k zone. This dip could offer a valuable opportunity for a robust bullish continuation, setting the stage for upward momentum in the market. The anticipation of this movement encourages a strategic approach, as we watch for signs of strength and confirmation in buying pressure. I'm preparing to capitalize on the ongoing weekly bullish trend in Bitcoin. I anticipate a price retracing to 109k zone, which could provide a strong opportunity for bullish continuation
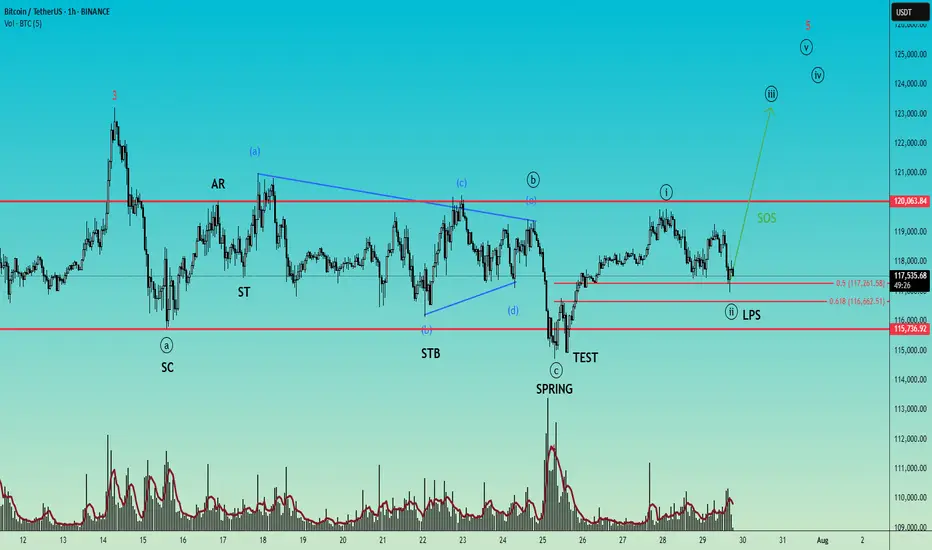
BTCUSD – Wyckoff Accumulation + Elliott Wave SynergyTimeframe: 1H
Title: "A textbook Wyckoff Accumulation with Elliott Wave Confirmation – Sign of Strength Next?"
This chart presents a textbook Wyckoff Accumulation structure seamlessly combined with Elliott Wave Theory, highlighting how the two methodologies can complement each other in timing and structural validation.
🔍 Wyckoff Accumulation Phases:
SC (Selling Climax) and AR (Automatic Rally) define the range.
ST (Secondary Test) and STB (Secondary Test in Phase B) confirm horizontal support.
A classic Spring and Test pattern occurs in Phase C, marked by a sharp downward probe below support (Spring), followed by a successful retest with no new low (Test).
The LPS (Last Point of Support) is forming above the Spring low and near the 61.8% Fibonacci retracement level, showing bullish absorption of supply.
The recent rally and pullback suggest we're entering Phase D, with the Sign of Strength (SOS) expected next.
🌀 Elliott Wave Alignment:
The Spring aligns with the end of wave (iv) of a larger impulse, and the structure unfolding from the Spring appears to be the start of wave (v).
The move from Spring to SOS shows impulsive qualities, labeled as wave (i), with the corrective pullback forming wave (ii), ending near the golden Fibonacci ratio (61.8%).
This alignment of wave (ii) with the LPS further validates the accumulation and sets the stage for a strong wave (iii) within wave (v), likely to coincide with a Sign of Strength breakout.
💡 Key Takeaways:
This is a classic Wyckoff Accumulation with all major phases visible: A to D.
Elliott Wave counts confirm the internal structure and suggest bullish continuation.
Watch for the SOS rally above resistance at ~120k to confirm the transition into Phase D/E and a potential trending move.
🔔 Conclusion:
Combining Wyckoff and Elliott Wave provides a high-probability setup. A successful break above resistance will signal the start of a trend phase. LPS offers a favorable risk-reward area, especially with wave (ii) possibly completing soon with a test of Fibonacci ratio (61.8%).
Bitcoin at Descending Channel Resistance – Rejection Imminent?🔻 Bitcoin at Descending Channel Resistance – Watch This Level Closely!
📉 BTC/USDT is currently testing the top boundary of a well-defined descending channel on the 2H chart.
🟨 This zone has acted as strong resistance in the past, and the current reaction suggests the potential for a short-term rejection.
Unless we see a clean breakout above $120K with strong volume and follow-through, the more probable scenario is a pullback towards the midline or lower boundary of the channel.
💡 Notably, this area also aligns with a local supply zone and prior liquidity sweep, making it a key decision point.
⸻
🧭 CryptoPilot’s Take:
This is where patience pays off. No breakout = no FOMO. Watch for confirmation before acting.
⸻
❓ What’s your view?
Will BTC break out and flip bullish here — or is a deeper correction on the way?
👇 Share your thoughts in the comments!
💬 Follow for daily high-probability setups using Smart Money & Wave Theory. Let's grow together!

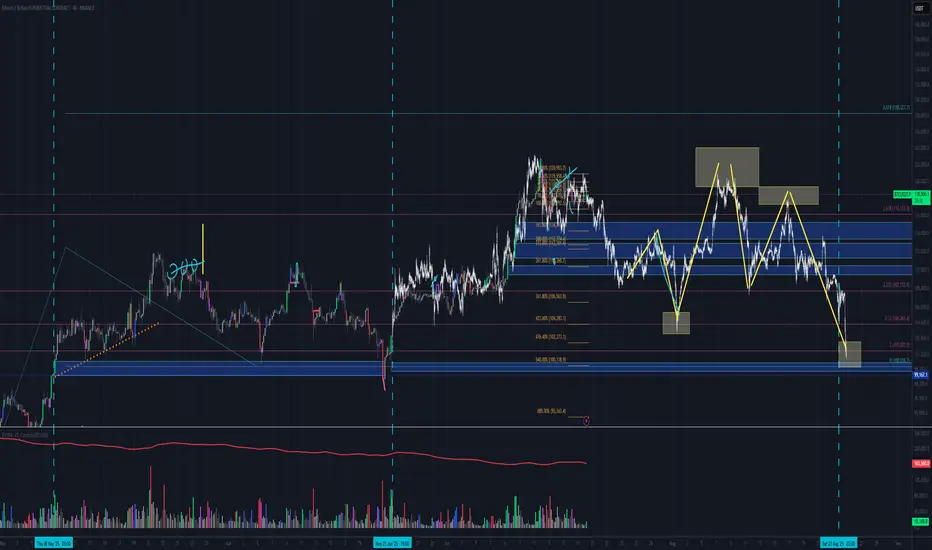
Targets and their point in timewe use the threshold breaks to determine targets AKA areas of liquidity. we also utilize pattern detection paired with the threshold breaks to validate cycles and where we are in said cycle.

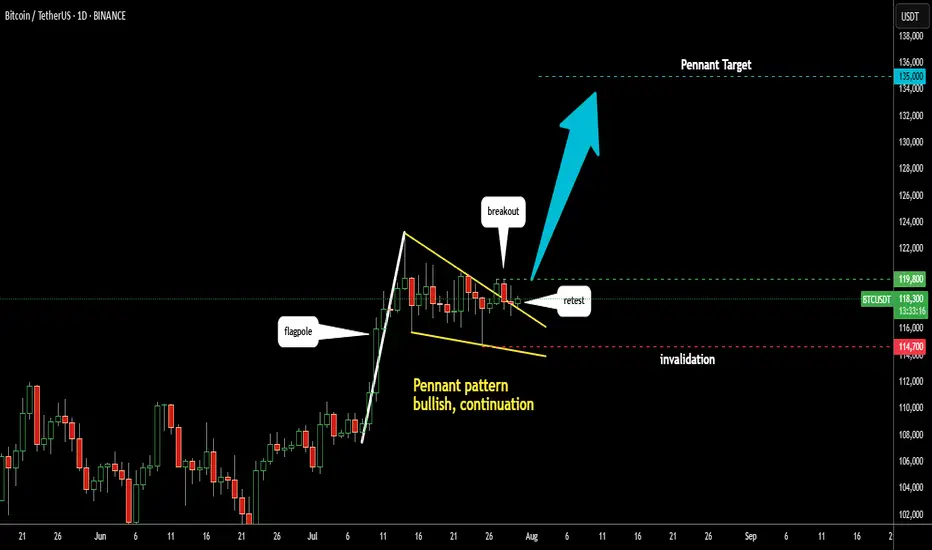
Bitcoin: Pennant - Bullish Continuation PatternI spotted a bullish continuation pattern called Pennant in Bitcoin chart
Support and resistance are marked with yellow trendlines
There is also a Flag Pole (white trendline)
The model is clean as we already see a bullish breakup and a textbook pullback
to the broken resistance.
The target is established at the height of the Flag Pole applied to the broken resistance
at $135k.
For final confirmation the price should overcome the top of breakout at $119,800
The invalidation point is located at the bottom of the Pennant at $114,700
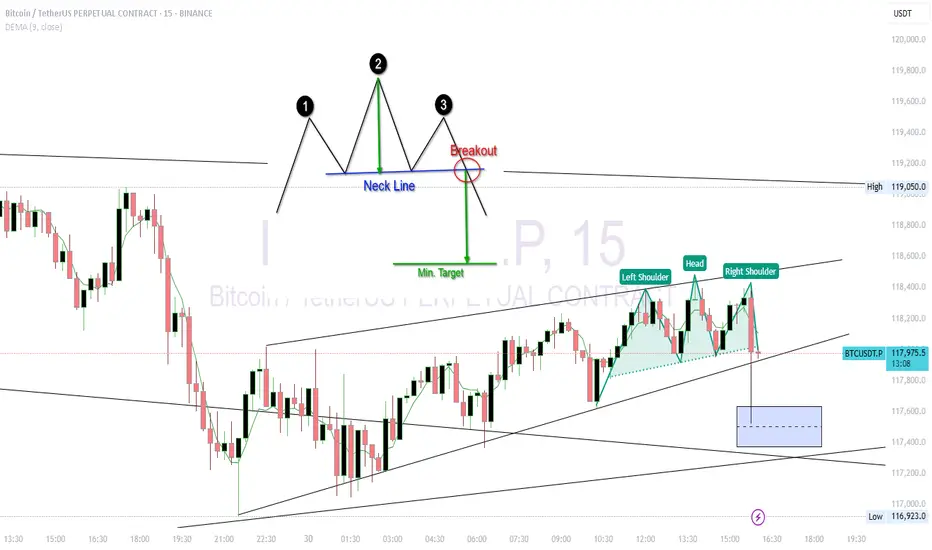
BTC USDT Forming Head and shoulder in 5 MinChart Breakdown
🟢 Pattern:
Left Shoulder: 118,450
Head: ~118,600
Right Shoulder: ~118,400
Neckline: Sloping slightly upward, around 118,050
📌 Bearish Breakdown Scenario
If BTC breaks below the neckline (~118,000) with volume, the expected drop (measured move) is:
Height of pattern:
Head (118,600) – Neckline (118,000) = 600 pts
Target on breakdown:
118,000 – 600 = ~117,400
🔻 Target: 117,400–117,300
🔒 Invalidation: Price closes above 118,300 with strong volume.
BTCUSDT – Key Support Holding! Next Targets if 115,827 BreaksBitcoin is currently holding above a crucial support zone around 115,220. After a recent drop to the 114,979 area, buyers stepped in strongly, preventing further downside.
📊 If price stabilizes above 115,220 and successfully breaks through the resistance at 115,827, I expect bullish continuation towards the following targets:
🎯 Target 1: 117,900
🎯 Target 2: 119,076
These zones acted as strong resistances previously, and breaking through them could open the path to further upside.
⚠️ However, if BTC closes below 114,500, we may see a bearish breakdown with potential downside towards 108,000 – 106,000 range.
📌 Personally, I hope Bitcoin holds this support as it’s a key level to maintain bullish momentum.
Let’s see how the market reacts in the next few candles! BINANCE:BTCUSDT

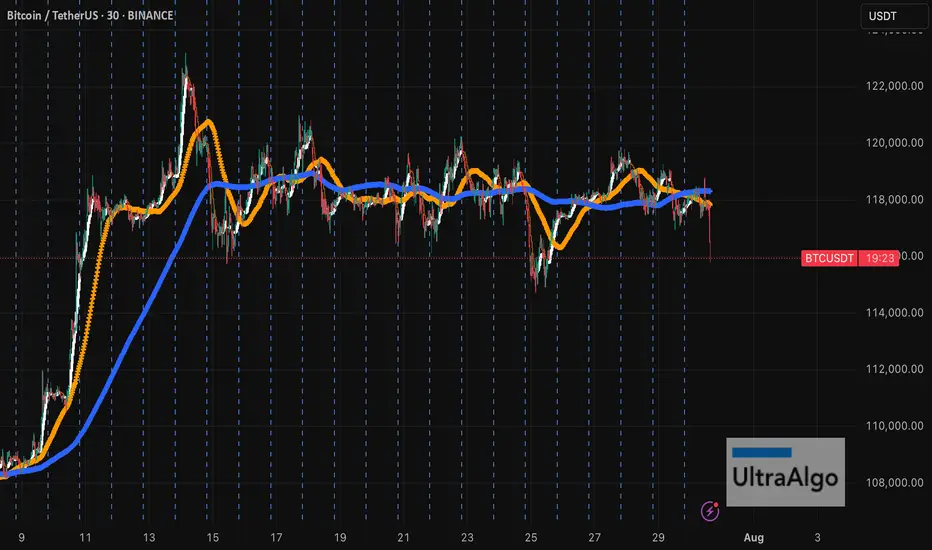
BTC Macro Trend ViewDaily chart of BTCUSDT with MA200 and volume. Used to monitor short-term market structure and trend support.

Have been warned multiple times....BTC will FALL on retailersBTC has been consolidating at the top for a while, which is not very common. Have a feeling that crypto bros have been getting the scratch for more profit taking, but no sensible person will keep buying at the top when the market is already WAY overheated. Picked up early UltraBear signal on this, don't be the person holding to the bag for years. This bubble will burst, just like every other time! Always do your own due diligence, stay safe and get out if you can....
Short- Sell Bitcoin Target 107000 $ in next few monthsBitcoin is on way to it's down side in next 5-6 months. If it will not sustain, then it can fall down to 85000$.
Pattern detection bitcoinusing hourly btc analysis we can breakdown this move and its time cycles
pvsra volume threshold breaks indicating price instability allows us to break down these moves starting point
present
past pattern repeating
barpattern-overlay
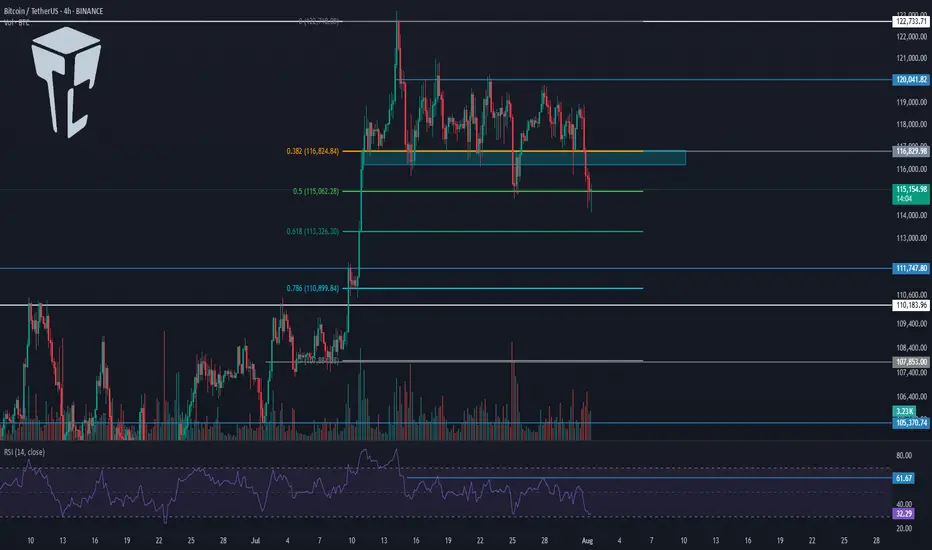
TradeCityPro | Bitcoin Daily Analysis #141👋 Welcome to TradeCity Pro!
Let’s dive into Bitcoin analysis. Yesterday, the exact bearish scenario I told you about happened. Let’s see what opportunities the market is offering us today.
⏳ 4-Hour Timeframe
Yesterday, I mentioned that the price had tested the 116829 zone too many times and that this area had become very weak. I also said that if the price made a lower high than 120041, deeper corrections would be likely.
✔️ Another perspective I have on the market is that sometimes certain support and resistance levels simply aren’t strong enough to continue the trend.
🔑 For example, in this case — despite Bitcoin being in an uptrend across all cycles — the 116829 support couldn’t hold, and the price broke it to reach a stronger support zone, one that might be capable of continuing the trend.
📊 Right now, this is what might be happening again. Support levels like 0.5, 0.618, and 0.786 Fibonacci retracement zones could be where the next bullish leg begins.
✅ At the moment, price has reached the 0.5 Fibonacci level, and the previous strong bearish momentum has slightly weakened. If you look at the volume, momentum is still in favor of sellers, but based on the long lower wicks on the candles, we can say the bearish trend is showing signs of weakness.
💥 On the other hand, RSI is approaching 30, and in an uptrend, when RSI nears the Oversold zone, it can often be a good entry point for a long. However, we’re not acting on this yet — we’ll wait for more confirmations before opening any positions.
⭐ For now, there’s no trigger for a long position on this timeframe. A break below 115000 could act as a short trigger, but given the trend Bitcoin is in, I’m not opening any short positions at the moment.
⏳ 1-Hour Timeframe
The price has dropped down to 114560, and I believe today we might enter a corrective phase. However, if the price stabilizes below 114560, the correction could continue. The next targets would be the Fibonacci levels from the 4-hour timeframe.
🔽 I won’t open a short position with the break of 114560, and I suggest you don’t take that short either.
📈 If this move turns out to be a fakeout, the first trigger we have now is at 118736, which is quite far from the current price. For this trigger to activate, we’d need to see a V-pattern form.
🔍 There are no other triggers right now. But if more range structure forms, we might consider opening a risky long on the breakout of the range top.
❌ Disclaimer ❌
Trading futures is highly risky and dangerous. If you're not an expert, these triggers may not be suitable for you. You should first learn risk and capital management. You can also use the educational content from this channel.
Finally, these triggers reflect my personal opinions on price action, and the market may move completely against this analysis. So, do your own research before opening any position.
BTC poised to rise further! Market volume remains the problemBTC poised to rise further! Market volume remains the problem
From our chart we can see that BTC likes to make big corrections before moving higher. Over the weekend, BTC transformed from a bearish picture to a clear bullish triangle with a bullish breakout.
The prevailing trend should push BTC higher as shown in the chart, but again the problem is with the volume.
Suppose BTC has not accumulated enough volume during the development of the pattern. In that case, it is very likely that it will fall even further to develop an even larger pattern like the previous one that we can see at the end of the wave.
However, at the moment, BTC has a bullish pattern and the scenario could develop in the way shown in the chart. We cannot assume further transformations at the moment.
You may find more details in the chart!
Thank you and Good Luck!
PS: Please support with a like or comment if you find this analysis useful for your trading day

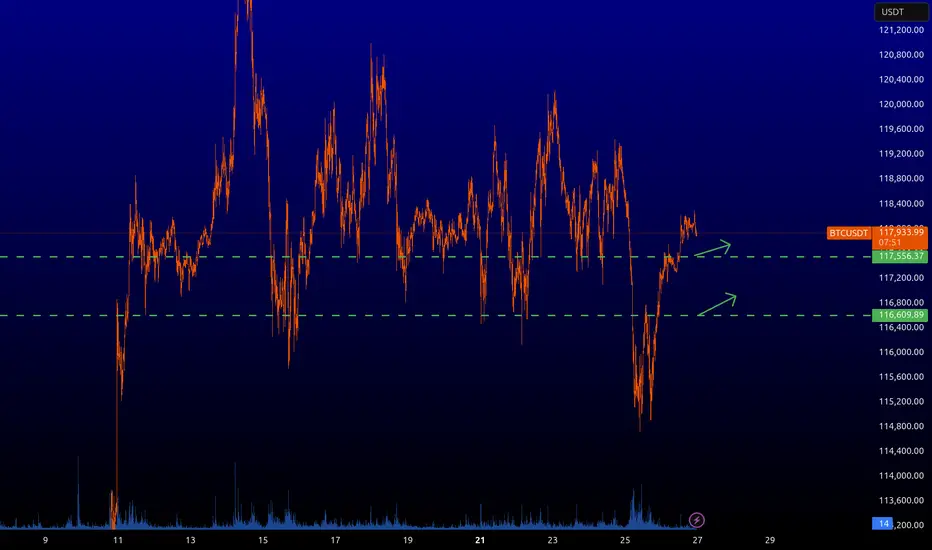
Bitcoin is at KEY zone - time for LONGBitcoin is at KEY zone - time for LONG
price hit key zone
if we furtunite - pric will go up to take range high

BITCOIN CRASH PREDICTED! HERE’S WHAT HAPPENS NEXT! (scary)Yello Paradisers, Bitcoin crashed exactly as we predicted in the previous videos that it will happen with the highest probability.
In this video I am explaining to you what's gonna happen next.
Head and shoulders, neckline, is be breaking to the downside, we need a clear confirmation of a reclaim Our channel on high timeframe is getting breakout to the downside and confirmation was that a reclaim was already successful.
In this video I'm sharing with you Elliott Way theory on low timeframe and what needs to be done for confirmation perspective in order for us to continue to go to the downside or have a reversal to the upside.
Don't be a gambler. Don't try to get rich quick. Make sure that your trading is professionally based on proper strategies and trade tactics.

Bitcoin in 15minCaption important🛑🛑🛑
Hello to all traders. 😎😎
I hope all your deals will hit their targets. 🎉🎉
I’m opening a short position on Bitcoin from the current level, targeting $118,200 as the first take-profit, and $117,600 as the second target.
⚠️ This is a high-risk trade, so make sure to apply proper risk management.
What Do You Think?
Which scenario do you think is more likely to happen? **Share your thoughts!** ⬇️
Don't forget that this is just an analysis to give you an idea and trade with your own strategy. And don't forget the stop loss🛑🛑🛑
❤️❤️❤️The only friend you have in financial markets is your stop loss❤️❤️❤️
Please support me with your ✅' like'✅ and comments to motivate me to share more analysis with you and share your opinion about the possible trend of this chart with me 🙏😊
Be Happy , Ali Jamali

BTC short setupGiven the bearish divergence on the lower timeframe and grabbing liquidity, we may be able to open a short position with low volume.

Update: Bull or Bear?I optimized and updated my trend lines. We have a fake breakout on there
What's your Idea? Bull or Bear?

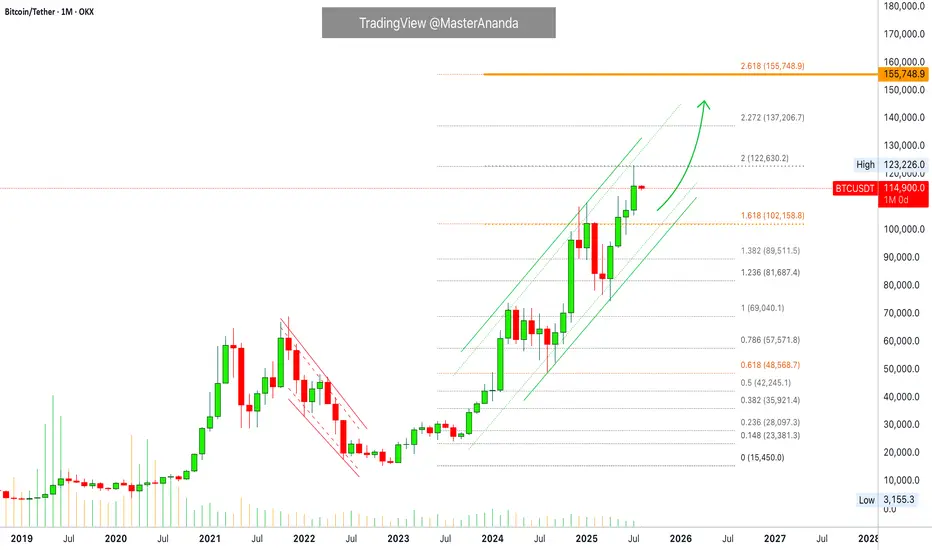
Bitcoin Monthly · Parabolic Rise ContinuesLast month Bitcoin produced its best numbers ever. The highest wick and close, a new all-time high at $123,226.
Bitcoin is not exhausted on the monthly timeframe but there is room for a retrace before the month ends. Think of the first part of the month being mixed, neutral or even bearish while the second half becomes full time bullish.
The levels that are relevant are $122,000 on the bullish side and $102,000 on the low. Right now the action is happening close to the middle so anything goes.
In 2020 Bitcoin produced 7 monthly candles growing and this was repeated again in 2023. In 2025 we have so far four green candles which means that Bitcoin can easily continue to grow. It has been known to produce more than four months green many times but there can be exhaustion at some point.
Bitcoin has been moving within a strong uptrend and is likely to continue rising. Bullish until the chart says otherwise. We are going up. Short-, mid- and long-term.
As Bitcoin consolidates near resistance, the altcoins will continue to build strength in order to grow. Remember, we are still looking at bottom prices across thousands of altcoins. Only a few moved ahead and are trading at all-time highs, the rest will catch up. The time is now, late 2025. The best is yet to come.
Namaste.
BTCUSD LONGIt's a long time to write and explain everything, just buy the level with the limit that is at ~117.550. You can count on a short-term rebound.
The one below the touchdown is not worth taking. I'll let you know if it works or not later.
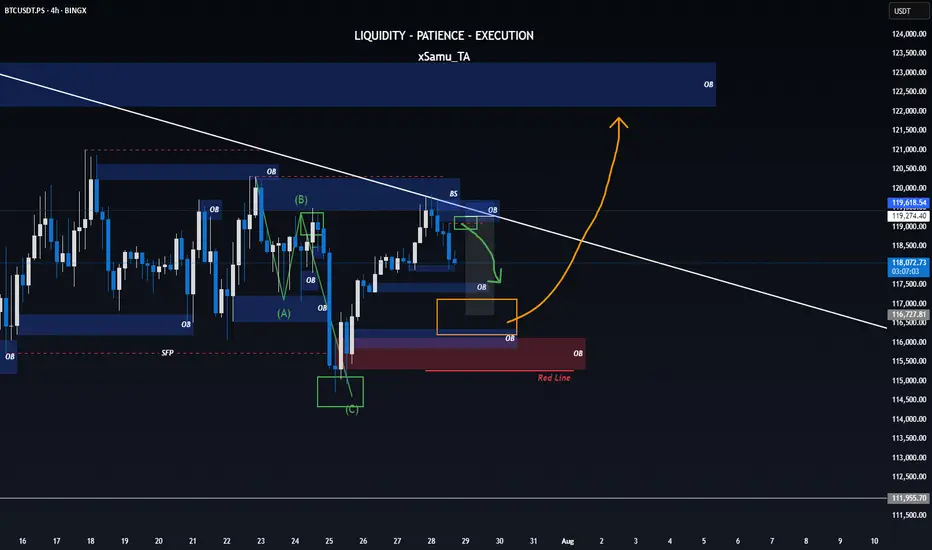
One last Correction till breakoutWith the most recent SFP printed on the higher timeframe and BTC still failing to break a significant high, all signs point toward one final dip – a move to shake weak hands and reload for the breakout that’s been brewing in silence.
⚡ If the orange level holds, consider it a highly bullish signal – supercycle potential unlocked?
Naturally, the Wizard plays both sides of the board:
📉 Short ideas would activate around the blue Order Block / green correction level.
📈 But should we bounce strong from orange… well, let’s just say you’ll want a seat for what comes next.
🟥 Bullish invalidation rests at the red line.
Let’s see how the game unfolds.
Teach me to fish, don’t hand me the catch.
---
🎯 **“Teach me to fish, don’t hand me the catch.”**
That’s the mantra behind what we do.
We’re not here to hand you quick wins—we’re here to equip you with the tools, mindset, and precision to master the art of **technical analysis**.
📚 **Follow Us** as we unlock proven strategies, crafted through years of experience and sharpened by real market conditions.
💼 **What You'll Get:**
- High-performance analysis techniques
- Visual case studies from our **actual trades**
- Clear examples from the insurance sector and beyond
- A blueprint to recognize and seize winning setups with confidence
💥 Whether you're new or seasoned, this isn't textbook theory.
This is **applied strategy**, built for clarity and verified by results.
---