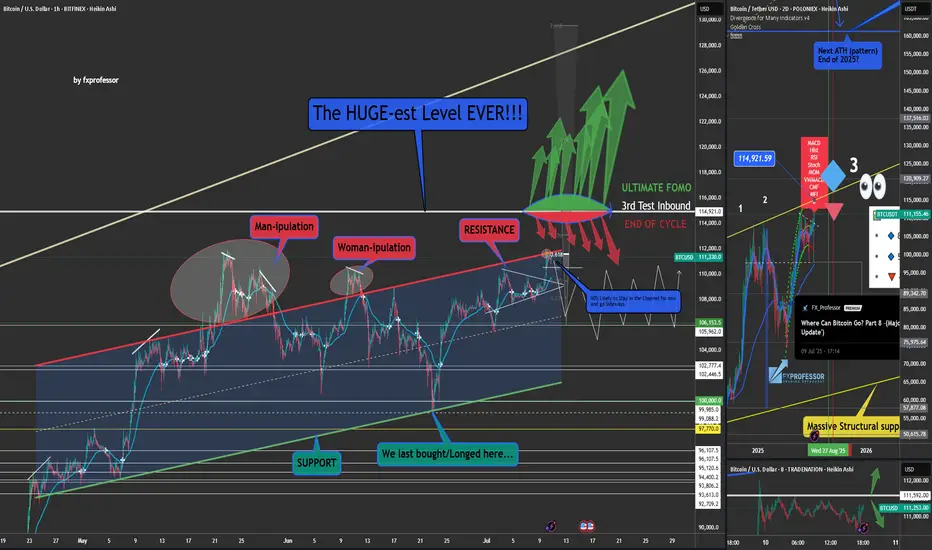
Bitcoin Rejected at Resistance – Sideways Trap Now Likely⚠️🚫 Bitcoin Rejected at $111,592 – Smart Money Took Profits, Not FOMO 💰📉
We called it yesterday. I urgently posted about the $111,592 level — one of the most important resistance zones in this structure. And right on schedule… Bitcoin tagged it and got rejected.
📍 This isn’t just luck. It’s structure + timing + discipline.
🔄 While many were eyeing a breakout, we were preparing for the expected rejection — and we took profits after long entries from just under $100K (as shown). This wasn’t the time to FOMO. This was the time to cash in.
🔎 Key Points from Today’s Market View:
We’re still inside the ascending channel, but testing the upper end
Multiple divergences on the 2-day chart are still active (8 counted). Many more across big timeframes.
The third macro resistance test is inbound — watch the 'where can Bitcoin go post below'
Current outlook favors a sideways chop — the classic liquidation zone where longs and shorts alike get punished
We might still get the breakout to $114,900 — but if that happens, it’ll come after more pain, not from clean momentum.
🧠 Bigger Picture:
If you missed the major chart update, watch:
👉 Where Can Bitcoin Go? Part 8
And if you want today’s broader outlook (including ETH, BTC.D, NASDAQ), catch the July 10th video:
👉 July 10th Market Outlook – Uncharted Waters
🗣️ Final Word:
What we’re seeing is not a breakout. Not yet.
This is a trap zone.
Discipline > Emotion.
Structure > Hope.
Profits > FOMO.
Welcome to day trading.
💬 Peanut butter Street Talk:
Presidents are out here launching meme coins. The insiders already made their billions — and they’re calling it “peanuts.”
But we don’t want to be their peanut butter.
That’s what happens when we become the exit liquidity.
They dump while we FOMO. They wait while we panic.
So don’t feed the trap. Keep your edge sharp, your charts tighter, and your emotions in check.
I prefer to buy over 115k, over resistance or lower at support.
Not today,
The FXPROFESSOR 💙
Disclosure: I am happy to be part of the Trade Nation's Influencer program and receive a monthly fee for using their TradingView charts in my analysis. Awesome broker, where the trader really comes first! 🌟🤝📈
BTCUSDT trade ideas
You Haven’t Missed It**⏰ Timeframe: 1H**
**🛠 Tools Used: Dow Theory, Support & Resistance, Volume, RSI**
**📈 Market Overview**
Bitcoin BINANCE:BTCUSDT is currently trading at **110,982**. After hitting a new all-time high at **12K**, the price is undergoing a mild correction. Despite the retracement, price remains supported by both volume and the 25-period moving average.
Yesterday, BTC broke through the **110,267** resistance level with a strong bullish candle, but encountered aggressive selling from market makers and is now consolidating with weak candles below the **12K** mark.
Typically, in such market phases, it’s advisable to close previous positions and consider new entries. However, given the likelihood of **interest rate cuts** and the fact that price is holding near its ATH, keeping previous **long positions** open may be wise, as a **strong upward move** is still on the table.
**⚙️ Technical Analysis**
Yesterday’s breakout above **110,267** was met with seller pressure near **12K**, leading to a shallow correction.
**BTC Dominance (BTC.D)** has broken above **65.04** and **64.69**, moving toward **64.51** resistance. However, a weakening candle structure is visible on both **4H and 1H** timeframes. This indicates that while long opportunities on bullish **BTC pairs** may still exist, we might see a lower high forming above **64.51** and below **64.69**, followed by another move back toward **64.51**.
Meanwhile, **USDT Dominance (USDT.D)** broke below the **4.75** support with a strong candle and is now ranging above **4.63**, suggesting a possible pause or rest phase here.
The **Total Market Cap** shows a similar pattern to **BTCUSDT**, reflecting consolidation with slight bullish bias.
The **Others** chart (excluding BTC & ETH) shows a healthy uptrend and is now facing resistance at **248.68**. A breakout above this level could pave the way for stronger performance among altcoins with bullish BTC pairs.
**🧭 Potential Scenarios**
📗 **Bullish Scenario:**
If BTC forms a **higher low above 110,654**, an entry could be considered above **12,000**, with a stop-loss placed below the higher low (based on the 1H timeframe). Volume confirmation is necessary to support the move.
📕 **Bearish Scenario:**
As long as the price remains **above 109,409**, **short positions are not recommended**.
**💡 Conclusion, Warnings & General Suggestion**
Bitcoin is currently in a **healthy bullish phase**.
The **key resistance at 111K** has been broken, and price is pulling back toward that level.
The structure remains bullish, supported by **sufficient volume** and **no clear bearish divergence**.
If current support holds, there’s potential for continuation toward the **113,500–114,000** range.
⚠️ **Warnings:**
* If the pullback turns into a breakdown (falling below **110,200**, then **109,000**), it would signal **buyer weakness**, and strategy must be reconsidered.
* Watch for **RSI divergences** or **declining volume** during further rallies—they may indicate caution.
* Prolonged consolidation **below broken resistance** could also indicate market weakness.
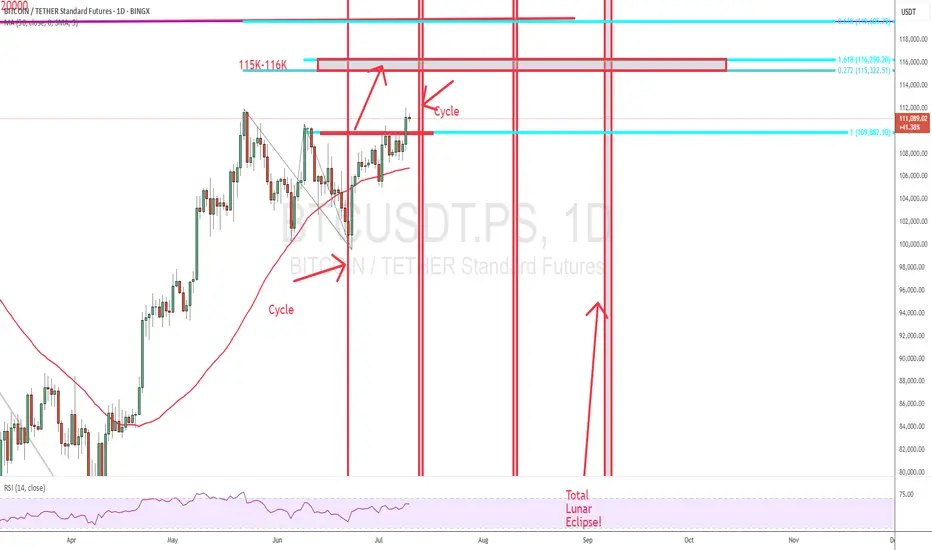
BTC - Last Chance to Prepare for Potential Flash Crash (Full) Expanding on my previous update - this chart is the zoomed out and expanded look at correction movement and liquidity zones to these lows.
Pathway to these levels is filled with long position stop losses - sell orders leveraged.
Orders triggered will create a cascading chain reaction and this is why we see fast movements and “stop hunts” as they are AKA.
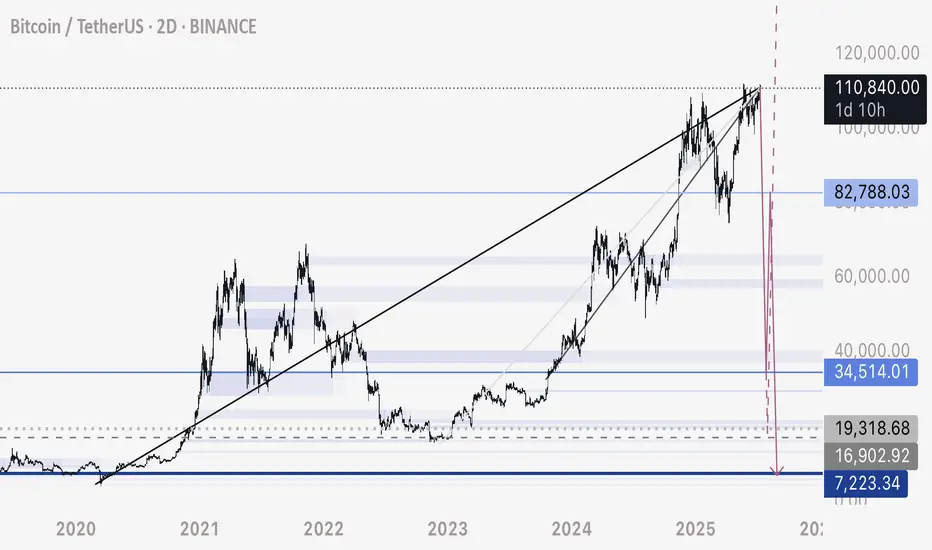
BTC - Last Chance to be Mindful of Potential Flash CrashBTC is at the top of the zone of this bearish retest.
DXY is currently retesting a major breakdown on the monthly time frame - which projects out a 2-4 year bull run for BTC.
Due to this major macro turning point, it’s possible we see an extreme liquidity grab crash on Bitcoin - recovering liquidity as shown on this chart.
Projected movements marked here.
Be prepared for anything - volatility expected

TradeCityPro | Bitcoin Daily Analysis #124👋 Welcome to TradeCity Pro!
Let’s dive into the analysis of Bitcoin and key crypto indicators. As usual, I’ll review the futures triggers for the New York session.
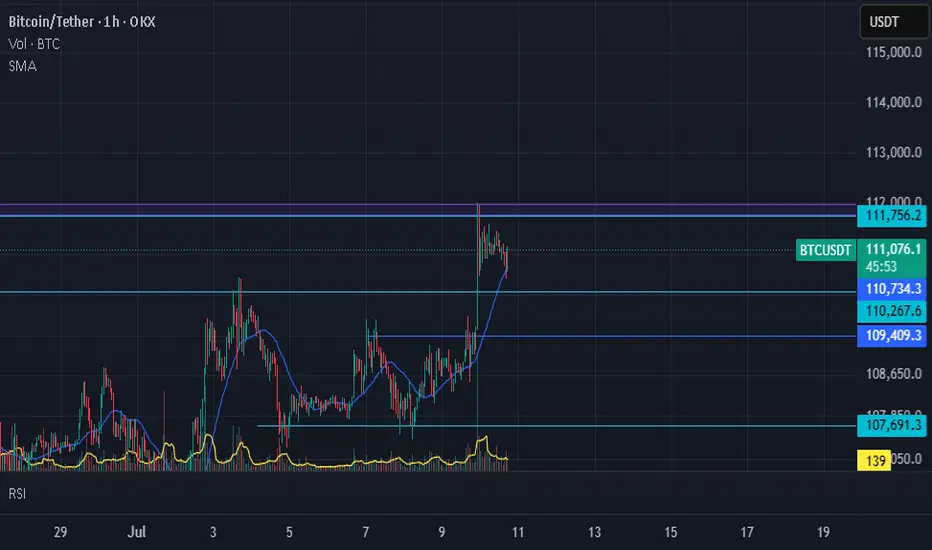
⏳ 1-Hour Timeframe
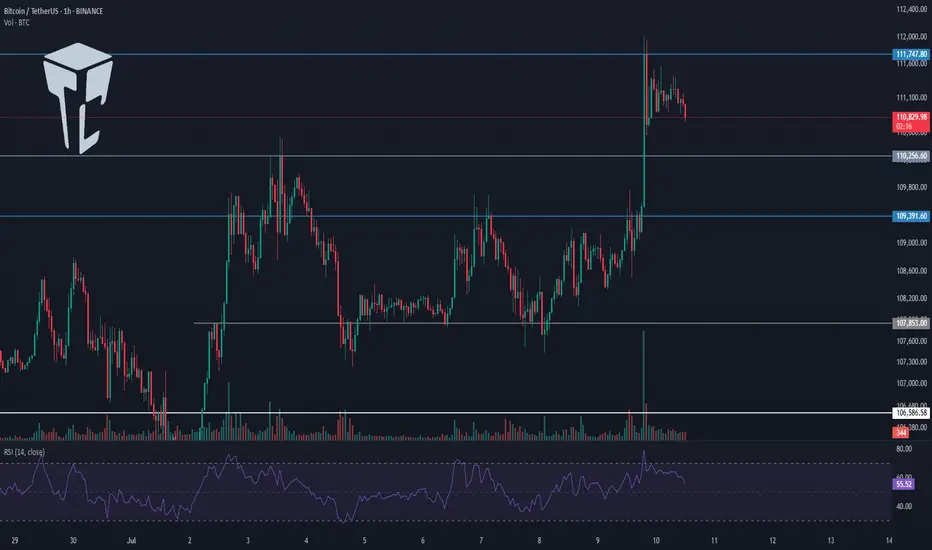
On the 1-hour timeframe, as you can see, Bitcoin made a bullish move yesterday after stabilizing above the 109391 level and managed to register a new ATH around the 112000 level.
⭐ The resistance at 111747 has effectively held back further price increases, and the price has reacted to it and entered a corrective phase.
✔️ I believe the correction could continue down to 110256. The next lower support levels are 109391 and 107853.
📈 If you already have a long position open, I recommend holding it. If the 111747 resistance breaks, a strong bullish trend could begin, and having an open position from earlier could have a big positive impact on your account.
🔼 If 111747 is broken, we can consider opening new long positions. If this level breaks, I’ll post a higher timeframe analysis to identify the next major resistance levels.
💥 RSI entering the Overbuy zone and rising volume would provide strong confirmation for this position.
👑 BTC.D Analysis
Bitcoin Dominance is still dropping. Yesterday, after breaking 64.81, it continued its downward move and is now approaching the 64.49 level.
🔍 If this level breaks, the drop could continue further, but in my opinion, after the recent drop, it's time for BTC.D to enter a correction phase.
📅 Total2 Analysis
Total2 has also had a bullish move, breaking through the 1.18 and 1.2 levels, and continues to rise.
🎲 The next resistance is at 1.24, which the price may target. However, I think there’s a high chance of a correction or consolidation phase starting soon.
📅 USDT.D Analysis
Looking at Tether Dominance, after the recent drop and the break of 4.72, it reached the 4.63 level and has formed a base there.
✨ If 4.63 breaks, USDT.D could head toward 4.56. In case of a pullback, the first level to watch is 4.72.
❌ Disclaimer ❌
Trading futures is highly risky and dangerous. If you're not an expert, these triggers may not be suitable for you. You should first learn risk and capital management. You can also use the educational content from this channel.
Finally, these triggers reflect my personal opinions on price action, and the market may move completely against this analysis. So, do your own research before opening any position.
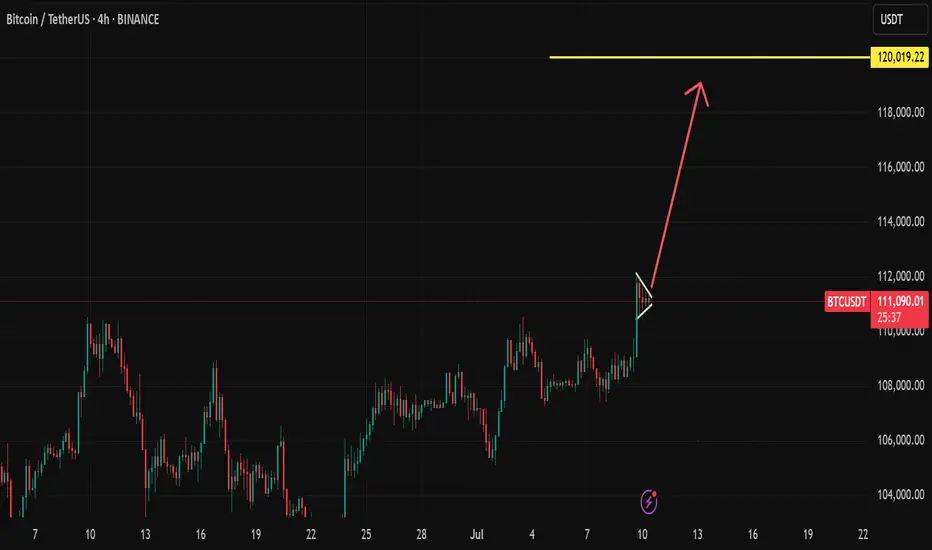
btc/usdtHello friends, Bitcoin has finally hit another historic high, and as we said in our previous analysis, this time we are definitely going for the $120 and $130 targets. What do you think?
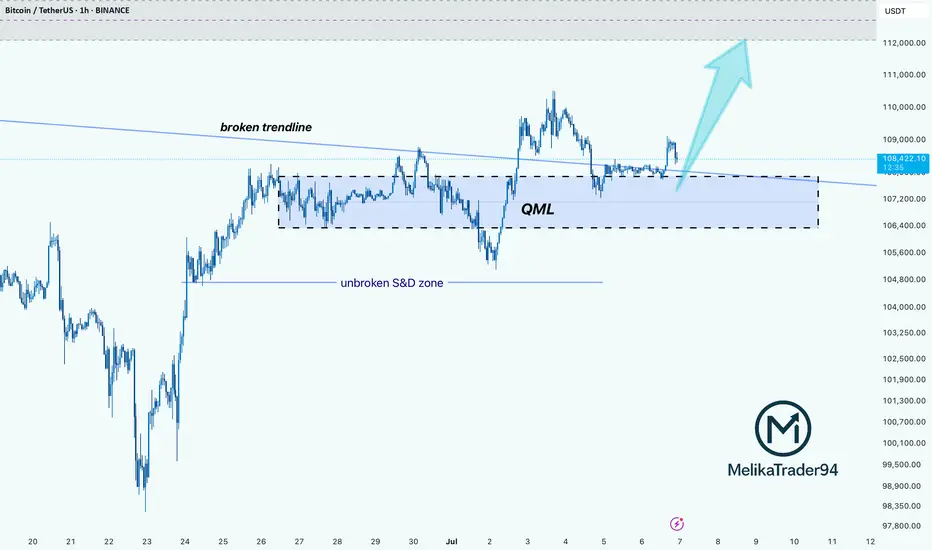
BTC: Demand Zone + QML + Trendline Flip = Perfect SETUPHello guys!
BTC is showing signs of a potential bullish reversal, forming a Quasimodo Level (QML) setup inside a valid S&D zone that remains unbroken despite multiple tests.
The downward trendline has been broken and is now acting as support, aligning perfectly with the QML and demand zone. giving us a solid confluence area.
Important to watch:
Rejection wicks and volume building at $106.6K–$107.4K zone show strong buyer interest.
If price can reclaim $109K and consolidate above, we could see a move toward $112K and higher.
Invalidation below $106.4K suggests the demand has failed, and bears may regain control.
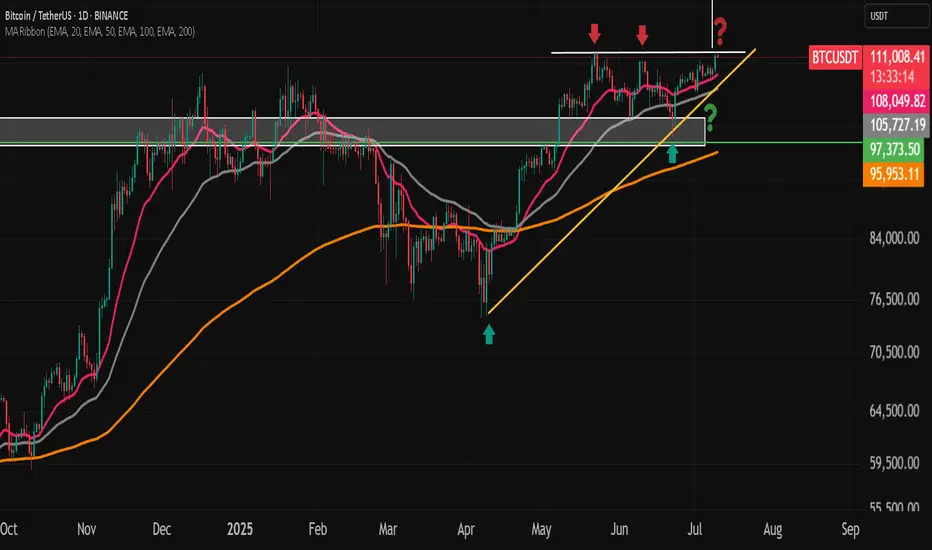
BTCUSD – Is This the Macro Top? Sell?This analysis is based on a convergence of classic technical signals, structural wave counts, and institutional order flow. Together, they strongly suggest that we may be witnessing a macro distribution phase, possibly leading into a larger correction.
1. Elliott Wave Count (Supercycle and Cycle Degree)
-Clear channel from 2018–2025 defining the entire impulsive structure.
-Final wave V is subdivided into five minor waves, with the fifth showing characteristics of an ending diagonal (low momentum, overlapping waves).
-Sructure is consistent with terminal wave exhaustion, including a false breakout and multiple rejections.
2. Volume Profile and Institutional Flow
-High-volume nodes at the top (Coinbase/Binance) align with historical distribution zones, not accumulation.
-Likely OTC activity as smart money exits quietly near all-time highs.
-VPVR shows major support clusters far below current levels (100k–88k), highlighting inefficient price zones above.
3. Weekly Technical Indicators
-RSI (classic and McAfee-based): long-term bearish divergence vs price.
-Stochastic RSI: extended overbought conditions; full cycles often reverse from this zone.
-MFI (Money Flow Index): >80 — historically precedes top formation in BTC.
-MACD: approaching a potential bearish cross in the coming weeks.
-WaveTrend Oscillator: peaking — behavior matches major tops in 2021 and 2017.
4. Moving Averages & Structural Support
-EMA21 (Weekly): ~96k — likely target for wave A of a corrective phase.
-EMA50: ~87k — coincides with cluster of historical buying interest.
-EMA100/200: ~68k and ~50k — long-term value zones if correction deepens.
5. Pivot Levels & Price Structure
-Price reached R1 (112,400) and is showing rejection — classic pivot reversal behavior.
-S1/S2 (~100–92k): probable short-term correction zones.
-S3/S4 (<88k): targets for deeper wave C or end of macro correction.
6. Institutional Behavior & Sentiment
-Large buying volume at the highs does not represent breakout momentum — likely retail absorption of institutional selling.
-Momentum divergence and false breakout behavior reinforce the distribution thesis.
-Sentiment: overly bullish news and euphoria align with classic retail top behavior.
Conclusion
This confluence of Elliott Wave structure, volume profile, indicator exhaustion, and institutional flow activity points to a high-probability macro top in Bitcoin. While no analysis is infallible, the alignment of so many signals is rare and demands attention.
Disclaimer:
This is not a recommendation to sell. This is a technical analysis intended purely for educational and analytical purposes.

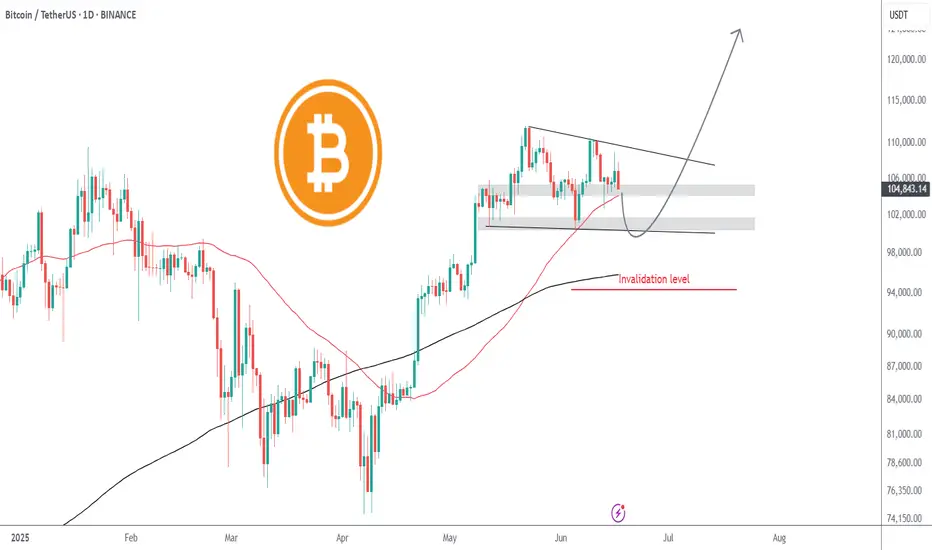
BTC USDT ANALYSESBitcoin (BTC) is currently forming an ascending triangle, which is typically a bullish continuation pattern. If BTC breaks out of the triangle to the upside, my target would be around $130,000.
However, we also have a long-term ascending trendline that BTC has been respecting for a significant period. If BTC fails to break out of the ascending triangle, we may see a pullback toward this trendline. Notably, there is also a strong demand zone in that area, which could act as support.
On the weekly timeframe, there is a visible regular bearish divergence—a bearish signal that suggests a potential slowdown or correction. If the divergence plays out, a realistic downside target could be around $100,000 to $98,000.
#BTC Rising Wedge📊#BTC Rising Wedge📉
🧠From a structural point of view, we are trading sideways above the support-resistance conversion zone, and the bullish force is gradually weakening. Only if we break through the blue turning point 109669, will new bullish expectations appear, otherwise we need to be alert to the correction at the daily level.
➡️From a graphical point of view, a rising wedge is formed here, and we usually fall according to this model. At present, it has fallen below the lower edge of the wedge and rebounded to the lower edge and was blocked. I expect a further decline.
Let's see👀
🤜If you like my analysis, please like💖 and share💬 BITGET:BTCUSDT.P

HolderStat┆BTCUSD fixed above the triangleBINANCE:BTCUSDT is rebounding from a consolidation base at $106,000 with strong bullish structure. The triangle breakout and recent higher lows point toward a move to $115,000–$120,000 if momentum continues.

Bitcoin to revisit $100k | Summer price target = $120kGeopolitical tension is causing fear in the markets. Today, Bitcoin fell from $107.7k to current price $105k with no sign of buyer support whatsoever, printing 11 consecutive H1 red candles intraday. Like a hot knife through butter.
At $105k, there is very little support. Sell volume absolutely overshadowed the tiny buy volume. Bulls have yet to close a green candle. I believe in the next few hours Bitcoin will be trading at $104k, followed by the first stop $102k.
$102k can serve as an entry point, depending on how price reacts. $100k is the optimal entry point for maximum profit, after mass liquidations. Retail traders are confident that the liquidity hunt is over after the initial tap, placing stops and liquidation levels at $100k.
Invalidation level will be beyond the 200SMA. The 200SMA have historically proven itself time and time again as a safe zone during rallies after golden crosses.
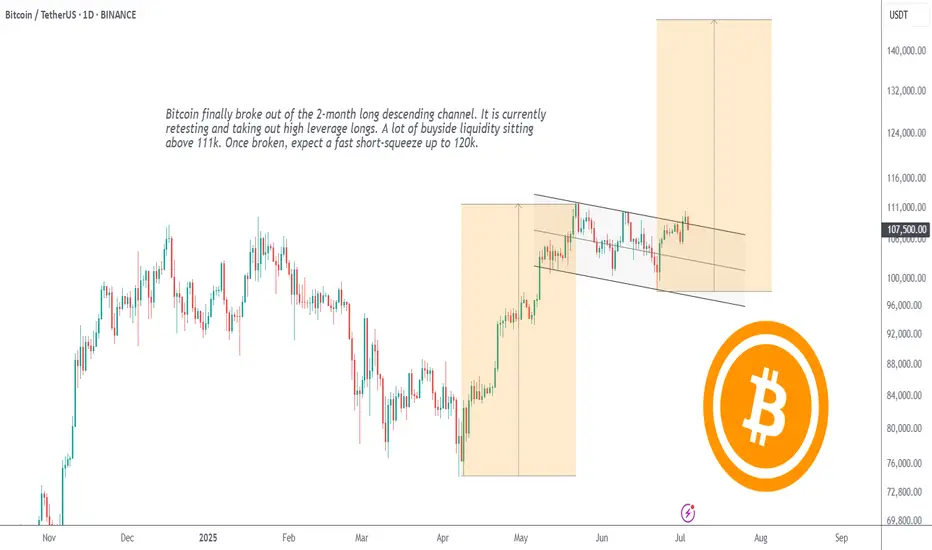
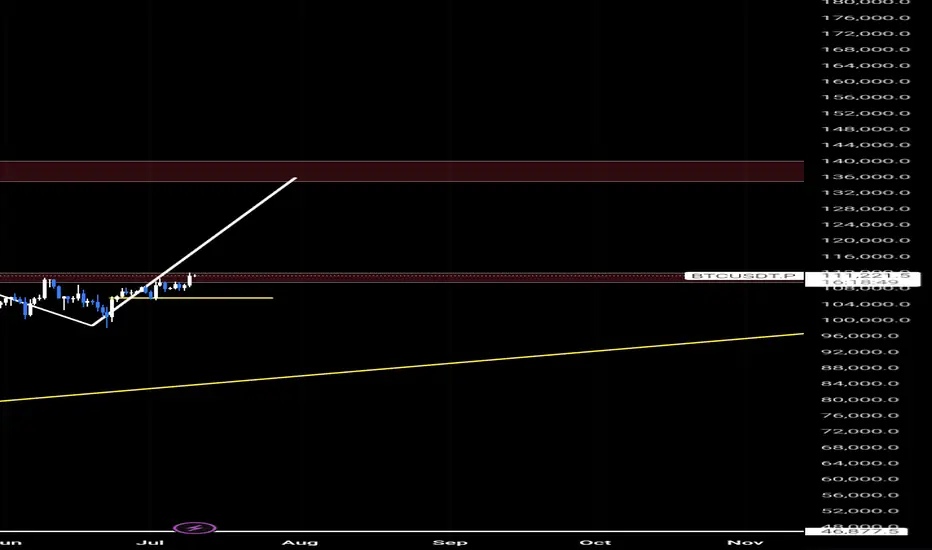
Bitcoin turns bullish again | Price target = $140k++After 2 months of consolidating within a descending channel, Bitcoin has finally broken out, confirming a major technical breakout and shifting the structure back to bullish. The breakout was followed by a clean retest of the channel resistance turned support, which is now acting as a launchpad for the next leg up.
🧠 Technical Analysis:
Descending Channel Breakout: Price has convincingly broken out of the downward sloping channel, invalidating the bearish structure and flipping it bullish.
Retest Confirmation: The price is currently retesting the upper boundary of the channel — a textbook bullish retest. This confirms buyer strength and shakes out weak hands.
Liquidity Magnet Above 111k: A significant cluster of buyside liquidity sits above 111k. Once that level is breached, expect an explosive acceleration toward 120k.
Measured Move Target: Based on the height of the prior impulse (from April to May), the projected extension points to ~140k.
🌍 Macro & Sentiment Drivers:
ETF Flows & Institutional Demand: U.S. Bitcoin Spot ETFs continue to show consistent inflows, signaling strong institutional accumulation — a major shift in long-term demand.
Fed Pivot Speculation: Expectations for a Fed rate cut later in 2025 are building. Lower interest rates could fuel risk-on sentiment, pushing capital back into crypto.
Big Beautiful Bill: This bill is expected to inject money into the economy, increasing liquidity — ultimately going into crypto. This bill will be signed into law today.
Bullish crypto developments: Settlement of the XRP SEC case, spot crypto ETFs, mainstream crypto adoptions, etc. will all contribute to the bullish sentiment.
🧩 Final Thoughts:
This setup combines strong technical structure, favorable macro tailwinds, and clear liquidity targets. The coming days are critical — if Bitcoin clears 111k cleanly, it could trigger a short squeeze and FOMO-driven rally straight into 120k.
Bitcoin may correct after false ATH breakoutBitcoin is forming a false ATH breakout. There is a possibility of a correction beginning.
Consolidation is forming with a local upward support line (accumulation of potential before correction).
A breakdown of 110K could cause the correction to continue to 0.5 - 0.7f.

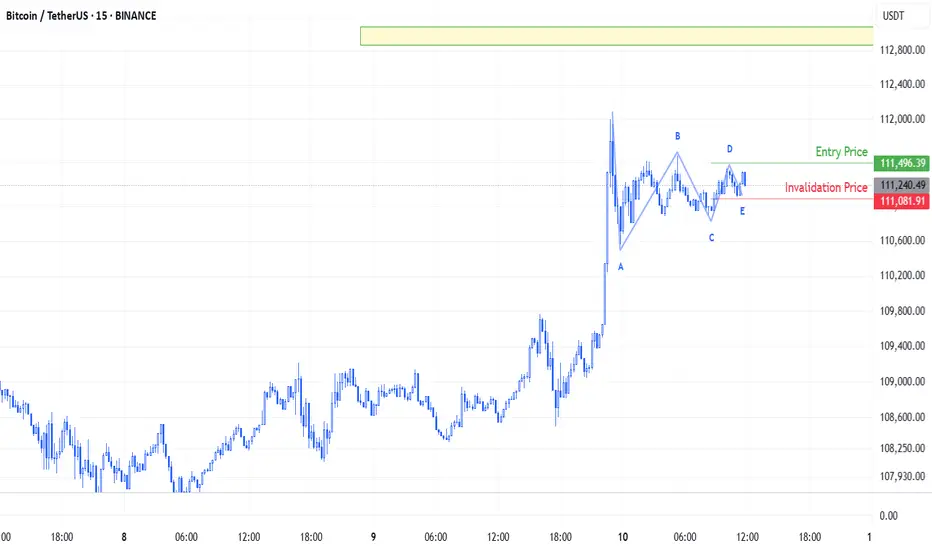
BTC/USDT Elliott Waves A symmetrical triangle has formed on BINANCE:BTCUSDT , most likely as part of Wave 4, following the previous explosive move.
Entry is triggered if the price breaks above Wave D of the triangle, and stop loss is placed just below Wave E.
Cluster analysis suggests that the price will likely reach near the 112,950 level.
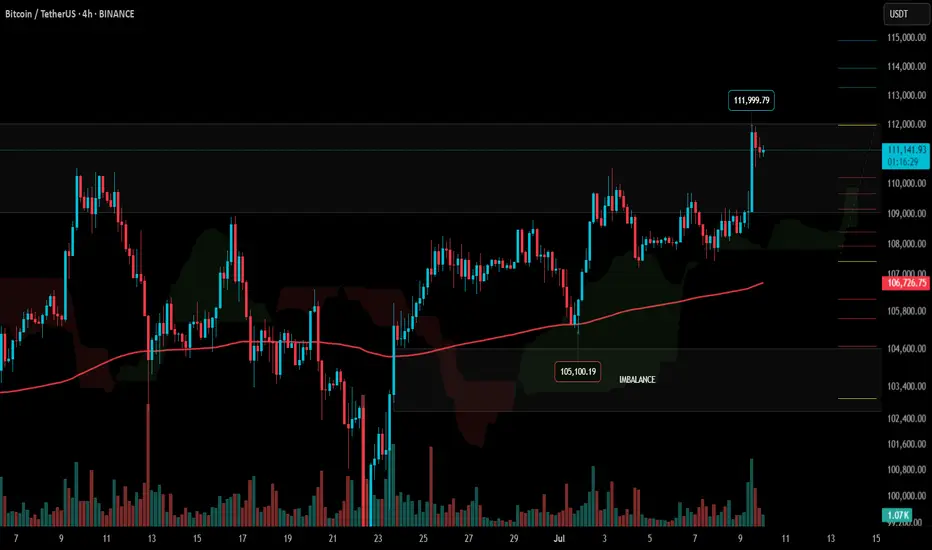
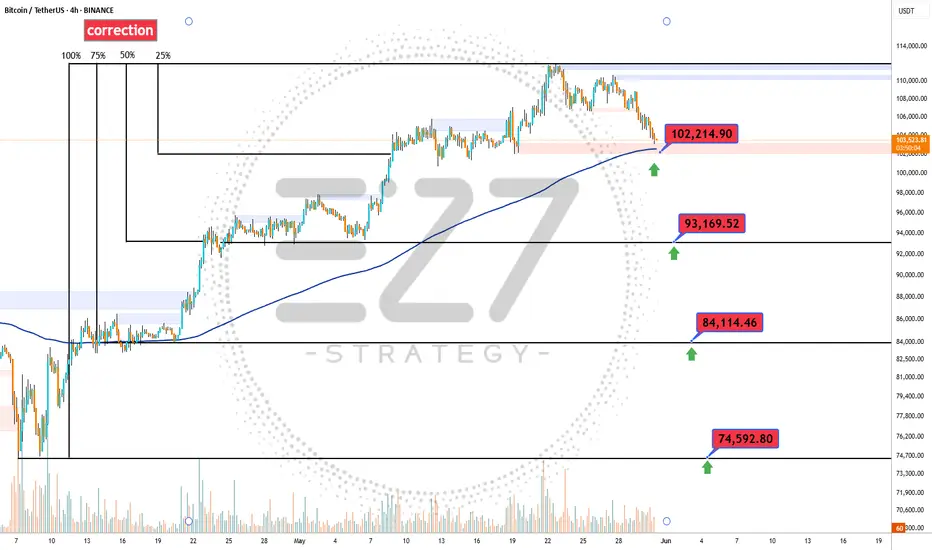
BTC Correction's 📉 Significant Bitcoin Correction During Uptrend
After a strong bullish rally, Bitcoin has entered a correction phase, retracing nearly 25% of its recent gains. Interestingly, this correction aligns exactly with the 200-period moving average on the 4-hour chart, marking a potential key support level.
🔍 Is Bitcoin’s Correction Over or Just Beginning?
The overlap with the 200 MA could signal the end of the correction, but if this zone fails to hold, deeper targets between the 35% and 75% retracement levels may come into play.
🛡️ Potential Support Levels for Bitcoin if the Correction Continues:
First support: 102,200 USD – 25% correction
Second support: 93,200 USD – 35% correction
Third support: 84,100 USD – 50% correction
Fourth support: 74,600 USD – 75% correction
Bitcoin Expecting Bullish FormationBitcoin could be triggered by negative news from the U.S. regarding tariffs, which may create market uncertainty and push investors toward risk-off or alternative assets like crypto.
Currently, Bitcoin is reacting to the decline caused by fundamental negative data, but bullish sentiment remains alive as buyers attempt to hold key support zones. The focus now shifts to the psychological resistance near 110K
You may find more details in the chart.
Ps support with like and comments for more better analysis.

BTC/USDT — New Local High, Trendline BrokenBitcoin has officially broken out of a descending trendline and just made a new local ATH, flipping key resistance into support.
Structure:
Descending wedge breakout
Clean move above 111.8K zone
Confirmation pending with retest
Strategy:
Wait for the retest of the breakout zone for ideal entry.
Entry: 110.5K – 111.2K (on confirmation)
Stop Loss: 108.5K
Targets:
113.5K (minor)
116.8K
122.3K
Expected Move: ~10%–12% upside
BTC continues to show strength, and the breakout confirms bullish momentum. This is the Ideal time to watch for long entries on pullbacks.
DYOR | Not financial advice

Bullish on BTC Here is a clean, professional analysis of your BTCUSDT 1D chart:
---
1️⃣ Chart Context
Pair: BTCUSDT.P (Perpetual Futures)
Timeframe: Daily
Current Price: ~111,350
Chart Type: Breakout and projection mapping
Key Levels Marked:
Resistance zone: 134,989 – 140,087
Support trendline (yellow): Ascending from March low
Local horizontal support (yellow): ~104,000 region
---
2️⃣ Structure Analysis
🔹 Trend
BTC is in a strong uptrend with higher highs and higher lows since March 2025.
A breakout from a flag/pennant pattern has recently occurred, signaling continuation.
🔹 Support & Resistance
Current resistance zone (~111,000–113,000): Price is testing this zone.
Major resistance zone (134,989 – 140,087): Strong supply zone for future targets.
Trendline support: Acts as dynamic support, currently near 100,000, rising weekly.
---
3️⃣ Price Action
A clean breakout candle is seen above the consolidation.
Retest of breakout zone possible (~108,000 – 110,000) before continuation.
A measured move aligns with a potential target to 135,000–140,000.
---
4️⃣ Projection Plan
Based on my white projection arrow: ✅ Base scenario: Price breaks above the local consolidation cleanly and heads toward 135,000–140,000. ✅ Retest of the breakout zone may occur to grab liquidity before the push. ✅ If price closes above 113,000 on a daily, momentum confirmation for the run is strong.
5️⃣ Trade Plan (Not Financial Advice)
Entry: On breakout confirmation above 113,000 or retest near 108,000–110,000 with bullish confirmation.
Target: 134,989 and partial close, then 140,087 final target.
Stop Loss: Below local support (yellow line) near 104,000 or trendline depending on risk appetite.
Risk Management: Size positions to risk max 1–2% per trade.
6️⃣ Potential Risks
⚠️ Global macroeconomic conditions or sudden BTC volatility. ⚠️ Fake breakout wicks trapping longs above 113,000. ⚠️ Daily close below 104,000 would invalidate bullish structure in the near term.
Summary
BTCUSDT is in a bullish continuation structure aiming for 135–140K.
Price is currently at a critical breakout level; a clear close above and retest would be optimal.
Manage risks with clear invalidation below 104,000
Bitcoin: New highs are ready to break
In-depth analysis of the Bitcoin market: Breakthrough opportunities under the resonance of fundamentals and technical aspects
I. Overview of the current market situation
As of July 10, 2025, the price of Bitcoin is currently in a high consolidation stage after breaking through $112,000 to set a record high. The highest increase in 24 hours was 3%, and the cumulative increase this year was about 19%, showing a strong upward momentum2. However, market volatility is still significant. The latest data shows that the amount of liquidation in a single day is as high as $510 million, involving more than 100,000 traders2, reminding investors to maintain risk awareness in optimism.
II. Key drivers of fundamentals
1. Improved policy environment
US cryptocurrency regulation is turning to a loose direction. The regulatory roundtable promoted by the new SEC Chairman Paul Atkins is expected to implement new policies in July-August, aiming to define clear regulatory boundaries, reduce law enforcement actions, and promote the United States to become a global crypto asset center2. This policy shift has significantly boosted market confidence and removed some obstacles for institutional funds to enter the market.
2. Institutional funds continue to pour in
The net inflow of spot Bitcoin ETFs in 2025 has reached US$14.4 billion2, indicating that the traditional financial market's acceptance of Bitcoin continues to increase. 135 listed companies such as MicroStrategy have included Bitcoin in their balance sheets2, and corporate-level allocation demand has formed a stable buying support. The recent weaker-than-expected US employment data has strengthened the Fed's expectations of a rate cut in September, further prompting funds to accelerate the inflow of risky assets such as Bitcoin2.
3. Market narrative upgrade
The role of Bitcoin has shifted from "alternative currency" to "reserve asset", and CICC pointed out that its positioning as "digital gold" is widely accepted2. National-level allocation cases are also increasing, such as Pakistan's announcement of the establishment of a strategic Bitcoin reserve2. This narrative shift is reshaping the value assessment framework of Bitcoin.
4. Macroeconomic linkage
The Federal Reserve's monetary policy remains a key variable. Trump's chief adviser recently publicly accused Powell of being the "worst Federal Reserve chairman in history", saying that if interest rates are not cut on July 29, "catastrophic consequences"3 may occur3. At the same time, the US trade policy of imposing a 50% tariff on copper (to be implemented as early as August 1) has exacerbated market uncertainty3. Historical data shows that Bitcoin often performs well in liquidity easing cycles, and the current market's expectations for interest rate cuts are forming potential positives.
III. In-depth analysis of technical aspects
1. Key price structure
After breaking through the horizontal consolidation range, Bitcoin is currently in a high-level accumulation state:
Upper target: The historical high of $112,000 is the recent key psychological resistance, and a new upside space may be opened after breaking through2
Recent support: $110,700 (top and bottom conversion position) constitutes the first line of defense
Trend support: $109,700 (upward trend line) is an important line of defense for bulls
Key defense: There is significant liquidity support in the $108,500 area, and a break below may drop to the $106,000-107,200 support area26
2. Technical indicator signals
Trend indicators: Moving averages of all major time frames (5-day to 200-day) remain in a bullish arrangement, confirming that the overall upward trend remains unchanged4
Momentum indicators: RSI is in the neutral area near 53, not showing overbought; MACD remains positive despite slightly weakened momentum6
Volatility analysis: Bollinger Bands continue to narrow, and EMA on the 4-hour chart converges, which usually indicates that major fluctuations are coming5
Derivatives data: Binance CVD (cumulative volume increment) continues to be negative, indicating that selling pressure exists, but spot buyers successfully defend key support5
3. Main capital movement
The disk shows that $23 million of unfulfilled sell orders are piled up at the $110,000 mark, forming a significant resistance9. At the same time, there is a $17.27 million buy support in the $108,388-108,500 range9, indicating that the long and short sides are fiercely competing in the current area. This large order distribution pattern suggests that the market may test the upper resistance first and then fall back to consolidate.
IV. Operational strategy recommendations
1. Trend trading strategy
Long position layout: Establish long orders in batches in the support area of 110,700-109,700 US dollars, and set the stop loss below 108,500 US dollars
Breakthrough chasing long: If the price stands above 112,000 US dollars, you can add positions, and the target is 114,500 US dollars (potential area for short squeeze)2 and higher
Target setting: Short-term target is 112,000 US dollars, and the medium-term target can be seen to 116,000 US dollars2 or 137,000 US dollars4 according to the volume
2. Reversal trading strategy
Short opportunity: If it falls below $108,500 and then rebounds to $109,700 without breaking, you can try shorting with a light position, and set the stop loss above $110,700
Deep correction: If it falls below the $108,500 support, it may test the $106,000-107,200 area6, and then you can observe the stabilization signal
3. Risk management points
Position control: The risk of a single transaction should be controlled within 2% of the total funds
Leverage use: It is recommended not to exceed 3-5 times leverage in the current high volatility environment
Event sensitive period: Focus on key points such as the Federal Reserve’s interest rate decision on July 29 and the implementation of the tariff policy on August 137
V. Outlook and conclusion
1. Short-term (1-3 months) outlook
Bitcoin is currently in a favorable environment where technical and fundamental resonances occur. If ETF fund inflows continue or the Federal Reserve releases a clear signal of interest rate cuts, the price is expected to test $116,0002. However, we need to be alert that regulatory policies that fail to meet expectations or macroeconomic deterioration may lead to a pullback to the $102,000-105,000 support zone27.
2. Long-term (until 2030) value prospects
Cycle model: According to the peak rule of 550 days after halving, this round of bull market may have a 2-3 month peak window2
Technical target: Long-term rising channel points to $168,500 (Fibonacci extension level)2
Scarcity drive: After the halving in 2030, the supply will further shrink, coupled with the global inflation hedging demand, and the highest is expected to reach $660,4712
3. Summary of investment advice
Bitcoin's breakthrough of $112,000 is the comprehensive result of policy, liquidity and narrative upgrades2. The current technical structure remains bullish, and it is recommended to focus on low-multiple ideas, focusing on the $110,700-109,700 support area. Investors should pay attention to low-friction investment channels such as spot ETFs, avoid high leverage operations, and prepare for potential fluctuations. As the institutionalization process accelerates, Bitcoin is completing the transformation from a marginal asset to a mainstream configuration option. Long-term investors can seize the layout opportunities brought about by every major pullback.

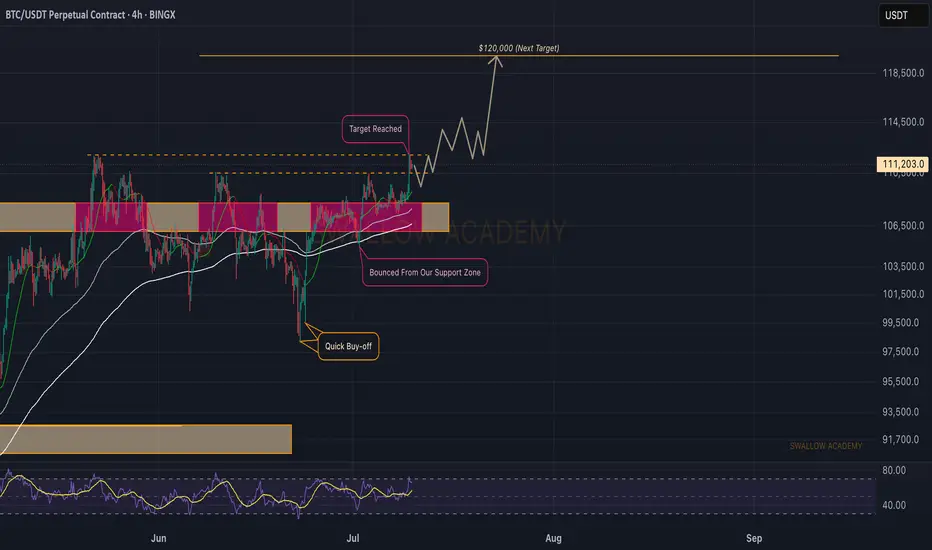
Bitcoin (BTC): New ATH Incoming | Aiming For $120KBitcoin is at ATH, where there is a high chance for a breakout and our next target of $120K to be reached from here.
People have euphoria for the new ATH; the money inflow is huge where whales are and have been stacking the BTC little by little.
Now with the new ATH, we have to remember there is no accurate way to predict potential resistance, so we have to base our bets on zones like $120K and $140K (round numbers).
Those 2 zones are our current targets!
Swallow Academy
#BTC Update #5 – July 10, 2025🟠 #BTC Update #5 – July 10, 2025
Bitcoin is currently trading inside a supply zone and seems to be preparing for a corrective move after its impulsive rally — but the first clear step of that correction has yet to appear. At the same time, USDT Dominance is hovering near a support zone. If it bounces from here, Bitcoin’s pullback could accelerate.
Additionally, BTC has approached a previous resistance level, making it an uncertain area for new entries. At this stage, I don’t find it logical to open either a Long or Short position. Once the correction completes, the first major target is likely the 123,250 zone.
For now, I’m just monitoring. No trade recommendation at this time.