#BTC Update #5 – July 10, 2025🟠 #BTC Update #5 – July 10, 2025
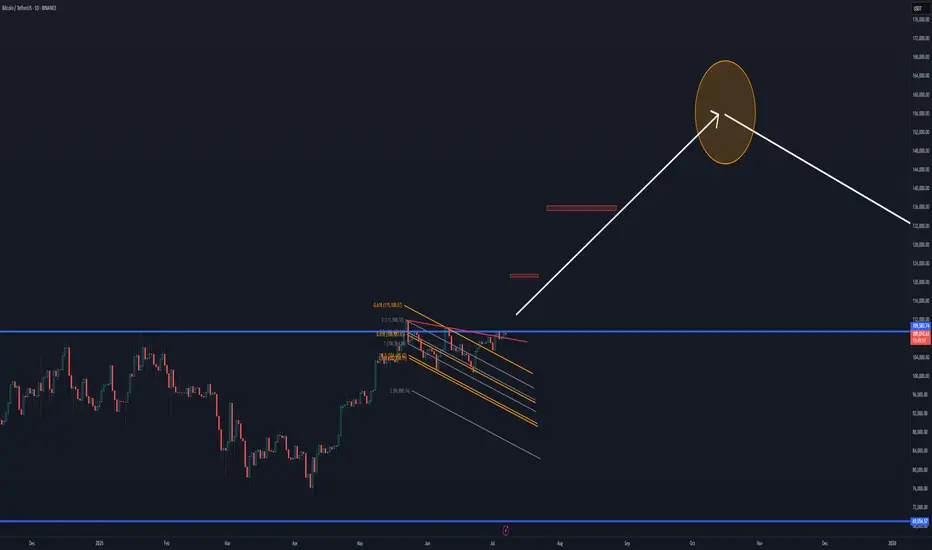
Bitcoin is currently trading inside a supply zone and seems to be preparing for a corrective move after its impulsive rally — but the first clear step of that correction has yet to appear. At the same time, USDT Dominance is hovering near a support zone. If it bounces from here, Bitcoin’s pullback could accelerate.
Additionally, BTC has approached a previous resistance level, making it an uncertain area for new entries. At this stage, I don’t find it logical to open either a Long or Short position. Once the correction completes, the first major target is likely the 123,250 zone.
For now, I’m just monitoring. No trade recommendation at this time.
BTCUSDT trade ideas
BITCOIN ATH? More to come!With BTC seeing a new ATH, speculations are there for whether it continues in upward projection or falls back.
My prediction is simple, CRYPTOCAP:BTC will do a temporary pullback around the 109,000$ region and goes back up to around 113,000$ within the shortest time.
This temporarily pullback will be a result of buyers who already took their profits. Of course, Institutional investors are even more poised to buying more.
News may impact this projection but investors are willing to see it fly.
Ultimately, you can never go wrong with Bitcoin buy.
#DYOR #NFA
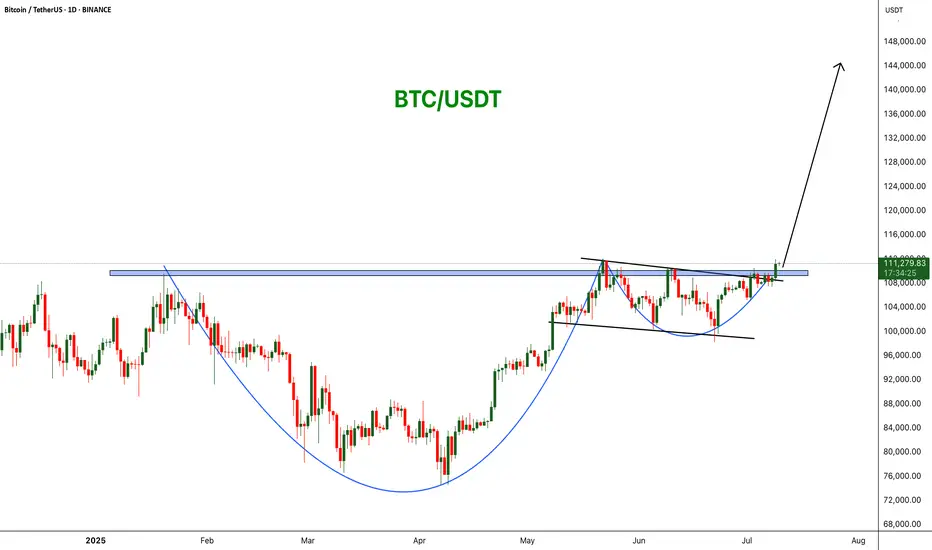
BTCUSDT: Cup and Handle Breakout! BINANCE:BTCUSDT is forming a powerful bullish breakout from a cup and handle pattern on the daily chart. Price has cleared key horizontal resistance around $110,000, signaling strength and the potential for a continuation move toward $144,444.
Stop Loss: $98K
Target : $144k
CRYPTOCAP:BTC
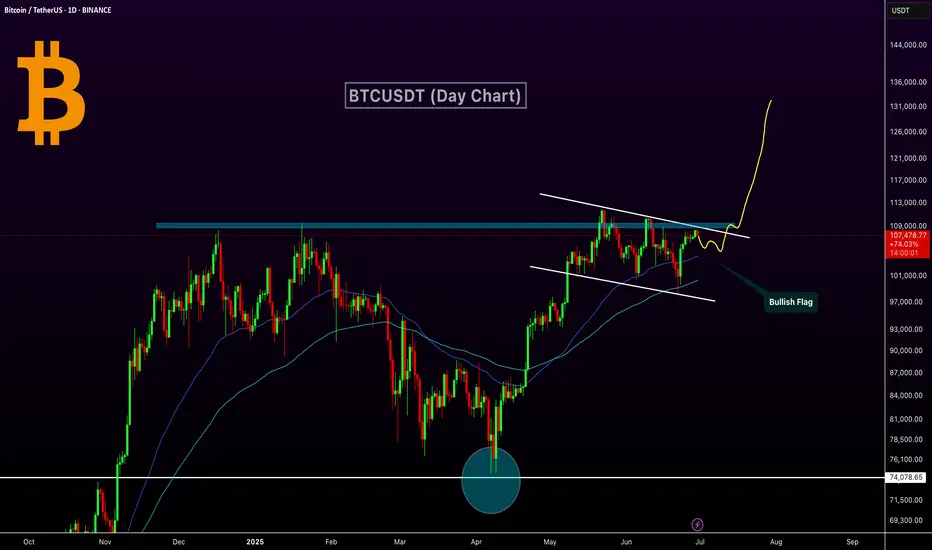
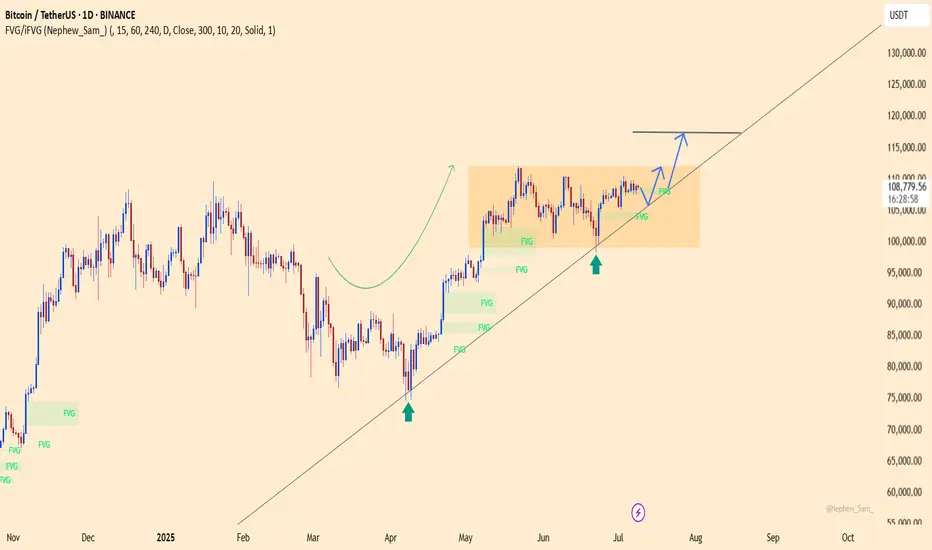
Bitcoin Bullish Flag Breakout Incoming?MARKETSCOM:BITCOIN is currently consolidating within a bullish flag pattern on the daily chart, following a strong impulse move from the $74,000 support zone marked in April. The price is hovering near a critical horizontal resistance zone ($ 108,000–$ 109,000), which has historically acted as a major barrier to further gains.
Technical Highlights:
Bullish Flag Pattern: Clear flag formation after a strong uptrend, suggesting continuation potential.
Strong Support Rebound: April's bounce from the ~$74K support zone marked a key higher low.
EMA: Price is currently trading above both the 50-day and 100-day EMAs — a bullish sign of momentum.
Breakout Potential: A confirmed breakout above the flag resistance (~$109K) could ignite a strong rally toward $130K+.
Breakout Move: If the flag pattern plays out, CRYPTOCAP:BTC could target the $125K–$135K zone in the coming weeks.
Buy Entry: Once the day candle closes above the flag resistance line
Bitcoin Tests Range High — Breakout or Rotation lower?Bitcoin is currently trading at a critical resistance level — the previous all-time high — which also marks the upper boundary of its multi-month high time frame range. While many are watching for a breakout, price action suggests that a continuation of range-bound behavior is still the more likely scenario. Without decisive volume or structural confirmation above this resistance, BTC may be gearing up for another rotation toward lower support.
Key Technical Points:
- Key Resistance at ATH: Bitcoin is retesting its prior all-time high, which is the current range high
- Volume Remains Weak: Lack of breakout volume signals indecision and caution
- Liquidity Now Resting Below: Upside liquidity has been cleared; downside offers more incentive for market makers
Bitcoin’s price has once again returned to the range high, aligned with its previous all-time high — a level that has consistently capped price over recent months. This area has acted as a significant inflection point where momentum has historically slowed, and price has failed to push through with conviction.
Currently, price action is showing signs of stalling, and importantly, there has been no influx of volume to suggest a true breakout is underway. When volume fails to accompany a test of resistance, it often signals weakening demand or exhaustion from buyers — increasing the risk of a false breakout or rejection.
Additionally, the upside liquidity has already been taken, meaning there’s now less incentive for large players to push price higher in the immediate short term. In contrast, resting liquidity lies beneath current levels, offering greater appeal for a downward move — particularly for market makers seeking efficiency and liquidity capture.
From a technical perspective, Bitcoin remains range-bound until a decisive breakout above the highs occurs with supporting volume and strong candle closures. As of now, this has not happened, keeping the likelihood of a rotation lower well on the table. Should price begin to trade down, watch for a move toward the mid-range or even the lower boundary of the range, depending on how momentum unfolds.
Unless Bitcoin breaks above its all-time high resistance with strong volume, expect the range structure to hold. A lack of bullish follow-through may lead to a rotation toward lower support levels.

#BTCUSDTbearish side of the btc is slow, as the volume of sell is not that high...…any strategy doesn't fit the lower low, i am seeing btc to the 132k.
anyone overthere with a new different strategy regarding btc?
BTC ALL SET FOR MAJOR HIGHS The price has tested the resistance line multiple times showing strong supply/resistance. Buyers are gradually pushing price higher (higher lows), but momentum is weakening near resistance.
This is a sign of consolidation under resistance pattern before breakout .Rising wedge typically breaks down signaling a potential drop, it confirms weakening momentum.
Area to Watch for Entry
103000-104000 (recent demand zone) for Bullish
After daily candle closes above 113000 instant bullish Entry.

DeGRAM | BTCUSD once again trading above $105k📊 Technical Analysis
● Fresh bounce off the confluence of the 8-month up-sloping purple trend-line and 102-103 k green demand box prints a higher-low inside the rising wedge, keeping bulls in control despite June’s pull-back.
● Price is reclaiming the minor down-trend line from the 12 Jun high; a daily close above 106 k confirms a bear-trap and unlocks the 111.8-112.5 k supply at the wedge cap.
💡 Fundamental Analysis
● Spot-ETF desks absorbed >5 400 BTC in the last three sessions while exchange reserves fell to a four-year low, signalling supply drain.
● Cooling US PCE expectations trimmed real yields, and Mt Gox repayment delays ease overhang fears—both supportive for risk assets.
✨ Summary
Long 102–104 k; hold above 106 k targets 111.8 k → 115 k. Bull thesis void on a 16 h close below 99 k.
-------------------
Share your opinion in the comments and support the idea with a like. Thanks for your support!

Bitcoin's New All-Time High = Altcoins Market Bull MarketThe shy new all-time high is in and it is good to be Bitcoin today. It is good to be Bitcoin, to be in Bitcoin and profit while trading Bitcoin but the bears got rekt and that's oookkkk. We accept their loss and it is their loss they earned it by being short when the market is good, bullish and strong. Who would short Bitcoin right before a new all-time high? I don't know.
A new all-time high was hit today, the price $112,000 but this is not the end. Not even close. This is the beginning of the next bullish wave.
I know what you are thinking, or might be thinking; Wait, but what about a drop? What about the correction? Will it go lower? Can I buy Bitcoin at 90K? I told you to buy when prices were low... "You would look like a genius for buying below 80K," 100K is already gone. No, no correction! Bitcoin is going up.
When resistance breaks it means higher. When prices move higher it means higher. When a new all-time high hits it means the bulls win. Now that the bulls won, the battle for the rise or the drop, we can expect higher prices. If you have any doubts, look at the altcoins. The altcoins market says we are entering a period of long-term growth.
Bitcoin will continue to hold strong. It will continue to rise surely, slowly, or fast, but long-term. It doesn't matter the speed; Bitcoin for the whales, altcoins for retail.
A small capital will grow faster with the altcoins because they have higher room for growth. The projects being smaller, more volatile makes for a good trading experience. Higher risk but also a higher opportunity to grow in the short- and mid-term. Bitcoin is good to retire now. Bitcoin is great to hold value, to support the market as it continues to grow.
For me and for you, welcome to the altcoins market bull market.
Thanks a lot for your continued support.
Namaste.
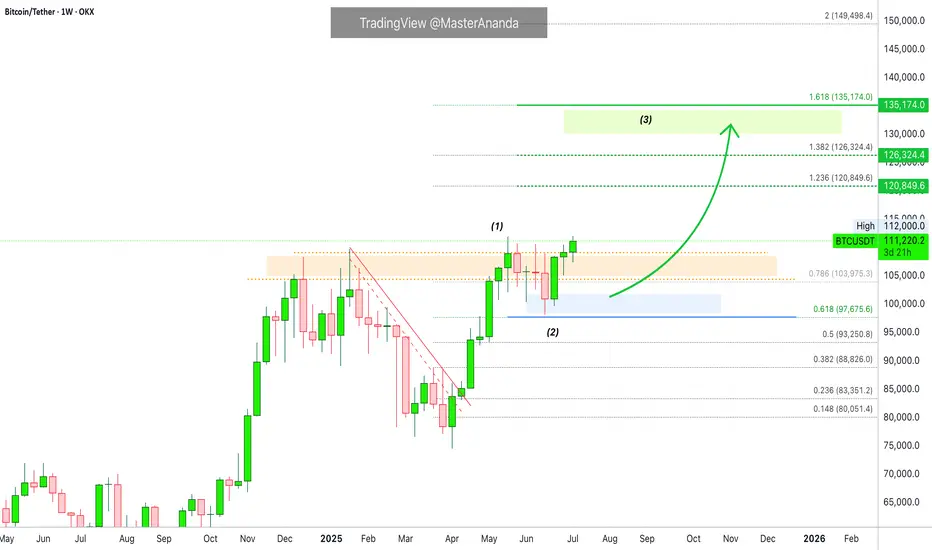
Bitcoin breakout is very closeBitcoin looks like it wants to break above its resistance and push upwards. My prediction still stands of 150-165k as cycle top.
Resistance levels (based on fib extension)
121.5k (0.618)
136k (1.00)
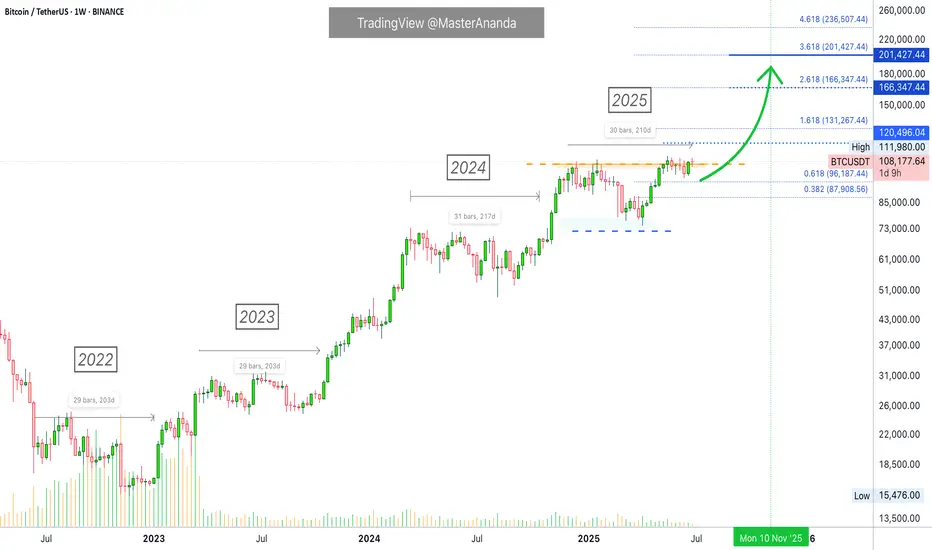
Bitcoin's Consolidation Almost Over —200-220 DaysBitcoin's consolidation period before a bullish breakout tends to last some 200-220 days on average. We have four instances of this pattern since the 2022 bear market counting 2025. Let's look at those. This proves that Bitcoin is set to grow in a matter of days. Continue reading below and make sure to boost. When you reach the end of the article leave a comment with your opinion about this issue. Do you agree? Do you disagree? Can you see what I mean?
» Back in 2022 Bitcoin consolidated for 203 days before a bullish breakout.
» Back in 2023 Bitcoin consolidated for 203 days before a bullish breakout.
» Back in 2024, last year, Bitcoin consolidated for 217 days before a bullish breakout.
It really depends on where you start counting for the total days but it all adds up to 200-220 days. With 220 being the maximum.
» Currently, in 2025, Bitcoin has been consolidating for 210 days. Looking at previous patterns, this means that only a few days are left before Bitcoin produces a bullish continuation.
We also saw that once Bitcoin breaks out of a this long-term consolidation range/period/phase, it never moves back to the lows of the consolidation range. That is, Bitcoin will never trade below 80K nor 90K once it resumes growing.
I am estimating that the next jump can start as early as next week. The entire move can take months to develop. After a peak is reached, Bitcoin will then start a new consolidation phase with a bearish bias first. This bearish bias produces a low after several months yet a strong higher low compared to the previous consolidation period which is current prices. After this low, more consolidation and then a new bullish jump.
If we take into consideration a bear market, then the dynamics can be different. Bear markets only happen once every four years. Seeing how different market conditions are now, the next bear market will be interesting because it won't be anything like the bear markets of the past. Bitcoin will remain much stronger but that is an analysis for another time.
Summary
Bitcoin is going up. It is very close now. When Bitcoin breaks up and hits a new all-time high, just to continue growing, the altcoins market will explode. You've been warned.
Now you can leave your comment.
Share your opinion on the comments section below. I know you have something to say. You've been trading Cryptocurrencies for years, buying and selling, making profits so... Are you ready for the 2025 bull market?
Thank you for reading.
Namaste.
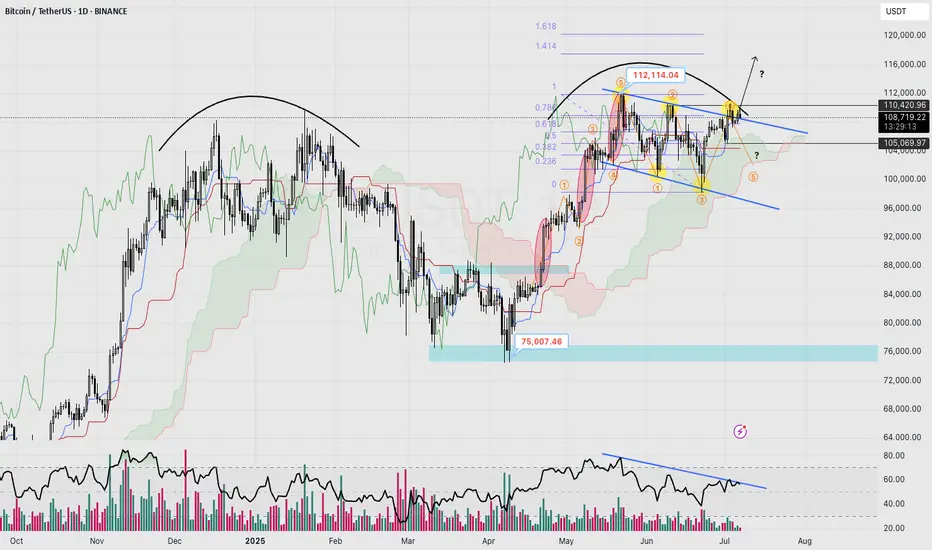
BTC Daily Chart Analysis
Trend: BTC is currently trading within a short-term descending channel.
Strong Resistance: Zone around $110k–112k, multiple failed retests observed.
Key Support: Around $105k (Ichimoku Cloud upper edge & recent local bottom).
RSI: Clear bearish divergence indicating weakening bullish momentum.
Elliott Wave: Completed 5-wave impulse from $75k up to $112k, now correcting (likely waves 4-5 within the descending channel).
Fibonacci: Breakout above $110k targets approximately $117k (1.414 Fib extension). Failure to break may lead price back down toward $102k.
Probability:
Bullish scenario (35%): Clear breakout above $112k, targeting $117k.
Bearish scenario (65%): Rejection at $112k, potential retest toward $105k → $102k.
⚠️ Recommendation: Closely watch the $110k zone. If BTC fails to clearly breakout, consider defensive actions (reducing position size, risk management).
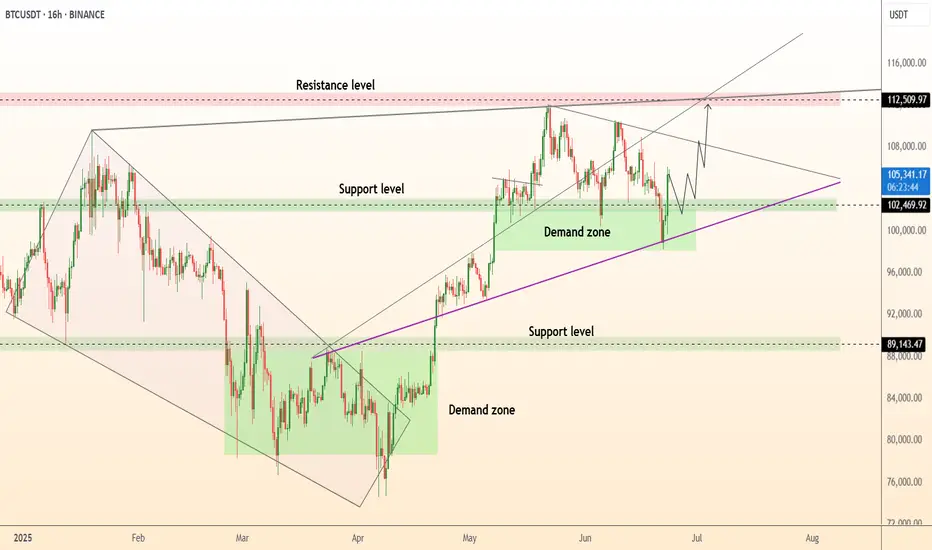
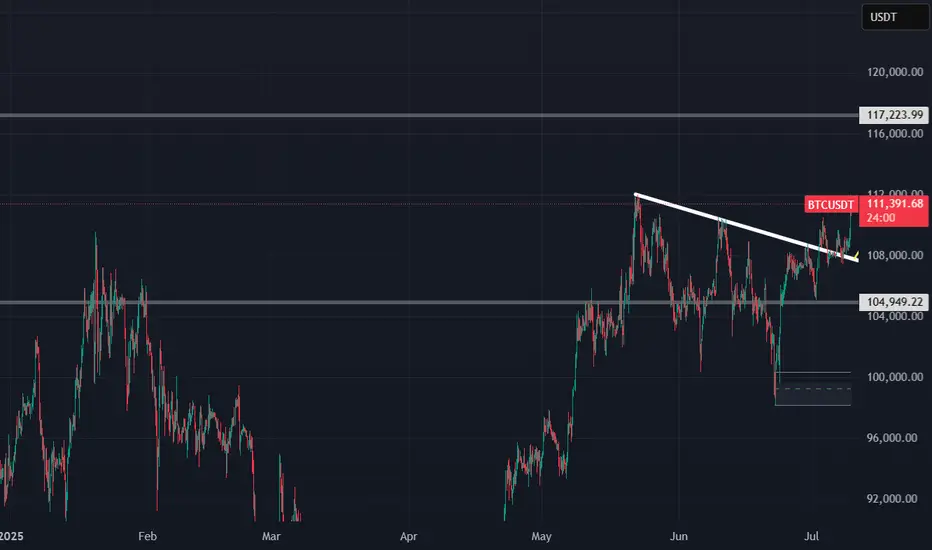
BTCUSDT – Calm Before the BreakoutBitcoin is holding firmly above the ascending trendline, consolidating within the accumulation range of $98,000 to $117,000. The current structure suggests that buyers remain in control, especially after a strong rebound from the $98,450 support zone.
In terms of news, BTC has been slightly affected by market concerns over new U.S. tariffs. However, on-chain data still shows strong accumulation around the $108,000 level. If this base holds, BTCUSDT could break out toward the $117,424 target in the near term. Conversely, if the trendline fails, the $98,000 level will be the final stronghold for the bulls.
BTC Flag Pattern's Target @ 145,XXX $ [10/07/2025]🚀 BTC Breakout from Flag Pattern: Aiming for $145,000!
Bitcoin has just broken out of a textbook Flag Pattern, a bullish continuation signal that suggests the rally is far from over. Traders jumped in as price pierced through resistance with rising volume—classic breakout behavior. Stop-loss placed below the flag, profit target measured from the flagpole... all signs point to upward momentum.
🎯 Target? $145,000.
🔥 The rocket has launched, and it's not looking back. Fasten your seatbelt and cheer it on—let’s go, BTC! Make that flag fly high and beyond! 🤑🚀

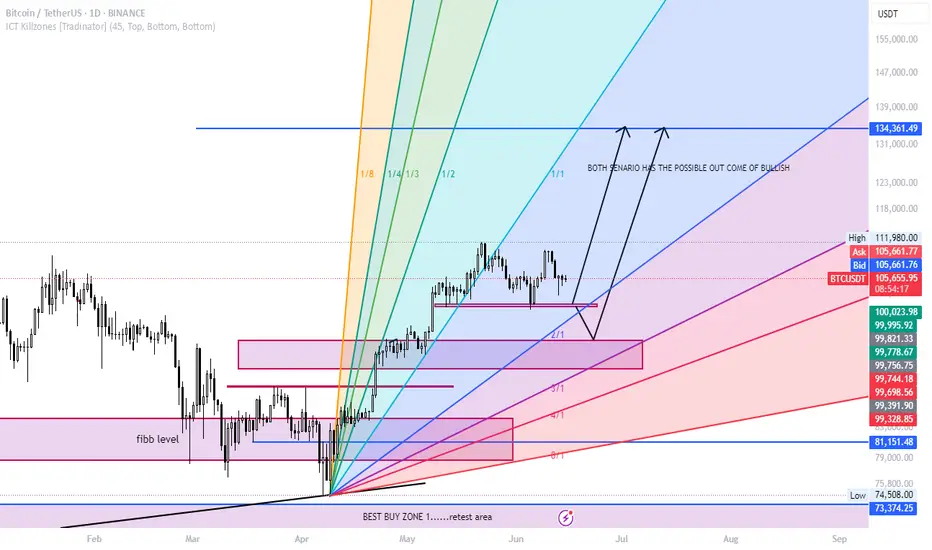
$BTC - Much Higher or Much Lower. EoY '26I'm not gonna lie, I drew these lines with my balls. I use them to move my cursor on my computer monitor.
This is not financial advice. This is just how my deep gut instinct likes to draw brushstrokes.
I gave 4 optional trajectories.
These will likely not happen, nor is it likely that the Price Action and Valuation will stay within these lines.
Enjoy and Happy Trading!
Mr. Storm

BTC is sitting on a volcanoStrong resistance at 110k and things couldn't get hotter for BTC esp. with the President pumping it and profiting from all of this (ethics 101). Let's recap: yields going up, economy is cooling (S&P going up for a week is not a reflection of things getting better), high interest rates, ultra high historical multiples, tariffs and higher debt, which are inflationary are all in front of us. This is not sustainable, a correction will happen very soon and people could get wiped out.
Always do your own due diligence and best of luck! Profit takers and crypto bros will start selling real soon, just like every other time before.

Bitcoin scalp long back to $112,000 ATHTook a risky scalp long on bitcoin just now.
Aiming for $112000-$112720
1.44-2.78RR
Stop: $110670

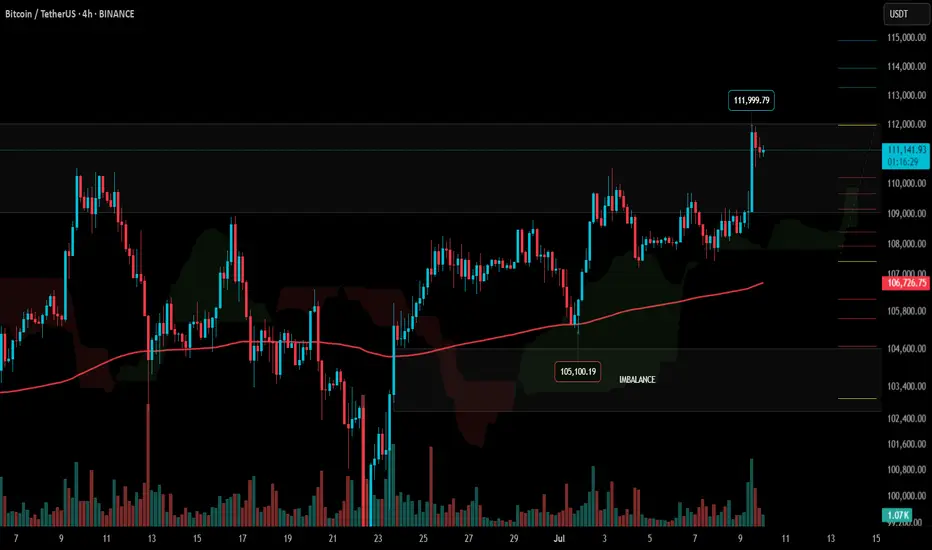
BTC/USDT Technical Analysis, 2025-07-07 11:30 UTC📊 BTC/USDT Technical Analysis, 2025-07-07 11:30 UTC
🕒 Binance Spot
📆 July 7, 2025 | 11:30 GMT Candle Observations
───────────────
💡 Price: 108712.97 USDT
📉 EMA200 (Dynamic): 108938.31
🟩 Support Watch: 107512.97
🟦 Resistance Target: 109782.97
───────────────
🔍 We're observing price action developing below EMA200, with a recent Piercing Line formation at a noted dip zone. This setup may suggest buyers are attempting to reclaim short-term control.
⚠️ Key tactical support remains near 107512.97, where historical reaction zones and liquidity zones intersect.
📈 A move toward 109782.97 is being monitored as a potential resistance test, in line with local OBV divergence and recovering bid pressure.
📌 Market Microstructure Notes:
• Order Book Imbalance leaning toward bids (+0.45)
• OBV Trend: +10.17% vs 5-period MA
• Thunder Engine Volume Acceleration: ⚡ Observed
• Whale Ask Cluster: ~640k USDT near top of range
📉 No guarantees of breakout or reversal watching how price reacts around key levels. Maintain cautious positioning near support/resistance pivots.

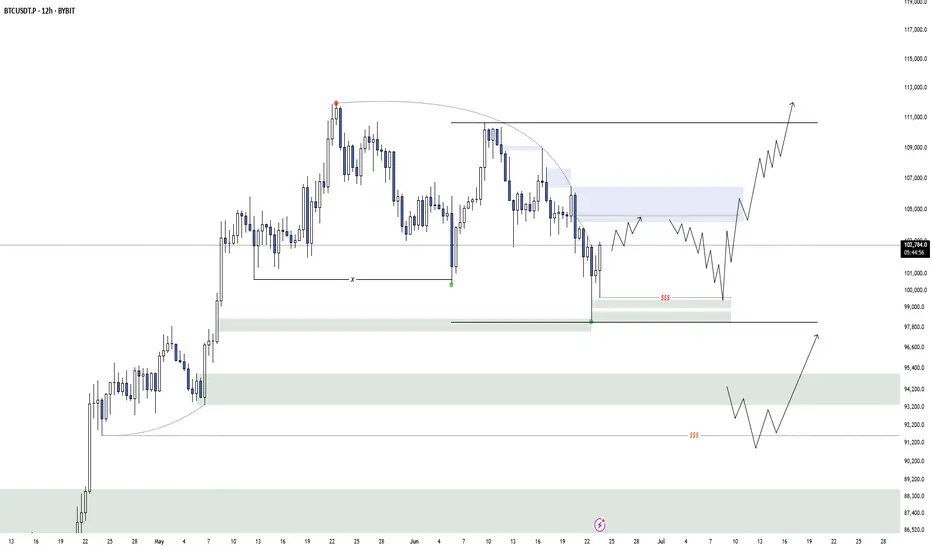
BTC MTF AccumulationThis is the current accumulation model i am watching to bring BTC back to ATH's and form the second deviation of the HTF distribution model. I would prefer if we could go lower and form a range from there, but at the moment thats all i got.
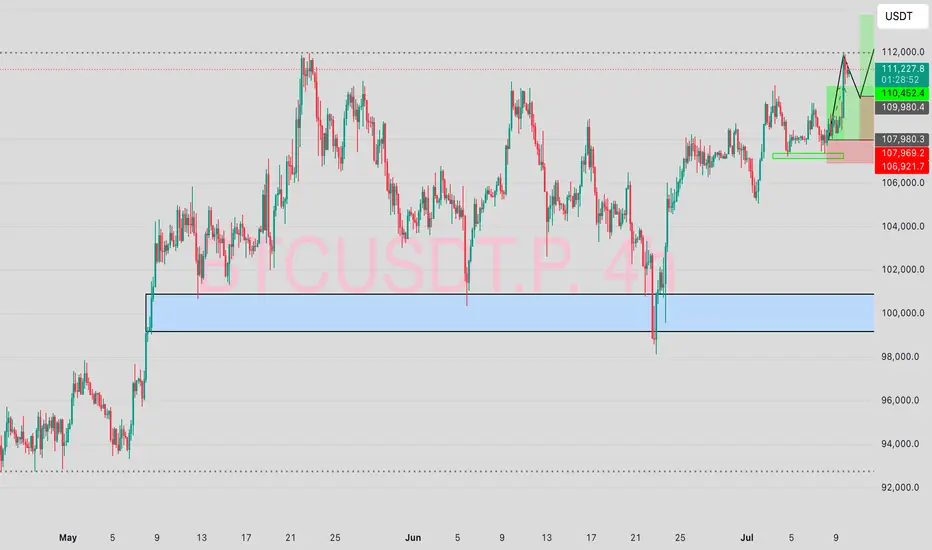
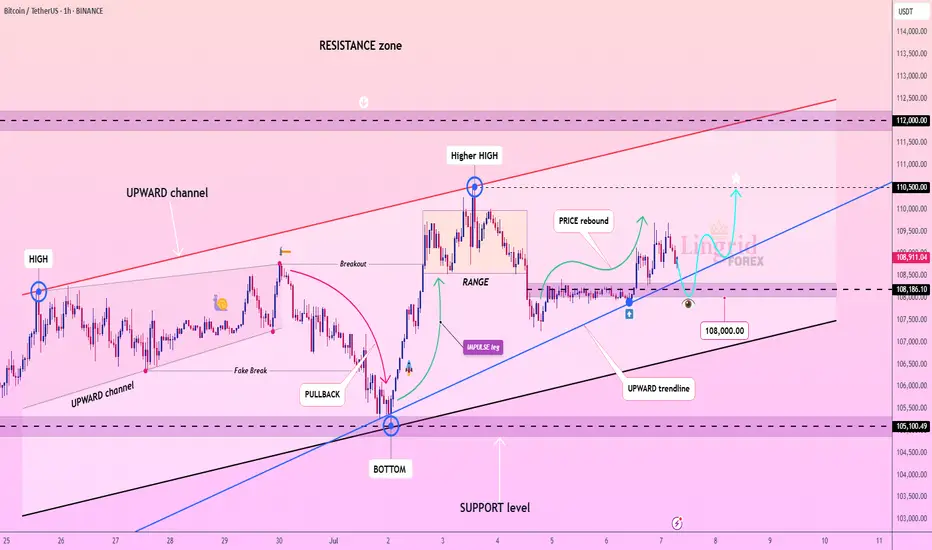
Lingrid | BTCUSDT Short-Term Bullish Momentum The price perfectly fulfilled my last idea . BINANCE:BTCUSDT continues to trade within a strong upward channel, supported by consecutive higher highs and an ascending trendline. After breaking above the range near $108,200, price briefly peaked above $110,000 before pulling back to retest the mid-support zone. Current action shows a rebound from the upward trendline, suggesting buyers are preparing for another leg up toward $110,500 and possibly the $112,000 resistance zone.
📈 Key Levels
Buy zone: around 108,000 or below
Sell trigger: break below 107,000 with close under channel
Target: 110,500 – midpoint resistance, followed by 112,000
Buy trigger: bounce from trendline and reclaim of 109,000
💡 Risks
Weak rebound could signal range re-entry and stall upside
Break below the trendline may shift bias to 105,000
Multiple rejections near 110,000 could indicate topping pressure
If this idea resonates with you or you have your own opinion, traders, hit the comments. I’m excited to read your thoughts!
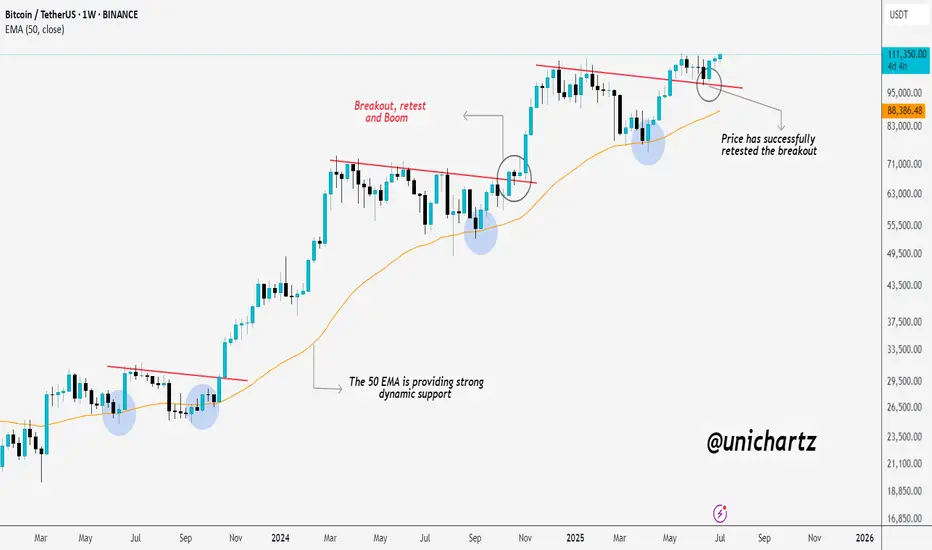
50 EMA Magic: Bitcoin Explodes After Perfect Retest!CRYPTOCAP:BTC just made a new All-Time High (ATH) — exactly as mentioned!
It broke out, retested perfectly, and blasted off.
The 50 EMA is acting like a rocket launchpad, giving price solid support every time.