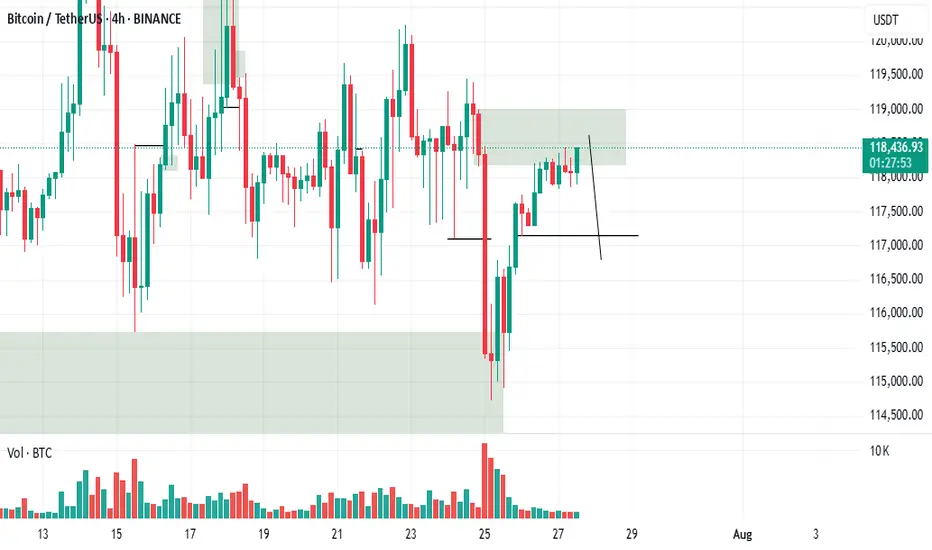
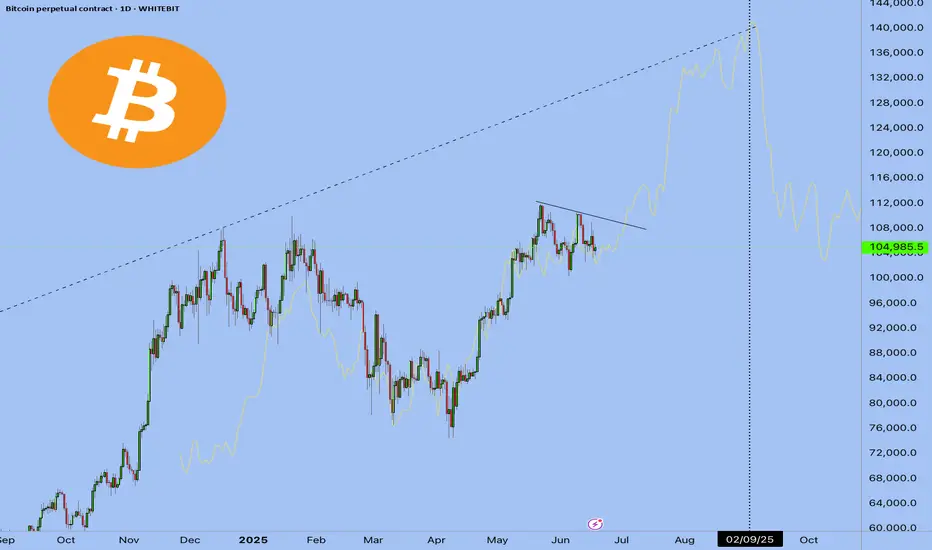
BTCUSD : Key levelsI added meaningful levels to my past forecast (I can't add a link to my last forecast by the way, because as it turns out I have to actively participate in other people's discussions, which I am unlikely to do. And if I do, then to be able to add links to my predictions. So you have to check my prev forecast in the my profile overview).
So far, all levels are inactive except for the ~116,600 level. It's still in play.
BTCUSDT trade ideas

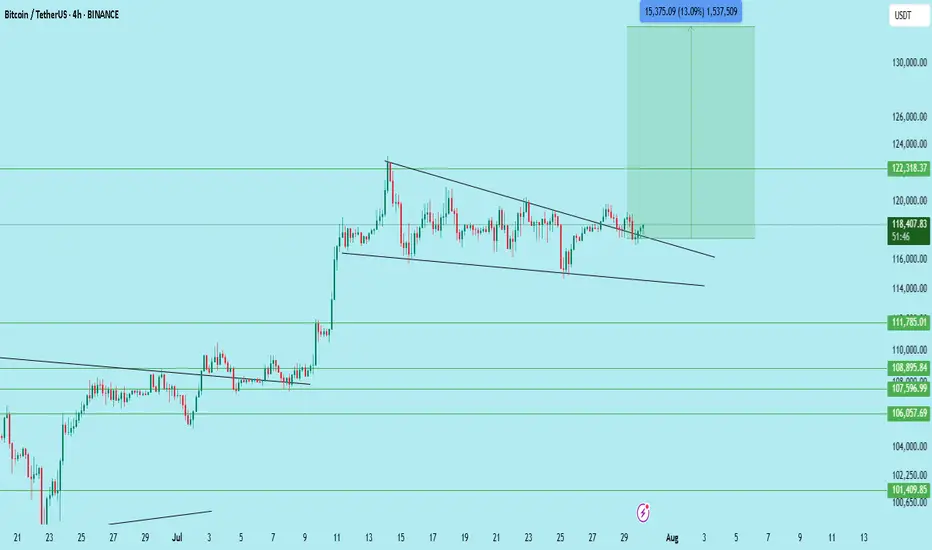
$BTC/USDT – Bull Flag Breakout on 4H | Targeting $133,700Bitcoin has just broken out of a well-defined bull flag structure on the 4H chart, signaling a potential continuation of the previous uptrend.
This breakout comes after a strong impulsive move upward, followed by a textbook flag consolidation with lower highs and lows forming a descending channel. The breakout above the flag resistance suggests a bullish continuation pattern is in play.
Technical Breakdown:
Pattern: Bull Flag (Continuation)
Flagpole base: ~106,700
Breakout zone: ~117,600
Retest Support: 116,000
Immediate Resistance: 122,300
Expected Target: 133,700 (based on flagpole projection)
Invalidation: Breakdown below 115,500
Expected Move:
Measured Move Target: ~13% upside from breakout
Confluence: Target aligns with past supply zone near 133K–135K
Price has also reclaimed the 50 EMA on the 4H chart, and the volume on the breakout shows bullish interest. Watching closely for a clean retest of the breakout zone for confirmation.
Conclusion:
BTC is showing bullish continuation after breaking out of a flag. A successful retest of 117.6K–116K range could offer further upside. Traders should manage risk accordingly.
DYOR | Not Financial Advice
Consider a sales transaction.Hello friends
You can open a sell trade on the 4-hour time frame, but this is a risky trade.
You can open a trade with half a percent risk.
On the higher time frame, the trend is still up.
Bitcoin (BTC): OrderBook is Hinting To $115K Bounce | Thoughts?Bitcoin has recently broken the $116K local neckline zone and reached the $115K area, which has been at our attention due to huge orders sitting there.
What we are thinking is that this zone will be a good bounce area, which should lower the price to $120K.
Either way, this zone is important, so keep an eye on it!
Swallow Academy

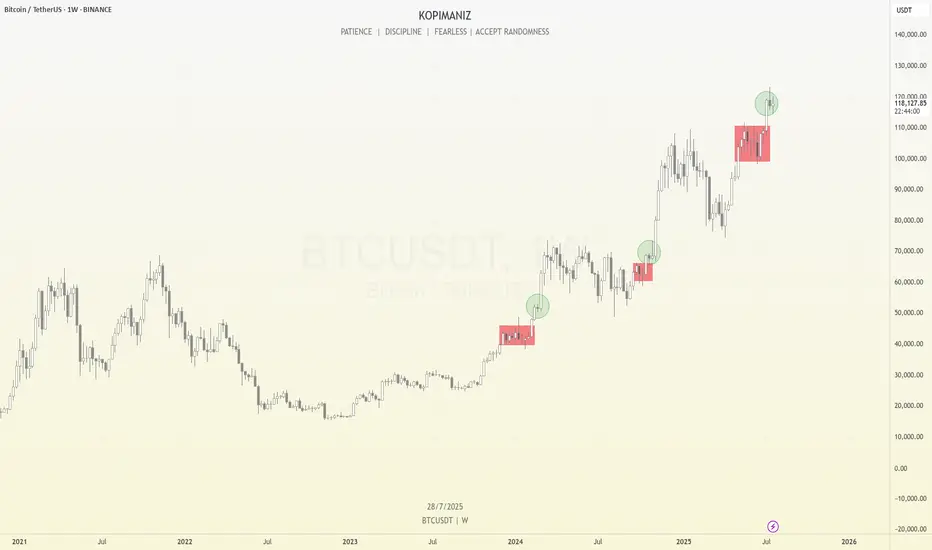
BTC - Prediction for the Final TOP AND the next BOTTOMAfter several analyses that I published on Trading View, I want to share my opinion on the Final Top and the next Bottom for Bitcoin!
The final Top will be between 160,000 and 174,000.
The next Bottom will be between 31,000 and 40,000. (Simply under 40,000).
This is not guaranteed, and it's just an analysis; it can happen or not, so be careful.

BITCOIN IS CREATING A SECRET PATTERN! (Huge move incoming?!)Yello paradisers! I'm describing to you what's going on with Bitcoin right now. We are creating a secret pattern that is forming, and once its neckline is reclaimed, we are going to have a huge movement.
In this video, I'm sharing with you the most important support and resistances on multiple time frames. We are describing Elliott wave theory wave count, and taking a look at candlestick patterns. We are talking about confirmations necessary for bullish and bearish cases. I'm explaining to you what the professional trading signals need for long-term profitability.
Some of the points are great risk-reward ratios. I'm talking about that in the video. One of them is taking only the highest probability trade setups, and having the patience and discipline to wait for them.
I'm talking about proper strategy which is needed, and systemology in your overall trading and how important it is. Here on TradingView, I'm describing to you the overall bias I have on Bitcoin right now.
Don't be a gambler. Don't try to get rich quick. Make sure that your trading is professionally based on proper strategies and trade tactics.

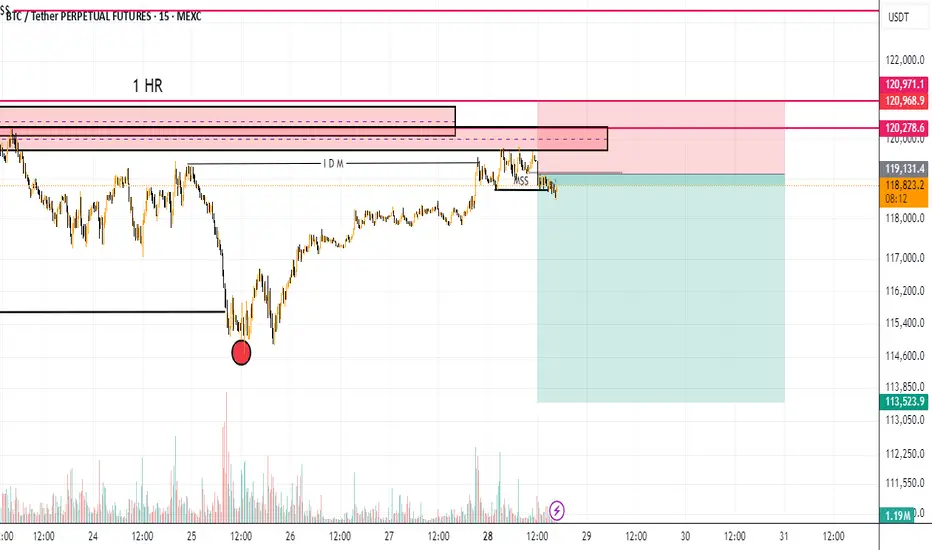
btc short tradeon 1hr timeframe btc take the inducement and on 15m done MSS and now rice going to retest the 15m advanced oder block
entry 19131
stoploss 120990
target 1; 114685
target 2 ; 113650
Deep Dive Into Bollinger Bands 🗓This article explores the Bollinger Bands indicator—a powerful volatility tool used by traders worldwide. You'll learn how it works, how to calculate it, and how to use it to detect potential breakouts, trend reversals, and overbought or oversold conditions in the market.
📚 Introduction to Bollinger Bands
In the fast-paced world of trading, understanding market volatility is key to making informed decisions. Bollinger Bands, developed by John Bollinger in the 1980s, offer a visual and statistical method to measure this volatility. Unlike simple moving averages, which only tell you the trend, Bollinger Bands expand and contract based on recent price action, helping traders spot overbought, oversold, or consolidation phases.
These bands dynamically adjust to market conditions, making them one of the most popular indicators for trend-following, mean-reversion, and breakout strategies. Whether you’re trading crypto, stocks, or forex, Bollinger Bands can help you identify high-probability setups by combining trend direction with volatility.
📚 How Bollinger Bands Are Calculated
Bollinger Bands consist of three lines:
Middle Band – This is a simple moving average (SMA) of the price, typically over 20 periods.
Upper Band – The middle band plus two standard deviations.
Lower Band – The middle band minus two standard deviations.
Middle Band = SMA(n)
Upper Band = SMA(n) + (k × σₙ)
Lower Band = SMA(n) - (k × σₙ)
Where σₙ is the standard deviation of the price for n periods and k is the multiplier, typically set to 2, which captures ~95% of price action under normal distribution. The middle band shows the average price over the last 20 candles. The upper and lower bands adjust based on how volatile the price has been — expanding in high volatility and contracting in low volatility.
🤖 For those traders who want to implement Bollinger Bands into algorithmic strategy we provide formula it's calculation in Pine Script:
basis = ta.sma(src, length) // Middle Band (SMA)
dev = mult * ta.stdev(src, length) // Standard Deviation × Multiplier
upper = basis + dev // Upper Band
lower = basis - dev // Lower Band
📚 How to Use MACD in Trading Strategies
⚡️Bollinger Band Squeeze (Volatility Contraction and Expansion)
The idea is pretty simple, а squeeze indicates low volatility and often precedes a breakout. The squeeze is the situation when the Upper Band and Lower Band contract, and BB width is at a local minimum. In this case you shall be prepared for the high volatility after the period of low volatility. This strategy doesn’t predict direction — it prepares you for volatility.
Long setup:
Price is in long-term uptrend, you can use 200 EMA as a major trend approximation - price shall be above it.
Bollinger Bands is narrow in comparison to the previous period. Price usually is in sideways.
Open long trade when candle shows a breakout and closes above the Upper Band.
Set a trailing stop-loss at the Middle Band.
Short setup:
Price is in long-term downtrend, you can use 200 EMA as a major trend approximation - price shall be below it.
Bollinger Bands is narrow in comparison to the previous period. Price usually is in sideways.
Open short trade when candle shows a breakdown and closes below the Lower Band.
Set a trailing stop-loss at the Middle Band
📈Long Trading Strategy Example
1. Price candle shall be closed above 200-period EMA. In our example we have BITMART:BTCUSDT.P 4h time frame.
2. Bollinger Bands shall be narrow in comparison with the previous periods.
3. Open long trade when candle closes above the Upper Band.
4. Close trade when price touched the Middle Band.
📉Short trading strategy example
1. Price candle shall be closed below 200-period EMA. In our example we have BITMART:BTCUSDT.P 4h time frame.
2. Bollinger Bands shall be narrow in comparison with the previous periods.
3. Open short trade when candle closes below the Lower Band.
4. Close trade when price touched the Middle Band.
⚡️Mean Reversion (Rebound from the Bands)
This is the most common approach to use Bollinger Bands. The idea is also very simple, we just want to open long if price touches Lower Band and short if price reaches Upper Band. Price tends to revert to the mean (Middle Band), especially in range-bound markets. It's very important to trade in the direction of the major trend to reduce the probability of the large move against you.
Long setup:
Price is in long-term uptrend, you can use 200 EMA as a major trend approximation - price shall be above it.
Open long trade when price touches the Lower Band.
Set the initial stop-loss at the fixed percentage below entry price. Choose this percentage number with your personal risk/money management, you shall be comfortable to lose this amount of money in case of stop-loss hit.
If price reached Middle Band set stop-loss at breakeven.
Close trade when price reached the Upper Band.
Short setup:
Price is in long-term downtrend, you can use 200 EMA as a major trend approximation - price shall be below it.
Open short trade when price touches the Upper Band.
Set the initial stop-loss at the fixed percentage above entry price. Choose this percentage number with your personal risk/money management, you shall be comfortable to lose this amount of money in case of stop-loss hit.
If price reached Middle Band set stop-loss at breakeven.
Close trade when price reached the Lower Band.
🧪 Important: the most common approach to close trades is the Middle Band touch, this is classic mean reversion. We experimented multiple times with different approached and revealed that usually it's better to take profit at the Upper/Lower band for long/short trades and use Middle Band only for setting stop-loss at breakeven. This approach provides better risk to reward ratio.
📈Long Trading Strategy Example
1. Price candle shall be closed above 200-period EMA. In our example we have BITMART:BTCUSDT.P 4h time frame.
2. Open long trade the Lower Band.
3. Put Initial stop-loss 2% below the entry price.
4. When price reached Middle band place stop-loss at the breakeven.
5. Close long trade at the Upper Band.
📉Short trading strategy example
1. Price candle shall be closed below 200-period EMA. In our example we have BITMART:BTCUSDT.P 4h time frame.
2. Open short trade the Upper Band.
3. Put Initial stop-loss 2% above the entry price.
4. When price reached Middle band place stop-loss at the breakeven.
5. Close short trade at the Lower Band.
🧪 Important tip: notice that initial stop-loss is needed only to avoid disaster in case of price moves strongly against you. This percentage shall give enough space to avoid its reaching too often. Mean reversion strategy provides fast trades with the small average gain, so you shall maintain the high win rate (perfectly above 70%). You have to choose stop-loss based on particular asset volatility.
⚡️Combined Approach: Mean Reversion + Trend Following
Skyrexio made multiple researches about Bollinger Bands strategies and we found that we can receive better gains in combination of different approaches. Mean reversion gives you great entry with discount but you don't need to exit that early. Use the trading stop and allow to gain profit while market is moving in your direction.
This approach you can find in our advanced strategy Bollinger Bands Enhanced Strategy which we shared in 2024. Click on the link to read about it and understand how you can combine best features of this popular indicator.
📚 Conclusion
Bollinger Bands are more than just a volatility indicator — they provide a flexible framework for understanding price dynamics and market conditions. By visualizing the relationship between price and standard deviation around a moving average, traders can gain valuable insights into whether an asset is consolidating, trending, or preparing for a breakout.
The real strength of Bollinger Bands lies in their versatility. They can adapt to different trading styles — whether you’re a short-term scalper, a swing trader, or a long-term position holder. From identifying squeeze setups to riding strong trends or capturing mean reversion moves, BBs offer a strategic edge when used correctly.
However, Bollinger Bands should never be used in isolation. Like any technical tool, they work best when combined with momentum indicators like RSI or MACD, volume analysis, and price action signals. Context is key: a signal that works well in a ranging market may fail during high momentum trends.
Ultimately, Bollinger Bands help traders make more informed, disciplined decisions by clarifying where price stands relative to recent history. When paired with sound risk management and broader market awareness, they become a powerful ally in navigating market uncertainty.

It's an Evacuation Through Green Candles💥 "One Last Leap of Faith?" - What Bitcoin Might Be Hiding Before September
The world’s on fire: Israel, Iran, Strait of Hormuz, oil, elections, the dollar, rates, black swan whispers.
And someone’s out here saying Bitcoin might still go up?
Yes. We are. Not because we believe - but because we see.
📉 Everyone’s afraid. The whales aren’t.
When the crowd goes into survival mode, the real game begins.
Whales aren’t exiting - they’re accumulating.
ETFs aren’t pausing - they’re inflowing.
The technical setup isn’t breaking - it’s compressing like a spring.
$104,000. Coil building.
If we break out - targets at $132K–$140K are absolutely in play.
👉 But that’s not the point.
The point is why this is happening while the world is burning.
🧠 The idea: Bitcoin isn’t a safe haven. It’s a distribution machine.
Gold is for panic.
Bitcoin is for structure.
Institutions don’t ask “is it scary?” - they ask “where’s liquidity?”
Everything is aligning for one last upside move.
Until September. After that - chaos is back on the table.
💣 The Global Playbook:
Now (Summer) - Consolidation, ETF flows, geopolitical fear - Strategic entries, low exposure
Breakout - FOMO panic, retail rushes in - Profit-taking via options
September–Fall - Macro/geopolitical shock - Already in cash or hedged
📌 Bottom Line
Yes, Bitcoin might pump. Not because the world is fine - but because someone needs to exit beautifully.
If you're reading this - you're early enough to think.
Markets don’t reward justice. They reward positioning.
🛠 What to do right now:
Watch the $104,000 level - it's the pivot
Breakout = final upside push to $132K–140K
Keep your eyes on September - reversal zone
Think in scenarios: entry, exit, protection
Follow EXCAVO - we don’t guess, we read the game
I've been talking about this scenario for a long time
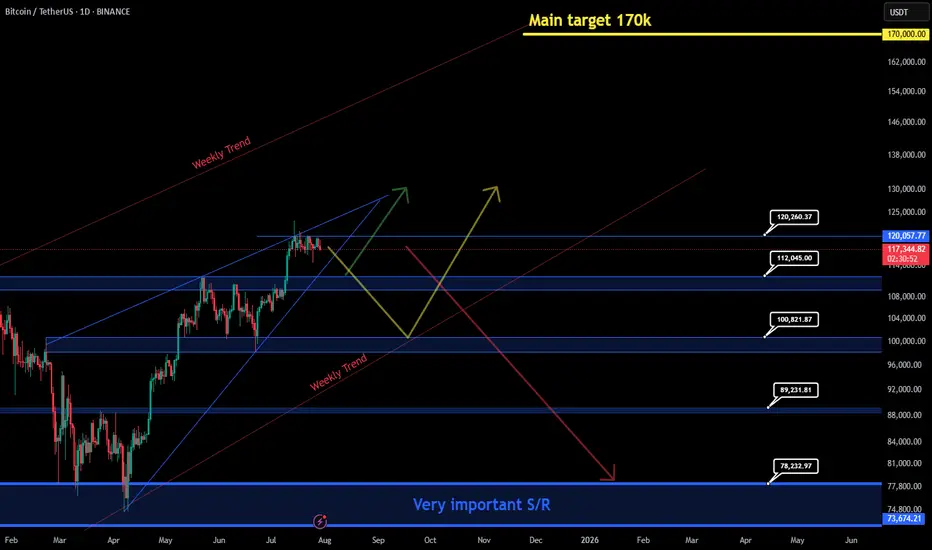
BITCOIN FALL TO 78K ! OR GOING TO 170K ?📊 Bitcoin Possible Scenarios (BTC/USDT Analysis)
🟢 Green Scenario (Immediate Bullish Breakout):
If the price breaks above the $120,000 resistance without any significant pullback, this would signal strong bullish continuation. It suggests buyer dominance and could lead to a fast move toward higher levels.
🟡 Yellow Scenario (Bullish Correction):
If BTC fails to break $120,000, we may see a drop toward $112,000. If this level breaks, price could head down to $100,000 to collect liquidity and attract buyers. From there, a strong rebound is likely, restoring bullish momentum (with weekly trendline support)
🔴 Red Scenario (Bearish Reversal):
If price breaks clearly below $100,000, especially with a violation of the weekly trendline, this could trigger a deeper correction toward the $78,000 – $74,000 zone. This scenario would mark a potential shift in long-term market structure.
Main Target : 170,000
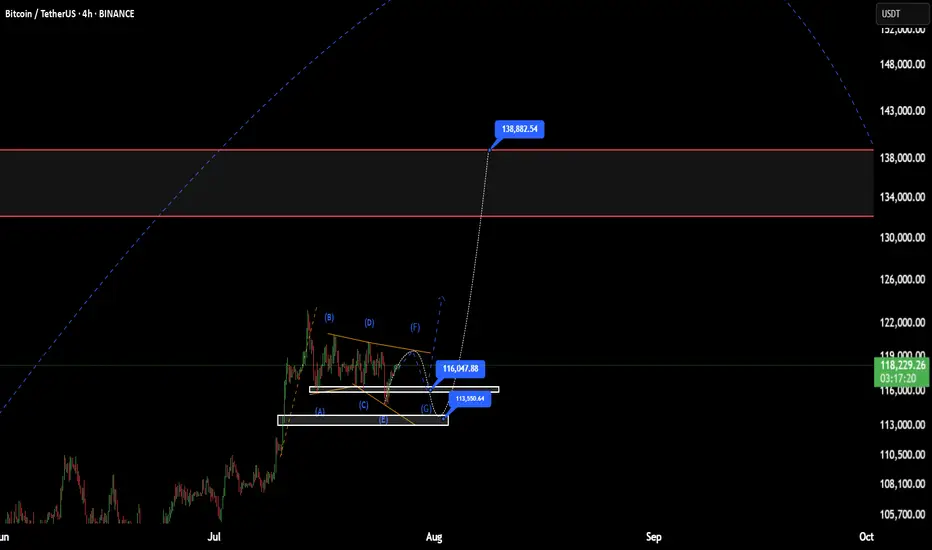
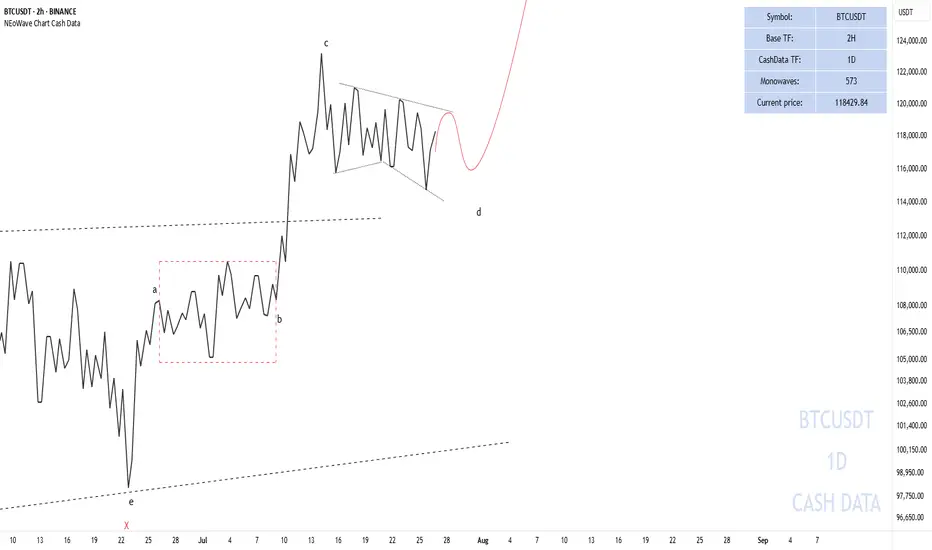
BTC(based on NEo wave)This range price is shown as a bow-tie diametrical.
I think G wave will end at one of those prices, 113 or 116
after this it will start a good bullish wave.
stop loss is 110K and the first target is 138K.
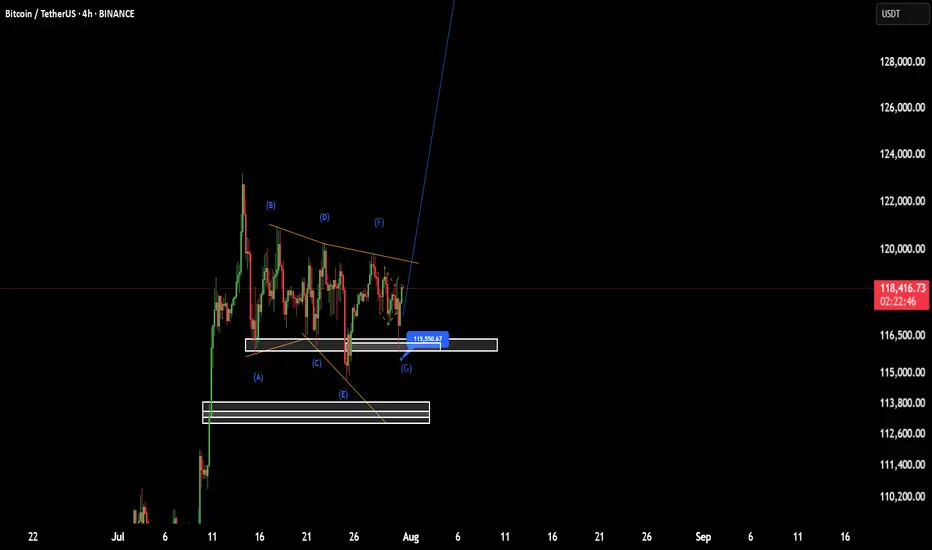
BTC(based on NEo wave)I think wave G is finished and soon it will pump to 138K.
stop loss is 115500.
attention:138K is the first target of these bullish waves.
Bitcoin (BTCUSDT) - Possible Completion of a Complex CorrectionTimeframe: 4H + 1H
Methodology: NeoWave (Glen Neely) + Smart Money Concepts (ICT/SMC)
Posted by: @CryptoPilot
⸻
🧠 NeoWave Analysis: Complex Correction Ending?
From a NeoWave perspective, BTC seems to be in the final stages of a Complex Correction that started in March 2025 from ~72k. The upward move appears to form a Contracting Diametric structure (7 legs: A–B–C–D–E–F–G), with the current leg G potentially unfolding now.
• ✅ Wave A: Sharp recovery from March lows
• ✅ Waves B–F: Alternating corrective legs with varied time and complexity
• 🔄 Wave G: Could be starting now, expected to break structure to the downside
This suggests that the entire move from March till now may represent a large Wave B, setting the stage for a deeper Wave C down.
⸻
🔍 Price Action + Smart Money Confluence
The following observations strengthen the NeoWave scenario:
• 🟨 Liquidity Pools above 120k were swept recently, creating a potential Buy-side Liquidity Grab
• 🟥 Imbalance/FVGs below 114.5k remain unfilled
• 🔻 Market Structure Shift (MSS) evident on 1H chart — lower highs forming
• 🧠 Price rejected from a key Supply Zone, aligning with end of Wave F
• 🟩 If price re-tests the internal bearish OB (near 119.5k–120k), it may provide an ideal short trigger
⸻
📌 Key Levels to Watch:
Level
Description
120.2k
Liquidity sweep zone / MSS confirmed
118k
Current structure base (pivot)
114.5k
FVG + potential Wave G target
111–112k
Strong demand zone (accumulation support)
🧭 Scenario Outlook:
Primary:
→ Price is in Wave G of a Diametric (NeoWave)
→ Likely to unfold as a 3-leg Zigzag down or a Complex combination
→ Objective: break below Wave E low and target the unmitigated imbalances
Alternative:
→ Extended Flat or Triangle, if 120.5k is broken impulsively
→ Invalidation = clean break and hold above 121k
⸻
⚠️ Risk Note:
This analysis assumes Wave G is beginning. If bulls manage to reclaim 120.5k with momentum and close above, the bearish structure will be invalidated.
⸻
💬 Final Thought:
We are potentially nearing the end of a complex corrective rally. The confluence of NeoWave structural symmetry, Smart Money traps, and market inefficiencies suggests that BTC may be preparing for a retracement. Stay alert for confirmations before executing.
⸻
📌 Follow @CryptoPilot for advanced wave structure updates, market geometry insights, and ICT-style smart money traps.
💬 Share your views or alternate wave counts in the comments!

Bitcoin’s Battle at Resistance Watch These Critical Levels.Bitcoin is currently forming an AMD (Accumulation–Manipulation–Distribution) pattern.
The market recently dipped due to manipulation, only to push back up and break through a key resistance level, moving toward the inversion zone. However, it now faces additional resistance from a descending trendline.
If the market decisively breaks above this trendline and successfully retests it, there is potential for further upward movement.
Keep a close watch on these critical levels for confirmation.
Do Your Own Research (DYOR)

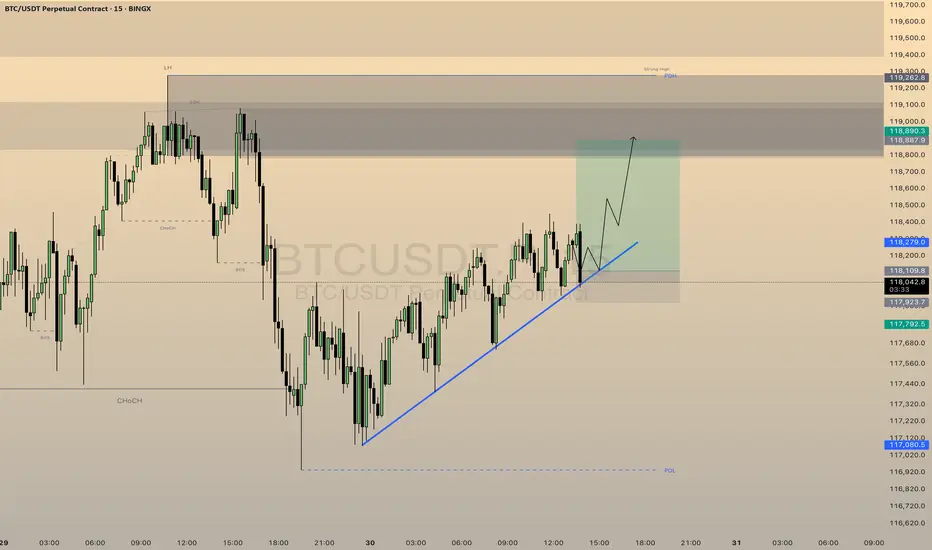
FUTURES SIGNALFUTURES SIGNAL
Coin: BTC
Direction: LONG
🟢Input range: 118109
✔️ТР: 118890
❌SL: 117923
We trade with the trend, stop at the minimums
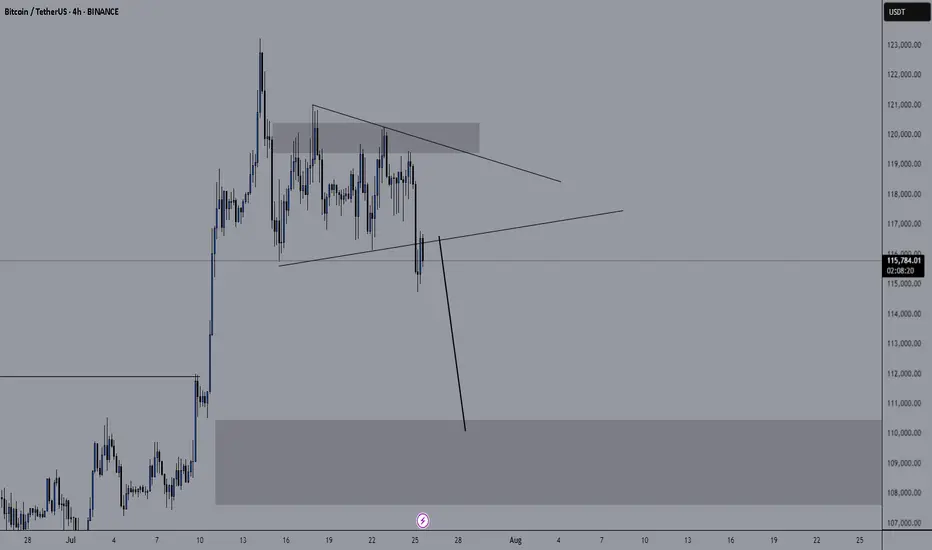
Pessimistic scenario for BITCOINAfter Bitcoin touched the price of 123,218, it entered a corrective phase. According to previous analysis, we expected the price to touch the range of $115,000-113,000. With the formation of more waves, it seems that the recent correction that started on July 14, 2025 is a diametric (bowtie) where waves f and g of this diametric are not yet complete and this pattern is part of a higher degree diametric and after this pattern is completed I expect a move towards the range of 140,000-150,000
Pessimistic scenario:
The pessimistic scenario is that this wave becomes a double pattern and enters the price range of wave-b (marked with a red dashed line) of the higher degree diametric. The probability of this scenario occurring is low and I consider the first scenario more likely, but we must be prepared for all market movements.
Good luck
NEoWave Chart
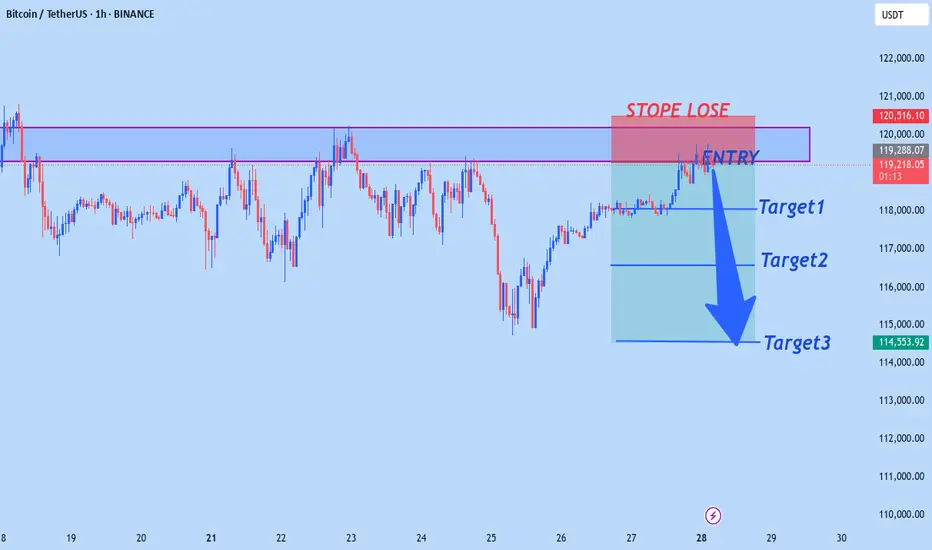
BTCUSD WILL FALLING SOONBtcusd sell from 119,200
Target1 118,000
Target2 116,500
Tagret3 114,500
StopeLose 120,500
Trade at your own risk
BTC/USDTWe are approaching the end of the Bitcoin bullish cycle, and the trend will change between $125k and $130k, and there will be a downward trend for several months.

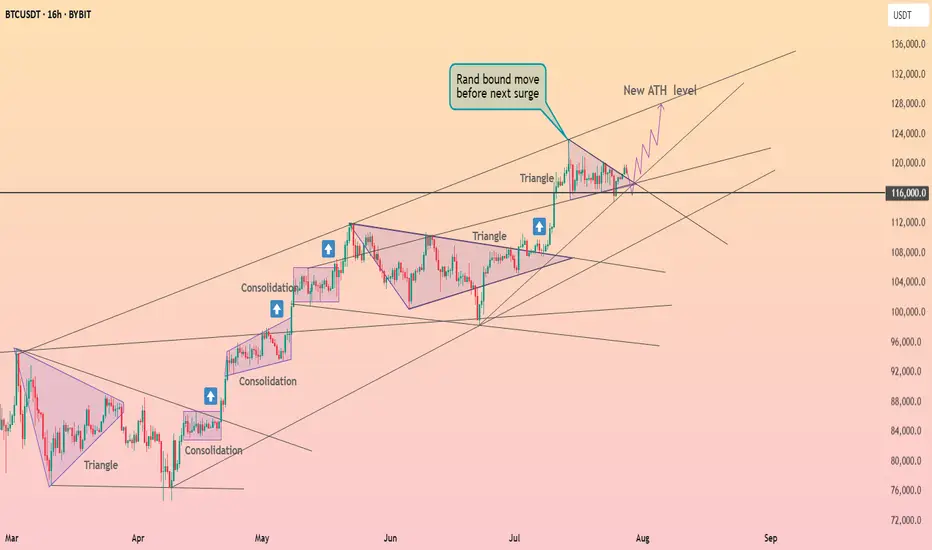
Bitcoin Weekly Structure: Repeating Rhythms and What’s Next
Bitcoin continues to follow a consistent structural rhythm on the weekly timeframe. We can observe that before every major breakout, price enters a multi-week consolidation phase, which I’ve marked using red boxes on the chart. These red box zones represent long periods of sideways movement, typically acting as reaccumulation phases. Once price breaks above these levels, it often results in a strong impulsive move, confirming that these areas serve as foundational support for trend continuation.
After each of these longer consolidations, Bitcoin tends to enter a brief 1–2 week consolidation right after the breakout, which I’ve marked with green circles. These short pauses are signs of healthy bullish momentum, often acting as flags or continuation patterns before the next leg up. What’s notable is that each of these green circle phases occurs after a clean breakout from a red box, and they consistently lead to further price appreciation.
Currently, Bitcoin has just broken out of another red box zone between ~$100k and ~$110k. Over the past two weeks, it has formed a small range near $118k, resembling the same green circle structures we’ve seen earlier in the trend. Given this recurring pattern, there’s a high probability that we are once again in the early stages of a bullish continuation. If the pattern plays out as it has in the past, the next move could be another strong weekly candle pushing toward new highs.
However, I’m paying close attention to the $125k–$126k level. This psychological zone may act as a major turning point. It could lead to either a prolonged consolidation phase that lasts for months, or potentially trigger a significant correction if the market faces strong resistance. This level marks a critical area where momentum may shift, so it deserves extra caution as we approach it.
This type of structural repetition helps me stay grounded in my analysis—focusing not just on price, but also on how long and where Bitcoin consolidates. So far, the rhythm has been clean and reliable.
Let’s see if Bitcoin respects the rhythm once again.
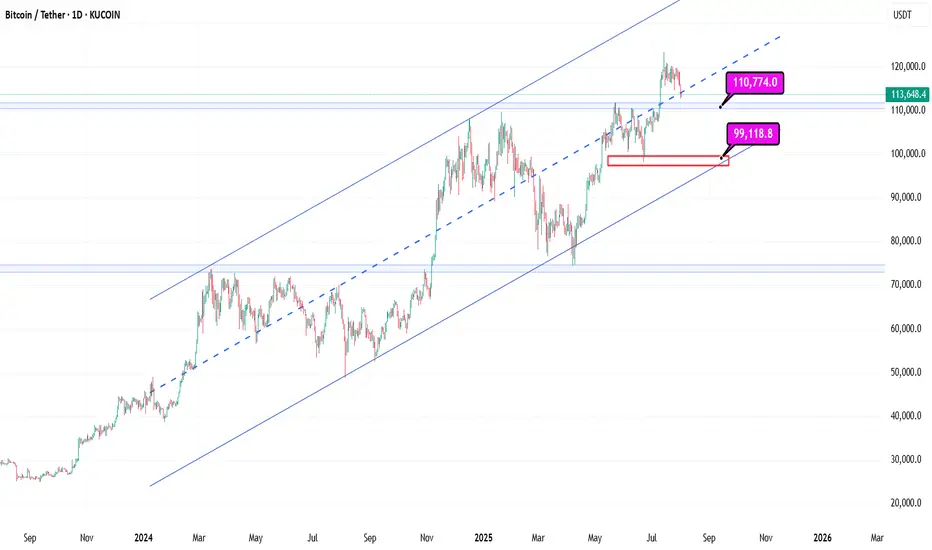
Bitcoin Support: Midline Channel Support at 114kBitcoin
1D
Bitcoin Support: Midline Channel Support at 114k and then Blue Line 110k
With these supports holding in the long term, progress is still possible
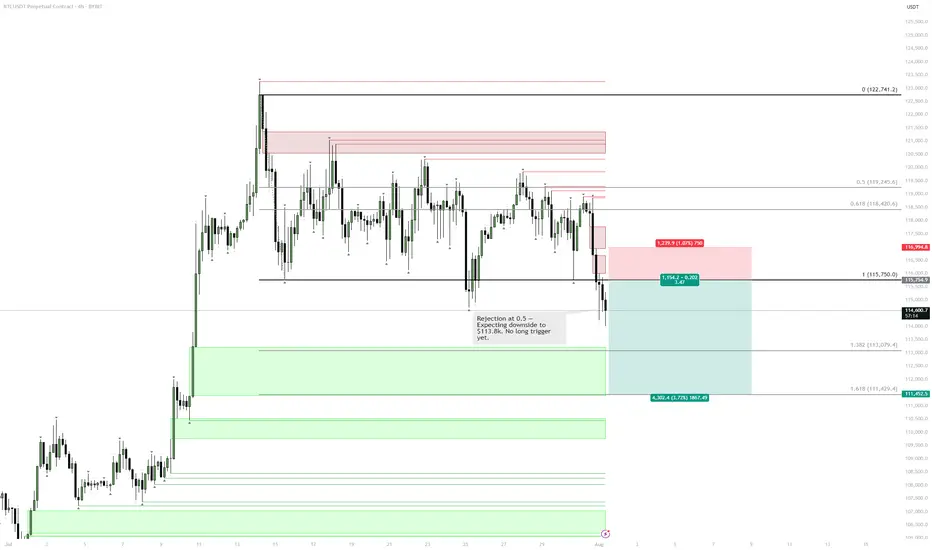
BTC | Short Bias — Targeting $113kPrice rejected perfectly off the 0.5 retracement and is now filling the previous imbalance.
Yesterday's daily close was decisively bearish, confirming downside momentum.
There’s a lack of convincing reversal signals at current levels.
Plan:
Main expectation is continued downside toward the $113k support.
Not interested in longs until price stabilizes at or below that level.
Bitcoin is testing the boundaries of the triangle ┆ HolderStatBINANCE:BTCUSDT is printing higher lows along trendline support near $67,800. The price is compressing into a wedge below $69,000 resistance. A breakout would confirm continuation toward $71,000–$72,000. Momentum remains intact unless $67.5k is broken. The market is building pressure for the next impulsive move.
Short Probably!Hello all. before all I wanna tell you that I am not a crypto trader and it is unknown market to me but if it works as Forex market, market will go down from here. be happy(wink)