BTCUSDT Last final flush forming? Last time June 22nd we observed exactly same weekend setup with 2 legs already done, last 3rd one the strongest generated 4h buy signals with BTC sinking below 100k, this time is buy signal already there so 3rd leg should be not that strong or will be skipped... but no hopium here... expect best, prepare for worst. Prepare for 112-111k teritory test over the weekend.
BTCUSDT a16z partner Alex Rampell warns that while “Operation Chokepoint 2.0” has ended, major U.S. banks are now pushing a new “Chokepoint 3.0” — using high fees, restricted data access, and app blocking to suppress crypto and fintech competition. He notes that banks like JPMorgan are trying to raise the cost of moving funds to platforms like Coinbase and Robinhood to undermine emerging rivals
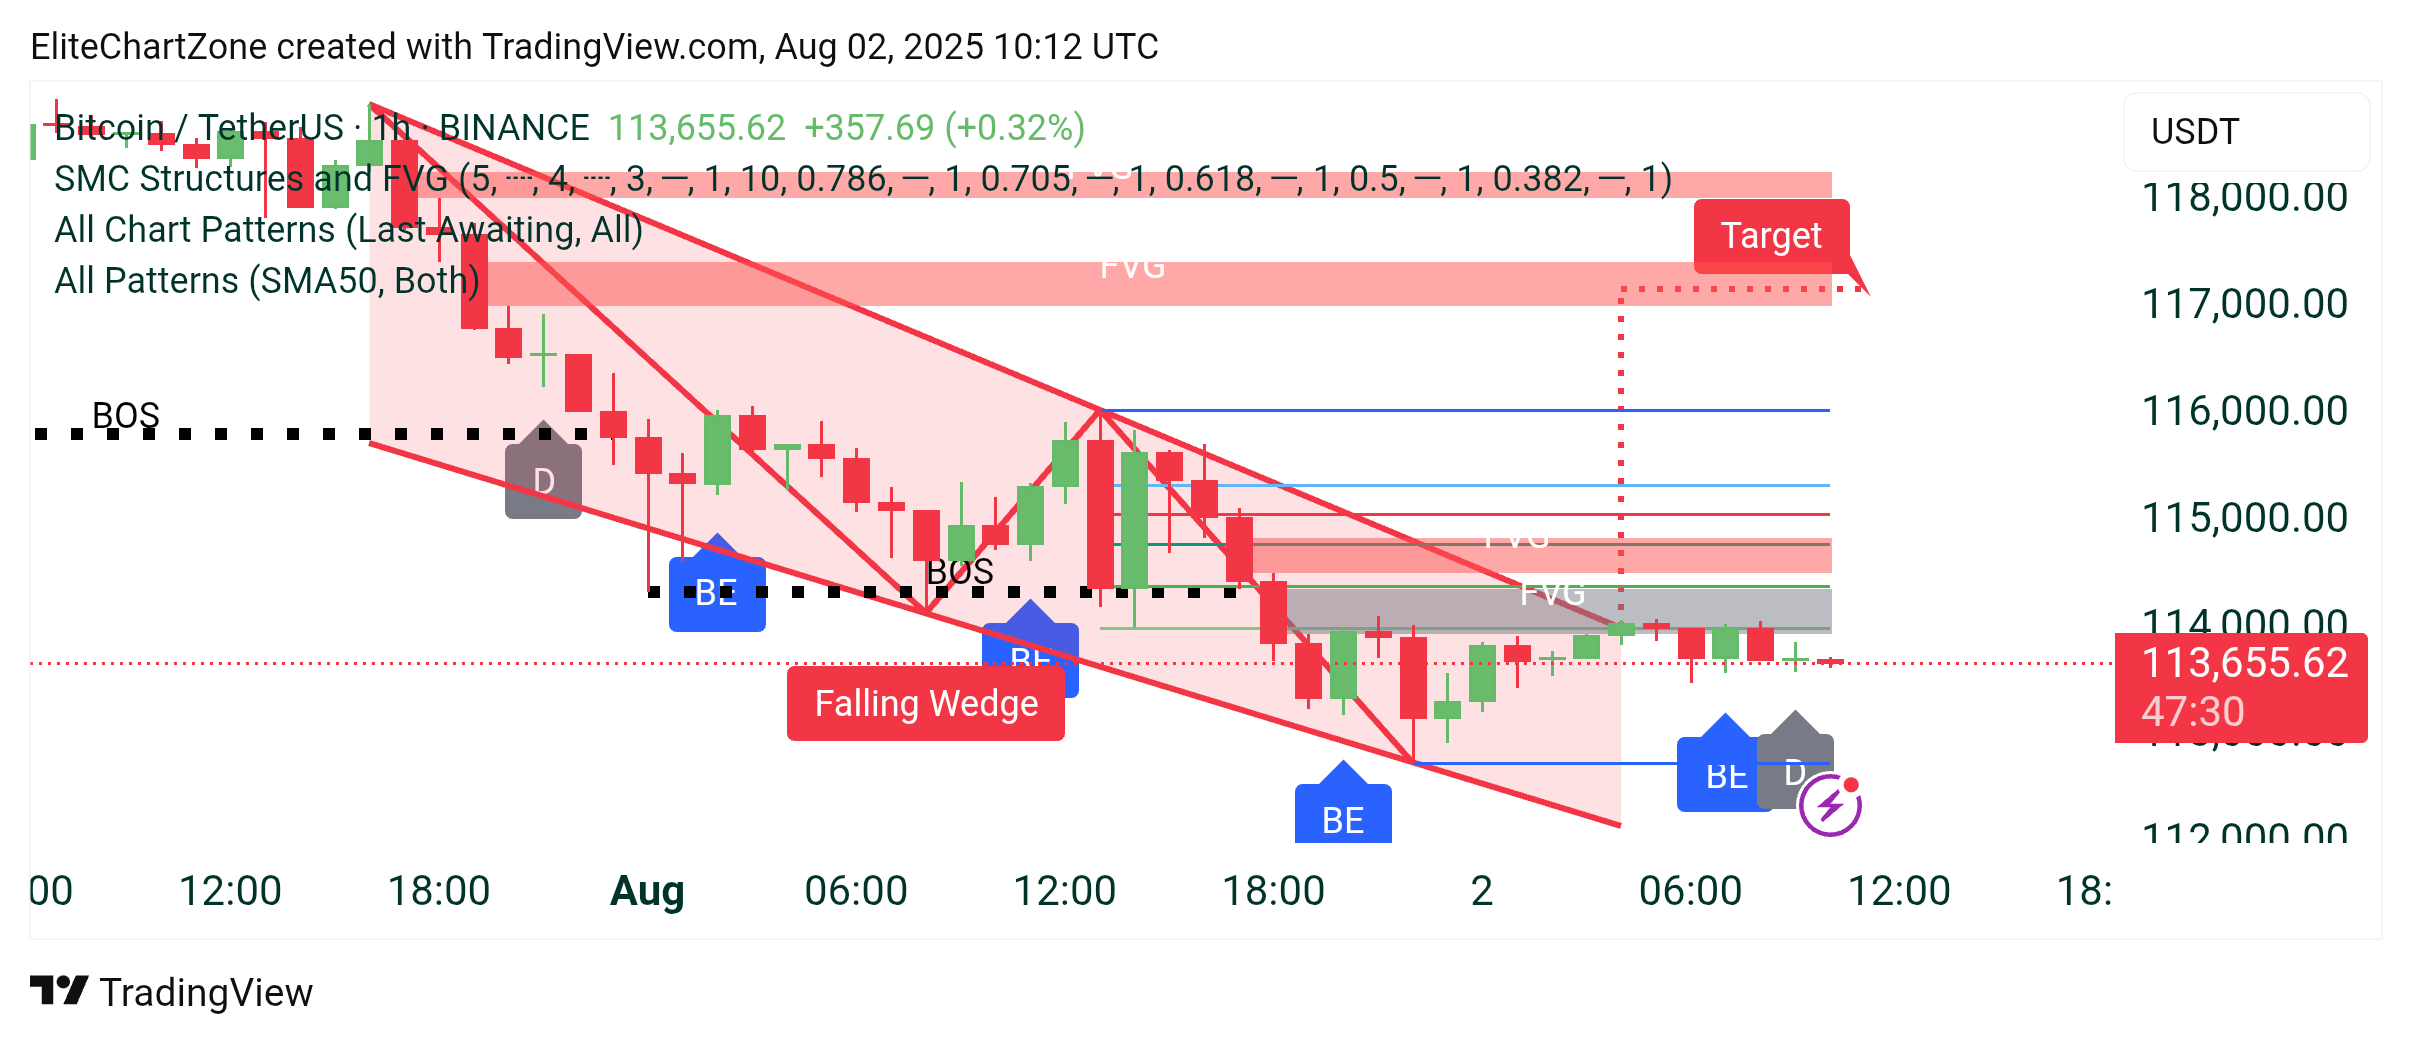
Unfortunately, Bitcoin has closed below its current channel and now appears to be retesting that level. If this retest confirms, I expect a pullback down to the $110,000 zone. However, if Bitcoin manages to re-enter the channel, its first target will be $118,800. Although it’s a descending channel, moving within it suggests a relatively stable market. Closing below it may not end well and could deepen the retracement. That's why I recommend caution with all coins right now.
Even though it seems like a distant possibility at the moment, don’t forget there’s also an imbalance zone around the $103,500 level. A sharp wick or a significant drop could bring Bitcoin back to revisit that area. The probability is currently low, but it can’t be ruled out completely. I don’t recommend rushing into any long or short positions at this stage.
BTCUSDT Bitcoin is currently holding strong above the $112,500 support zone, forming a bullish structure on the 4H chart. With a steady higher low formation and positive momentum in RSI above 50, the price action suggests continuation to the upside. The price recently bounced off a key demand zone, confirming buyer interest at lower levels.