Chart Patterns - How to read them like a ProChart patterns are visual formations on price charts that help traders anticipate potential market movements.
These patterns fall into three main categories: bullish , bearish , and indecisive .
---
1. Bullish Chart Patterns
Bullish patterns often signal that price is likely to move upward.
Related pairs

BTC - Short Setup at 0.702 Fibonacci & Fair Value GapMarket Context
Bitcoin recently rejected from a major resistance area and has since been retracing downward, finding temporary support inside a bullish Fair Value Gap. The market is currently in a corrective phase, with buyers attempting to defend lower levels while sellers look for optimal positio

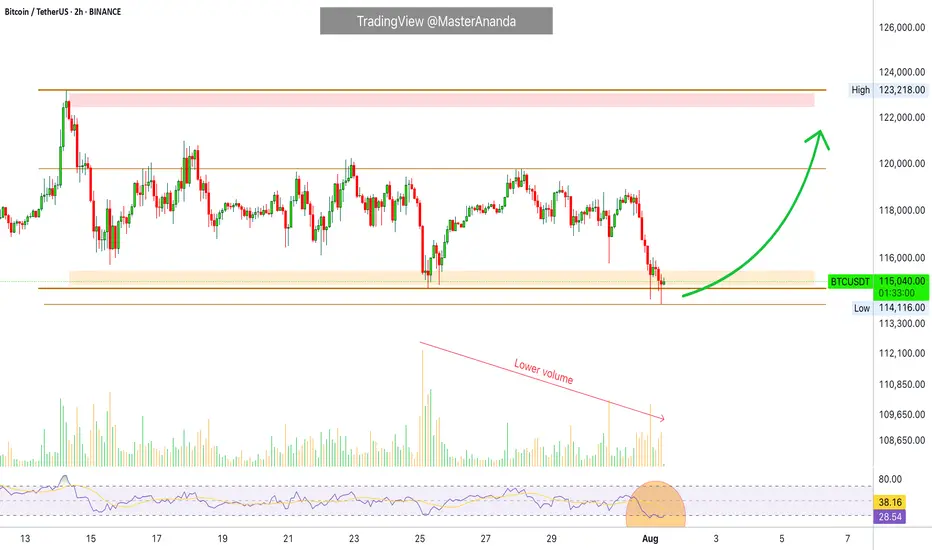
Bitcoin Hits $40,000, It Will Recover —Name Your AltcoinSorry, there is a typo there on the title, I meant to say: Bitcoin hits $114,000, soon to recover.
As you can see from our trading range, Bitcoin just went beyond the lower boundary and hit a new low, the lowest since 10-July but there is good news. There isn't room for prices to move much lower, t
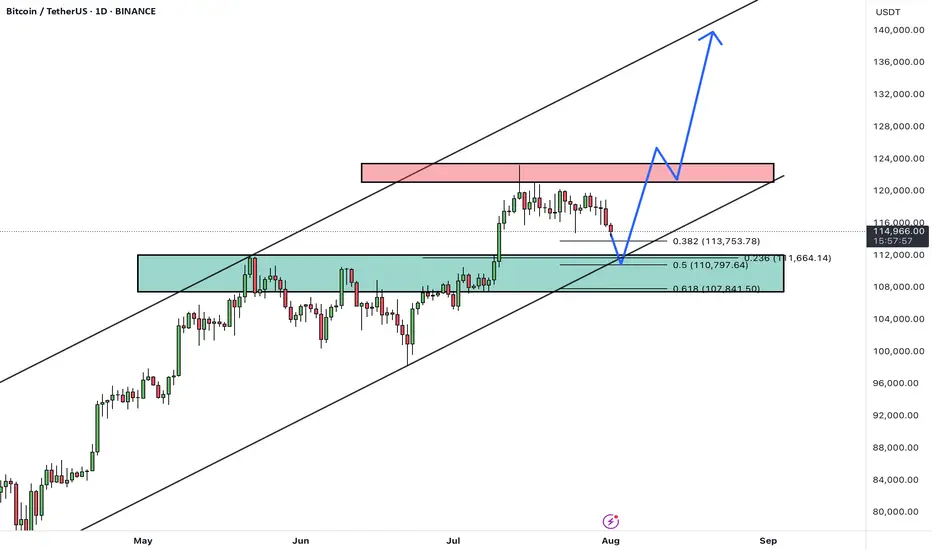
BTCUSDTHello Traders! 👋
What are your thoughts on BITCOIN?
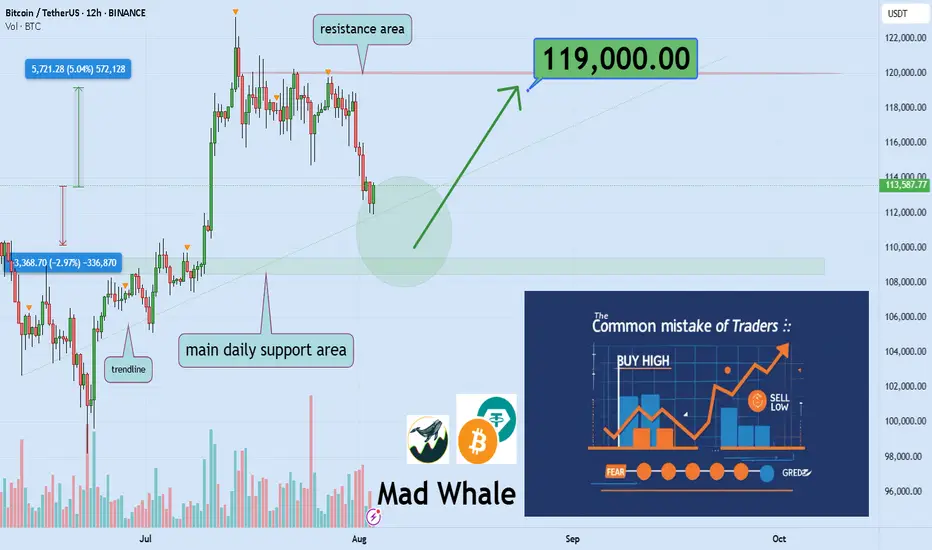
After a strong rally, BTC is currently pulling back from the 124K resistance area, heading toward a major confluence support zone between 108,000– 110,000, which aligns with:
✅ Previous breakout zone
✅ 0.5–0.618 Fibonacci retracement
✅ Lower boun
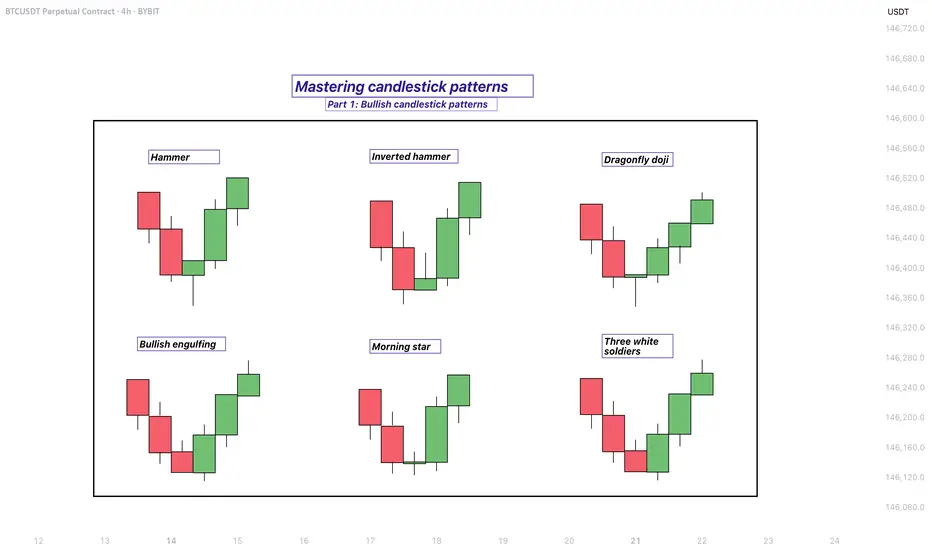
Mastering bullish candlestick patterns - How to use it!In this guide, we will explore some of the most important bullish candlestick patterns used in technical analysis. These patterns are essential tools for traders and investors who want to better understand market sentiment and identify potential reversal points where prices may start moving upward.
Bitcoin Preparing for Explosive Breakout Toward $167KBitcoin is currently respecting a clean trendline resistance following a bullish pennant formation. Price is holding firmly above the neckline breakout from the inverse head and shoulders (ISHS), confirming demand strength around the $111K–$113K region. The structure implies another 48% rally projec

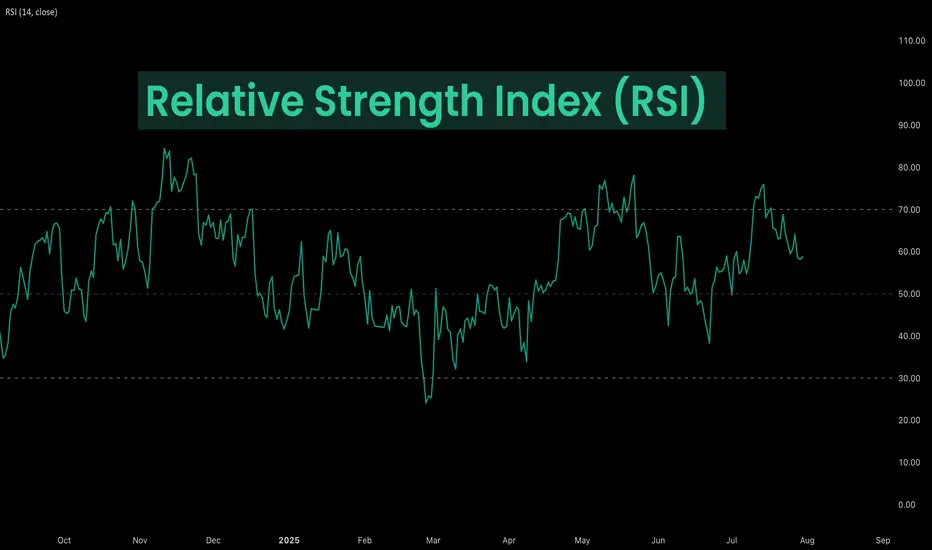
Deep Dive Into Relative Strength Index (RSI)The Relative Strength Index (RSI) is a momentum oscillator developed by J. Welles Wilder Jr. that measures the speed and magnitude of price changes.
Introduction
In the world of trading, timing is everything — and few indicators have stood the test of time like the Relative Strength Index (RSI)
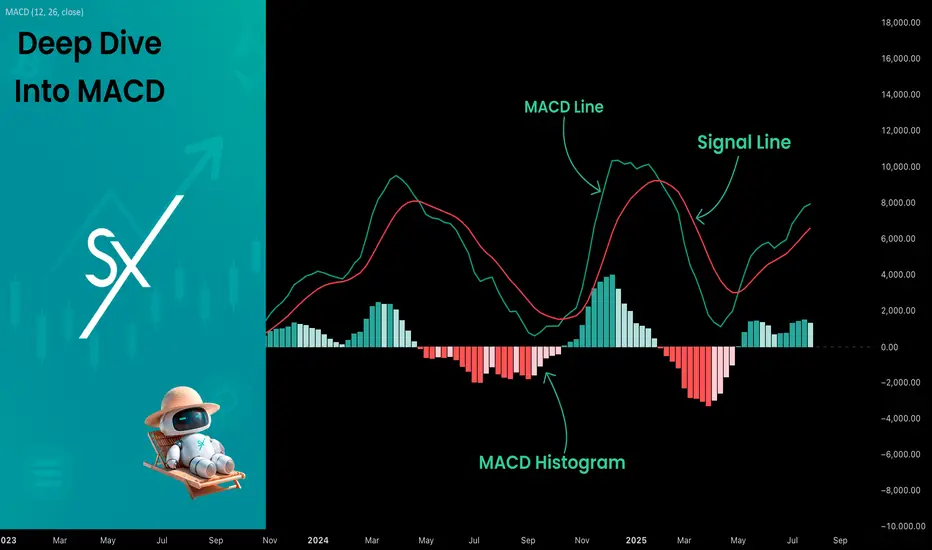
Deep Dive Into Moving Average Convergence Divergence (MACD)🗓 The Moving Average Convergence Divergence (MACD) is one of the most popular momentum indicators in technical analysis. Whether you're a beginner or an experienced trader, understanding how the MACD works can significantly enhance your trading decisions.
📚 Introduction: What Is MACD and Why It M
A lose Cycle! Sell The Bottom, Buy The Hype!? Why Do You Buy When Everyone Else Is Terrified?
What drives us to make the exact opposite of a rational decision?
Is a crashing market truly a buying opportunity or just a trap?
Hello✌️
Spend 2 minutes ⏰ reading this educational material.
🎯 Analytical Insight on Bitcoin :
BINANCE:BTCUSDT has
TradeCityPro | Bitcoin Daily Analysis #145👋 Welcome to TradeCity Pro!
Let’s get into Bitcoin analysis. Yesterday, Bitcoin was rejected from the zone I had mentioned, and today it will probably begin its new downward move.
⏳ 4-Hour Timeframe
In yesterday’s analysis, I told you that a pullback to SMA25 and the 0.5 Fibonacci zone was possible

See all ideas
Summarizing what the indicators are suggesting.
Oscillators
Neutral
SellBuy
Strong sellStrong buy
Strong sellSellNeutralBuyStrong buy
Oscillators
Neutral
SellBuy
Strong sellStrong buy
Strong sellSellNeutralBuyStrong buy
Summary
Neutral
SellBuy
Strong sellStrong buy
Strong sellSellNeutralBuyStrong buy
Summary
Neutral
SellBuy
Strong sellStrong buy
Strong sellSellNeutralBuyStrong buy
Summary
Neutral
SellBuy
Strong sellStrong buy
Strong sellSellNeutralBuyStrong buy
Moving Averages
Neutral
SellBuy
Strong sellStrong buy
Strong sellSellNeutralBuyStrong buy
Moving Averages
Neutral
SellBuy
Strong sellStrong buy
Strong sellSellNeutralBuyStrong buy
Displays a symbol's price movements over previous years to identify recurring trends.
Frequently Asked Questions
The current price of Bitcoin / UST (BTC) is 115,310.00000000 USDT — it has fallen −0.39% in the past 24 hours. Try placing this info into the context by checking out what coins are also gaining and losing at the moment and seeing BTC price chart.
Bitcoin / UST price has fallen by −3.57% over the last week, its month performance shows a 4.11% increase, and as for the last year, Bitcoin / UST has increased by 113.53%. See more dynamics on BTC price chart.
Keep track of coins' changes with our Crypto Coins Heatmap.
Keep track of coins' changes with our Crypto Coins Heatmap.
Bitcoin / UST (BTC) reached its highest price on Jul 14, 2025 — it amounted to 123,210.00000000 USDT. Find more insights on the BTC price chart.
See the list of crypto gainers and choose what best fits your strategy.
See the list of crypto gainers and choose what best fits your strategy.
Bitcoin / UST (BTC) reached the lowest price of 3,800.90000000 USDT on Mar 14, 2019. View more Bitcoin / UST dynamics on the price chart.
See the list of crypto losers to find unexpected opportunities.
See the list of crypto losers to find unexpected opportunities.
The safest choice when buying BTC is to go to a well-known crypto exchange. Some of the popular names are Binance, Coinbase, Kraken. But you'll have to find a reliable broker and create an account first. You can trade BTC right from TradingView charts — just choose a broker and connect to your account.
Crypto markets are famous for their volatility, so one should study all the available stats before adding crypto assets to their portfolio. Very often it's technical analysis that comes in handy. We prepared technical ratings for Bitcoin / UST (BTC): today its technical analysis shows the neutral signal, and according to the 1 week rating BTC shows the strong buy signal. And you'd better dig deeper and study 1 month rating too — it's buy. Find inspiration in Bitcoin / UST trading ideas and keep track of what's moving crypto markets with our crypto news feed.
Bitcoin / UST (BTC) is just as reliable as any other crypto asset — this corner of the world market is highly volatile. Today, for instance, Bitcoin / UST is estimated as 2.04% volatile. The only thing it means is that you must prepare and examine all available information before making a decision. And if you're not sure about Bitcoin / UST, you can find more inspiration in our curated watchlists.
You can discuss Bitcoin / UST (BTC) with other users in our public chats, Minds or in the comments to Ideas.