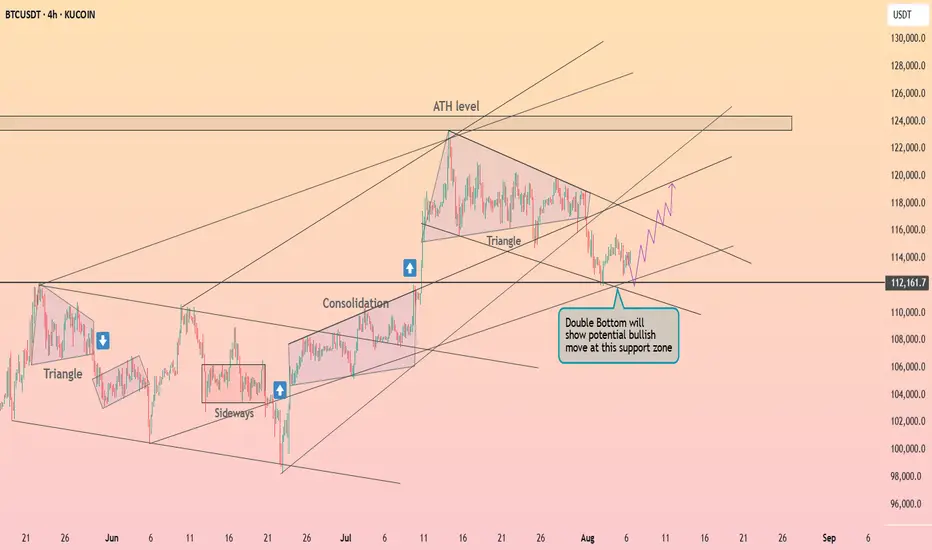
Bitcoin is forming a double bottom ┆ HolderStatKUCOIN:BTCUSDT is bouncing from 112,000 support, forming a potential double bottom. The setup aligns with prior bullish continuations from similar consolidation zones. A push toward the ATH region could follow if buyers remain in control.
BTCUST trade ideas
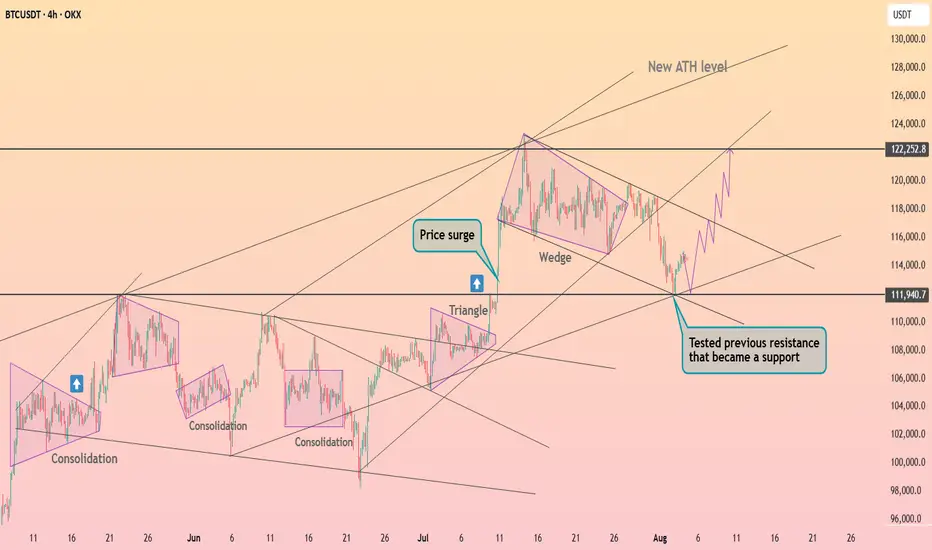
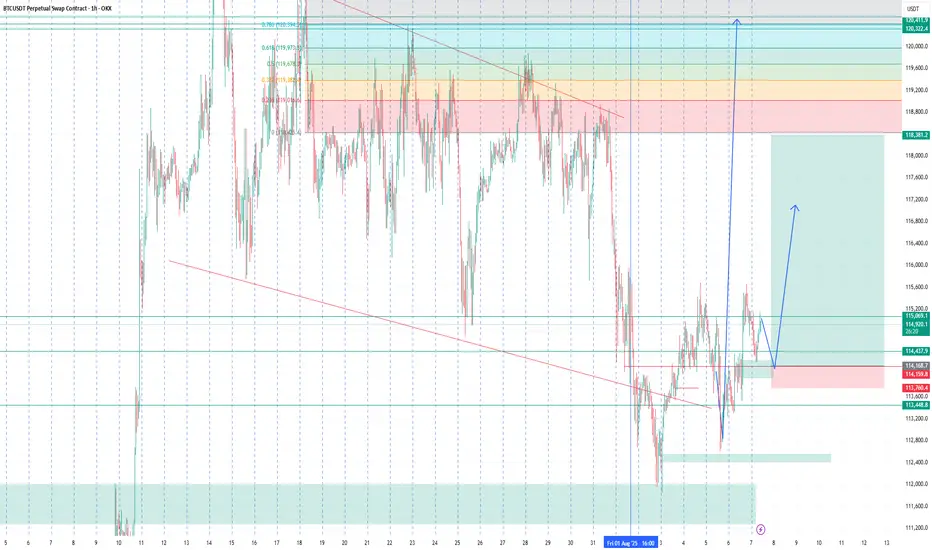
Bitcoin fixed above the $112k ┆ HolderStatOKX:BTCUSDT is recovering after touching the $111,940 zone, now confirmed as strong support. The price is reversing from the lower wedge boundary, suggesting renewed momentum. A clean push could retarget $122,250 in coming sessions.
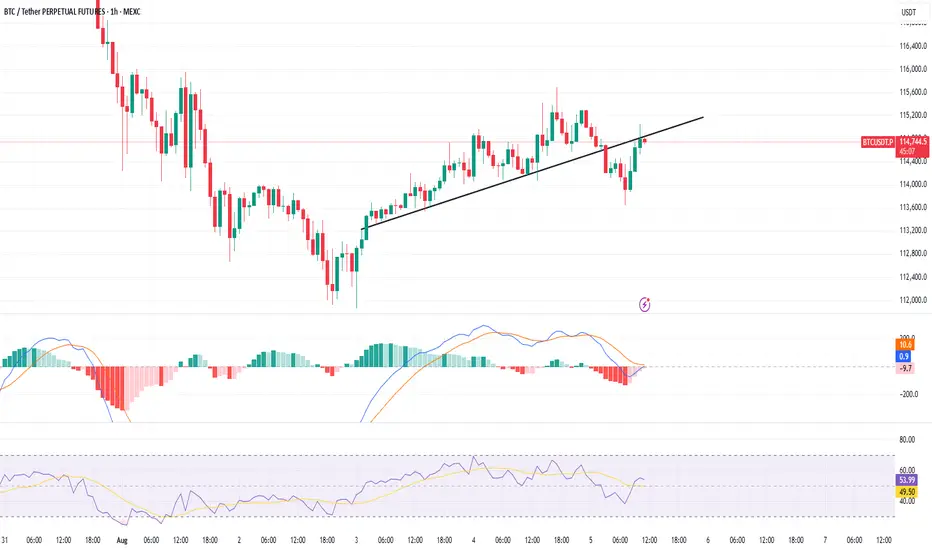
BTCUSDT – 1H Chart Analysis |Critical Retest at Broken trendline
📅 \ Date:\ August 5, 2025
⏰ \ Timeframe:\ 1H
📍 \ Exchange:\ MEXC
💱 \ Pair:\ BTC/USDT Perpetual Futures
---
\ 📉 Trendline Breakdown and Retest\
BTC has broken below the ascending trendline and is now retesting it from the underside. This setup often signals a \ bearish retest\ , especially when momentum is weak and rejection wicks appear near previous support turned resistance.
Last rejection came around \ \$114,800\ , right at the underside of the broken trendline.
---
\ 🔍 Key Technical Levels\
* \ Resistance:\ \$114,800–\$115,000 (confluence of trendline + supply zone)
* \ Support:\ \$113,300 (horizontal green zone, strong historical demand)
Failure to reclaim the trendline might open the path toward \ \$113,300\ . A strong breakout above the trendline may flip bias short-term bullish.
---
\ 📊 Indicators Overview\
\ MACD\ :
• Bearish momentum is fading
• Bullish crossover is forming but not yet confirmed
• Needs clearer separation and histogram recovery for confirmation
\ RSI:\
• Currently at \ 49.43\ , struggling to cross the midline
• Facing resistance near \ 53.14\
• Neutral to slightly bearish momentum
---
\ ⚠️ What to Watch\
🔺 \ Bullish Scenario:\ Break and close above \$115,000 → continuation toward \$116,200
🔻 \ Bearish Scenario:\ Rejection at trendline → decline toward \$113,300
---
\ 🧭 Conclusion\
BTC is at a decision point. The next few candles will likely confirm whether this is a failed breakdown or a clean rejection. Watch volume and candle closes carefully.
\ Patience is key – confirmation is everything.\
---
\ #Bitcoin #BTCUSDT #TechnicalAnalysis #Trendline #MACD #RSI #SupportResistance #CryptoTrading\
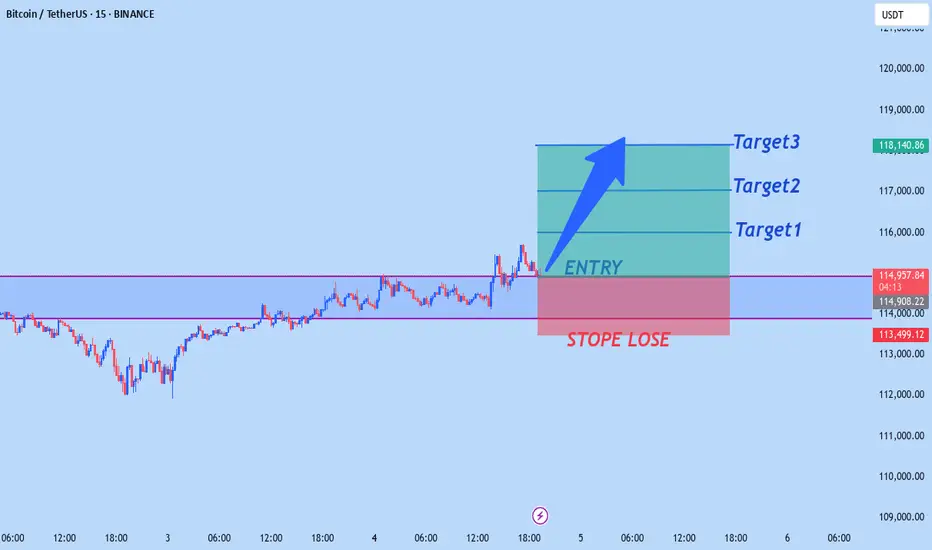
BTCUSD NEW OUTLOOK Btcusd buy from 115,000
Target1 116,000
Target2 117,000
Target3 118,000
Stope lose 113,500
TRADE AT YOUR OWN RISK
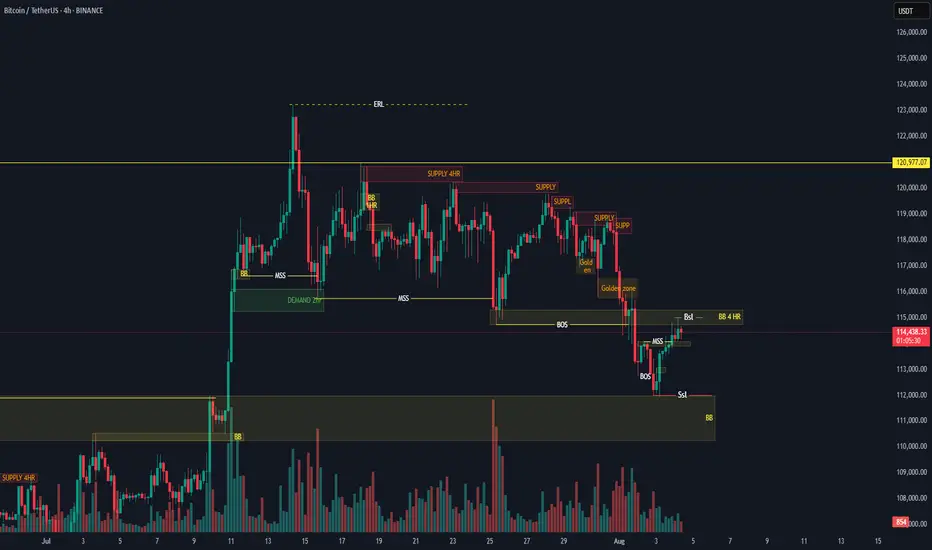
BITCOIN BULLISH POSSIBLE VIEW🧠 Key Observations (Smart Money Concepts - SMC Style)
🔄 Market Structure:
MSS (Market Structure Shift): Price recently made a MSS after a BOS (Break of Structure), indicating a shift to bullish structure.
BOS (Break of Structure): Seen on the move up from the demand zone.
SSL (Sell-side Liquidity) taken before the recent bullish move — classic liquidity sweep behavior.
📦 Zones:
Demand Zone: Between ~$111,000 and ~$113,000
4HR Supply Zone: Around ~$115,000 to ~$116,000 — where price is currently reacting.
Golden Zone (Entry/POI): Near the origin of the move that caused the BOS.
📍 Entry & TP/SL Setup:
Buy Limit: Placed at 111,931.32, right at the edge of the demand block.
Stop Loss (SL): Set just below at 110,453.42
Take Profit (TP): Targeting 113,676.39, right before the next resistance.
📊 Volume Analysis:
Large bullish volume spike aligns with the most recent BOS.
Diminishing sell volume during retracement suggests exhaustion of bearish momentum.
✅ Trade Idea (Based on Chart Setup):
Bias: Bullish
Entry: 111,931.32 USDT
Stop Loss: 110,453.42 USDT
Take Profit: 113,676.39 USDT
Risk/Reward: ~1:1.5 to 1:2
🔍 Additional Notes:
Liquidity Sweep: SSL cleared → indicates potential for long setups.
BOS + MSS Confluence: Bullish intent confirmed.
BB (Break of Block): Indicates intent to move higher if resistance is broken.
ERL Target: Final target is shown far above current price, near 123,280.88, could be a longer-term swing target if price holds structure.
🔄 Next Steps (as per typical TradingView publish ideas):
Set alerts at the demand zone.
Monitor price action when it taps into the Buy Limit level.
Watch for confirmation candle or volume spike before manual execution (if not using limit orders)
BTC Price Prediction and Elliott Wave AnalysisHello friends,
>> Thank you for joining me in my analysis. We finished the pink Y wave as wxy in purple counting. Now we are moving into creating a confirmation for starting the Big Yellow C wave.
>> our confirmations:
* 4Hr TF: I need to close above the 113420 level.
* 1D TF: I will prefer to close below 113297 and above its opening 112550, and the next double days break today's high.
Keep liking and supporting me to continue. See you soon!
Thanks, Bros
BTCUSDUpdate on this
I’ll keep y’all updated but for now price doesn’t have enough volume since it’s weekend
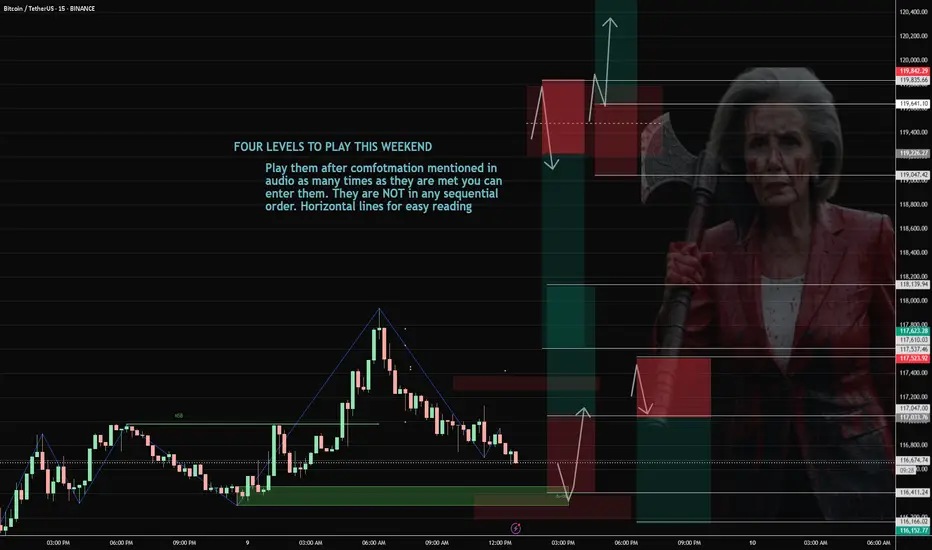
BTC 08/09-08/11 Levels To PlayPlay them after confirmation as many times as they are met you can enter them. They are NOT in any sequential order. Horizontal lines for easy reading. This is valid until BTC breaks below or above and those breakout levels are listed too.
LONG #1 (breakout): Break and hold above 119,500, buy the pullback 119,400–119,600 → targets 121,900 → 122–123k. Invalidate on loss of 119,000.
LONG #2 (sweep-reclaim scalp): Sweep 116,200–116,400, reclaim and hold above ~117,000 → 117,900–118,100. Invalidate on loss of the reclaim (~116,800).
SHORT #1 (rejection): Fail/sweep at 119,300–119,800 and close back inside → 118,900 → 118,000 → 117,500. Invalidate on H1 close > 119,800.
SHORT #2 (intraday fade): Reject 117,200–117,400 → 116,600 → 116,200. Invalidate on push/hold > 117,500.
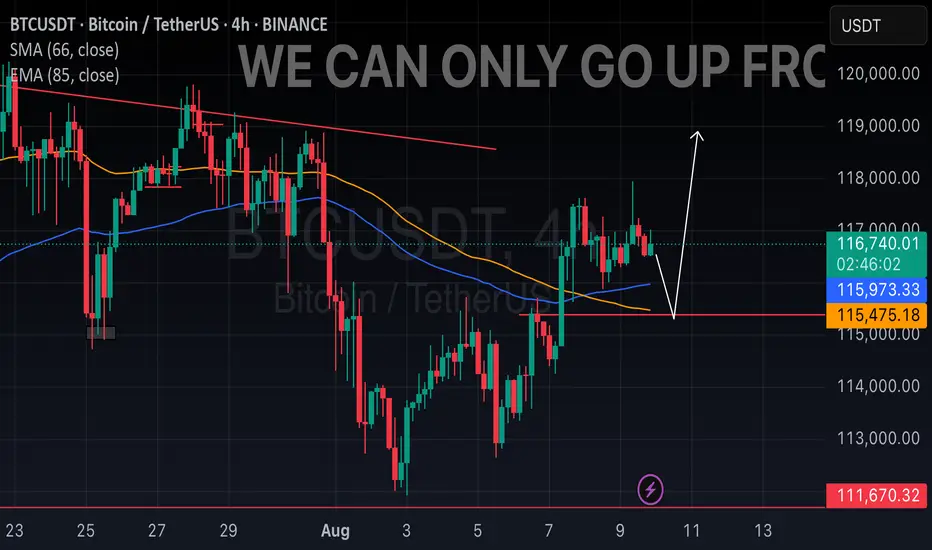
BTC 4H Ascending Support Retest, Will Supply Zone Reject Again?BTC has been respecting this ascending trendline since late June, with buyers stepping in each time price approached support. Now, price is hovering just above the trendline while the upper supply zone remains a strong ceiling. A clean bounce here could push us back toward 120K resistance, but a breakdown would likely open the door to a deeper pullback toward the June demand zone. Bulls need to defend this level decisively to avoid losing the uptrend momentum.

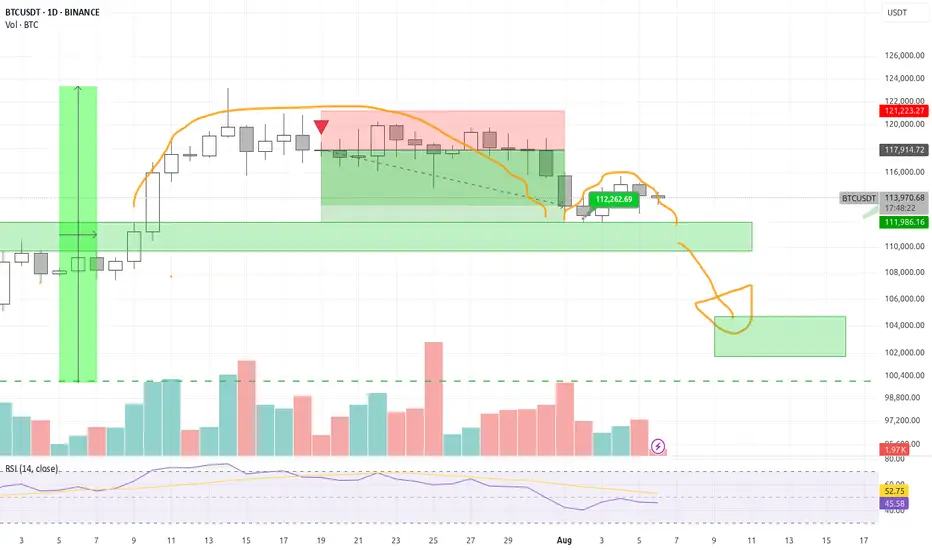
BTC BUYBitcoin in “interesting spot” during support retest
Bitcoin price comparisons keep coming as market participants see similarities between current market structure and earlier in the bull run.

BTCUSDT | Key Trend Channel Breakdown & Major Support AheadBitcoin has broken below a key trend channel on the 4H chart, currently trading around $113,891. Price is reacting after a sharp drop, approaching a major demand zone located between $107.5K and $109K, which previously acted as a strong support.
📉 Downside Potential:
Main Demand Zone: $107.5K – $109K
A possible bullish reaction is expected here if buyers step in aggressively.
📈 Upside Targets if Price Rebounds:
First Target: Upper boundary of local channel – ~$117.5K
Second Target: Full bullish recovery – ~$135K
⚠️ Note: This move comes after an extended consolidation and a sudden breakdown. Pay close attention to the lower boundary zone, as failure to hold could trigger a deeper correction.
📊 Chart Type: BTCUSDT – 4H (Binance)
🔧 Tools Used: Trend Channels, Support/Resistance Zones
📅 Date: August 3, 2025

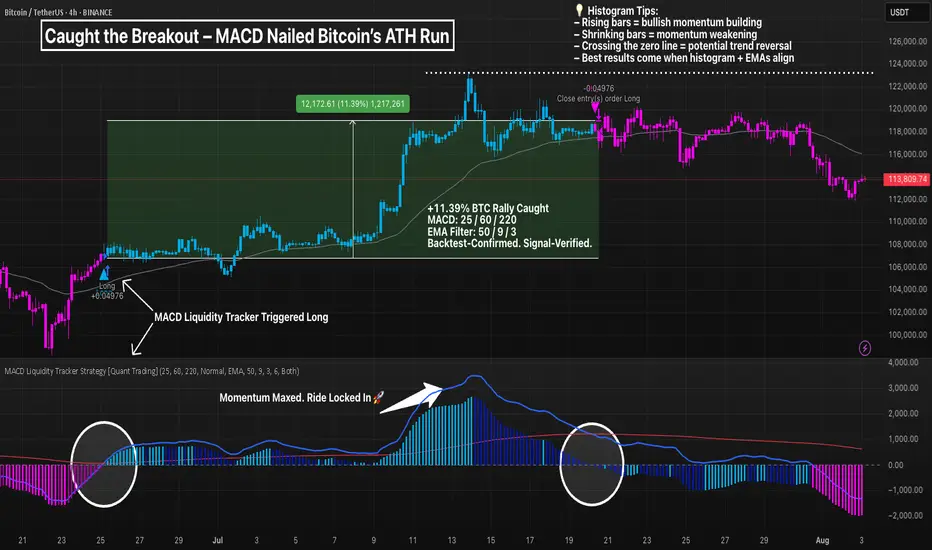
BTC -MACD Triggered the Breakout Early, MACD MasteryYou didn’t need 20 indicators. Just one system that actually worked.
The MACD Liquidity Tracker Strategy flipped long on BTC just before the latest 4H breakout — catching an 11.39% move with perfect histogram and EMA alignment.
🔍 Here’s what happened:
– Histogram flipped positive on July 23
– EMA filter cleared — clean long trigger
– Histogram rose into a momentum peak
– Strategy closed just before consolidation
This is exactly what the Liquidity Tracker was built for:
✅ Spot clean trend shifts
✅ Confirm strength via momentum
✅ Filter out noise using EMAs
⚙️ Settings Used:
– MACD: 25 Fast / 60 Slow / 220 Signal
– EMA Filter: 50 / 9 / 3
– Entry Mode: Histogram + Crossover Combo
BTCUSDTPreferably suitable for scalping and accurate as long as you watch carefully the price action with the drawn areas.
With your likes and comments, you give me enough energy to provide the best analysis on an ongoing basis.
And if you needed any analysis that was not on the page, you can ask me with a comment or a personal message.
Enjoy Trading ;)

BTC, ETH & Market Structure Outlook – Is the Pullback Over or Ju
💎🚀 BTC, ETH & Market Structure Outlook – Is the Pullback Over or Just Beginning? 🔥♦️
🧠 Dow Theory | Multi-Cycle Technical Breakdown | Index Watch
👉 Don't forget to LIKE, FOLLOW, and COMMENT to support the content!
♦️ BTC/USDT Analysis
🔻 The key support at 115,725 was broken – but has the macro trend turned bearish? Not yet.
📉 From the HWC (1D) perspective, BTC has dropped only ~4.5%, which still looks like a pullback.
🟥 However, if price stabilizes below 109,000, we will begin shifting to a bearish macro bias.
🧠 Weakness in trend is present but not confirmed.
🔄 MWC (4H) – Sideways, Then Breakdown
📊 After a strong rally, BTC ranged for about 17 days, then broke below the range support.
🔽 The 4H trend leans bearish, but it's not a strong or confirmed downtrend.
⏱️ LWC (1H) – Clearly Bearish
📉 Lower highs and lower lows are forming. The trend is decisively downward in 1H.
🚀 Bullish Scenario:
If BTC bounces from 112,000, we need:
• A strong new high
• A healthy pullback
• A breakout of the new high → then long entries are valid
❗ Bearish Scenario:
If 109,000 breaks with volume → strong bearish continuation likely.
♦️ ETH/USDT Analysis
🔸 The 3538 level is key.
✅ If ETH shows clear reaction, followed by a breakout, a long position becomes valid.
⚠️ But only after a confirmed trend shift on the 4H timeframe.
♦️ Top Altcoins
⭕ Most alts are in an uncertain phase.
🕒 It's best to wait until new highs/lows and a valid structure are formed.
♦️ BTC Dominance (BTC.D)
💥 BTC.D broke through the critical 62.22 level.
🟡 Now we wait: Will it hold above or fake out and reverse?
🔻 If BTC is dropping while BTC.D is rising →
👉 Result: BTC drops moderately, but alts drop much harder.
♦️ USDT Dominance (USDT.D)
📉 This chart reflects market fear & greed.
Currently showing reduced greed (risk-off behavior).
🔸 Next resistance levels: 4.63 and 4.72
❗ If these break → bearish bias becomes dominant.
⭕ However, a fakeout here could create a fast early entry opportunity.
♦️ TOTAL Market Cap
📍 Market is sitting on a major support level – but BTC remains the key driver.
❗ No confirmed long setups until BTC structure shifts bullish.
♦️ Strategic Outlook
1️⃣ Not a good time to open fresh positions – wait for clear 4H structure formation
2️⃣ Bias remains bullish overall, but waiting for confirmation
3️⃣ Until BTC trend clearly reverses, we are not focused on BTC.D reversals – they remain secondary
4️⃣ On the Bitcoin chart, you can see another red zone — breaking the first one will invalidate the bullish outlook, and breaking the second one will trigger a search for short positions.
5️⃣ To return to a strong uptrend, breaking the green zone around 120,000.00 is essential.
6️⃣ I’ve drawn two green upward paths on the chart. I’ll be looking for such a path for an early long entry.
💎 Stay cautious, manage risk, and follow structure!
🚀 Smash that ROCKET, leave a LIKE, and hit FOLLOW for daily crypto insights!

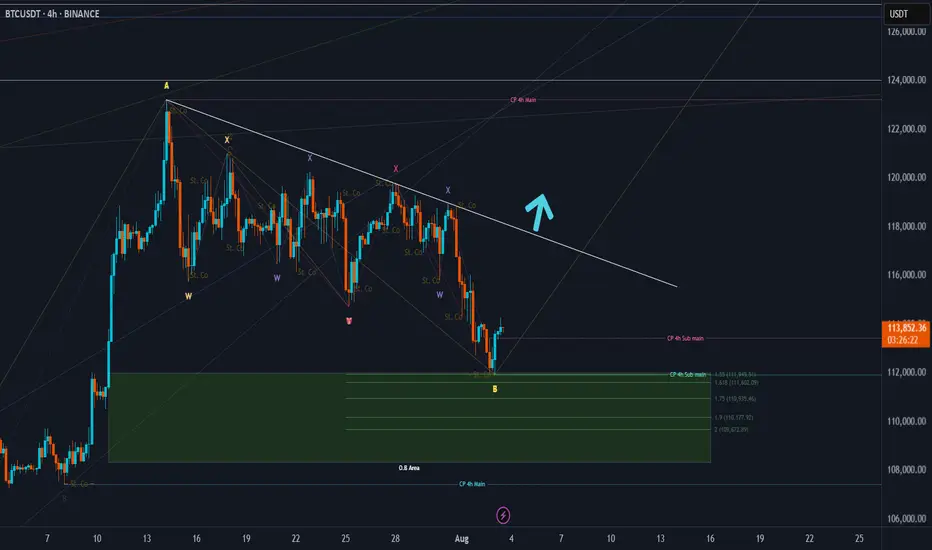
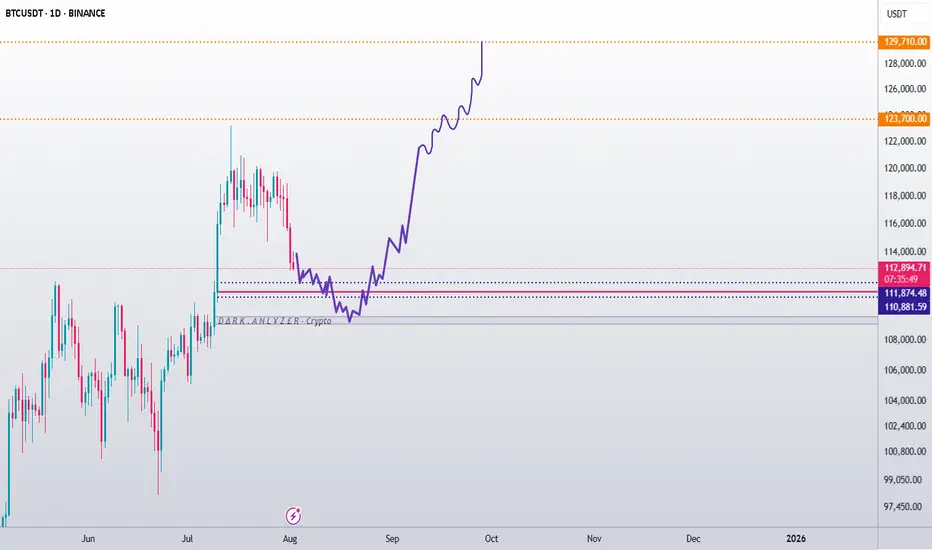
Could this be the end of Bitcoin’s trend?The Current State of Bitcoin’s Trend: Has the Uptrend Come to an End...?
Based on recent analyses, Bitcoin has exited its 4-hour channel over the past few days, and there is still a possibility for further correction. However, this does not mean that the uptrend for Bitcoin is over.
My targets for Bitcoin remain the same as before: 123,700 and 129,710. It’s even possible that we might see a wick above these prices.
For those with more capital who are looking to buy Bitcoin, there are two good entry levels:
110,880
109,770
Everything else is clearly shown on the chart. Please be cautious, as there will likely be high volatility once the market opens.
Be sure to open the analysis link and boost the analysis with your likes.
U.S. Pensions Enter Crypto Amid Quantum Threat to BitcoinThis week, U.S. President Donald Trump signed an executive order allowing retirement 401(k) plans to invest in cryptocurrencies, as well as private equity and real estate. The move opens the door for digital assets to tap into the $12 trillion U.S. retirement savings market.
A Watershed Moment for Institutions
Integrating cryptocurrencies into retirement plans could be a historic step toward recognizing digital assets as a legitimate asset class. Younger investors, in particular, stand to benefit from exposure to high-growth, long-term instruments. However, financial advisors caution that cryptocurrencies remain highly volatile and should be part of a diversified investment strategy.
Risks and Opportunities
While expanding crypto access through pension plans offers significant upside, it also raises questions around regulation, investor protection, and fee transparency. Past market downturns have shown that excessive exposure to volatile assets can harm savings during periods of instability.
The Quantum Threat to Bitcoin
Parallel to the pension plan news, experts are increasingly discussing the potential threat of quantum computing. According to Barron’s, by the mid-2030s, technological advances could compromise the cryptographic security of older Bitcoin addresses. While approximately 75% of BTC is already stored in more modern, secure wallets, the industry is accelerating the development of quantum-resistant protocols.
Defensive Strategies
Blockchain developers — including the Bitcoin Core and Ethereum Foundation teams — are testing post-quantum cryptography algorithms to ensure long-term security. The objective is to stay ahead of technological breakthroughs that could otherwise undermine digital asset safety.
Conclusion
The U.S. decision to allow crypto investments in pension plans is a milestone for the industry, signaling maturity — but it also presents new regulatory challenges. Meanwhile, the quantum computing threat serves as a reminder that the crypto sector must invest not only in growth, but also in securing its foundational infrastructure.

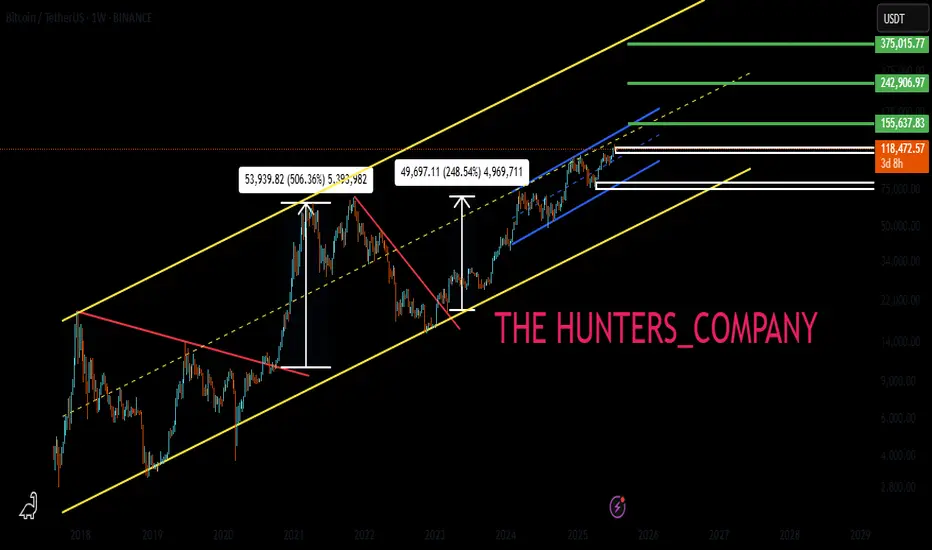
BTC : The future of Bitcoin...Hello friends🙌
👀According to the price history, the price has always been bullish and is in a long-term bullish channel.
📈Now that the price is struggling in the middle of the channel and is gathering strength for a big move, which is expected to break the middle of the channel in the form of a resistance or middle channel, the price will move to the ceiling of the channel.
⚠Don't forget risk and capital management.
🔥Follow us for more signals🔥
*Trade safely with us*
daily BTC analysis Bitcoin breaks the $115,000 level and approaches $112,000. Personally, I expect this level to be unsustainable and the next level is $110,000. This analysis is not financial advice in any way.Crypto Futures Trading Could Destroy All Your Money

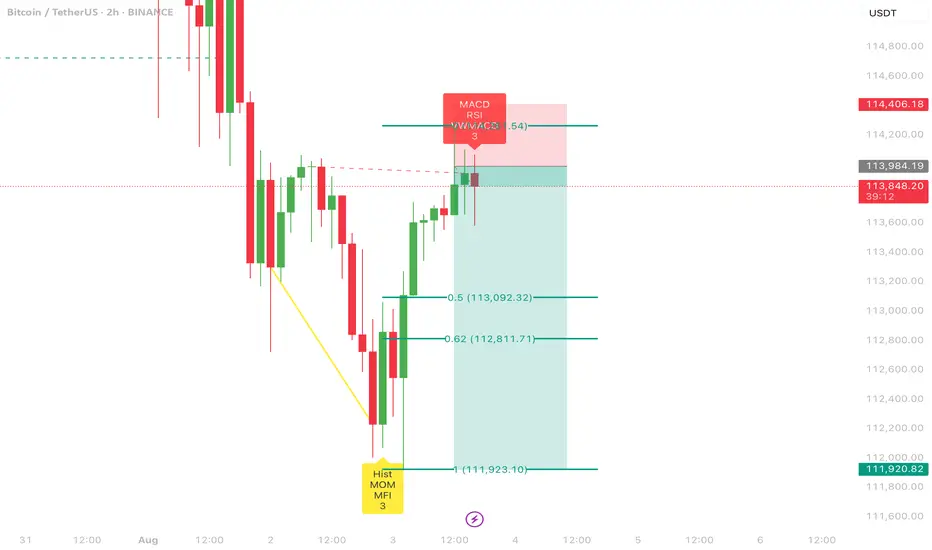
BTC ShortAiming for some downside liquidity currently .
First take profit - 0.62 fib
Second take profit - 1 fib
BTC HUGE DROP TO 113,400$ - BIG CRASH !*Sorry for posting to late as I am between a trip in Malaysia.*
Details:
Entry: Now - 117,000 $
Target Price: 113,410 $
Stop loss: 119,460 $
Trade Ideas:
Market creating a flag pattern here. Though its not only the logic we have some secret logics here and indicators which I shared in the VIP.
What is required to Join VIP?
- Nothing just you have to share 10% of your profit with us at the end of the month which you earned from our signals. Yeah this is just the requirement, trade where ever you like your favorite broker or else you don't need to pay fees first or create account thru our link.
Trade Signal:
I provide trade signals here so follow my account and you can check my previous analysis regarding BITCOIN. So don't miss trade opportunity so follow must.
BINANCE:BTCUSDT BINANCE:BTCUSDT.P BINANCE:BTCUSD

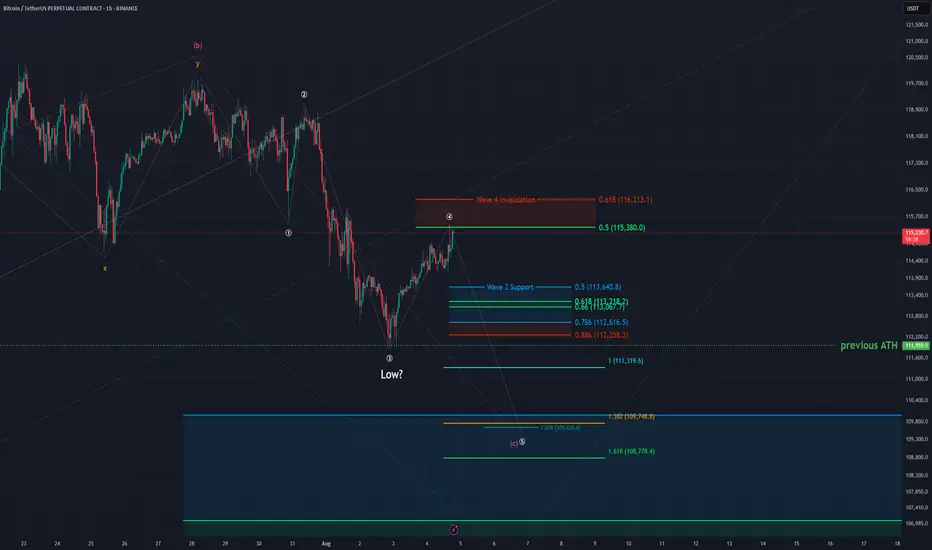
BTC - 1H Elliott Wave AnalysisWelcome back to another Elliott Wave Analysis for Bitcoin! :)
In this analysis we want to focus on the short term. We have been in a correction displayed as pink ABC and it seems that this correction is coming or has come to an end in the pink Wave C.
It is hard to say if the pink Wave C has finished yet. The last low at 111'850 USD is the 1 to 1 ratio of the pink Wave A to the pink Wave C which is a common target for Wave C.
Looking at the sub-count in white we think another low in white Wave 5 would look cleaner but it is not given to happen.
For now we added the white Wave 4 resistance of which we touched the 0.5 FIB retracement at 115'830 USD which is a rather deep but valid Wave 4. We also added the 0.618 FIB at 116'213 USD which would be the invalidation for the white Wave 4. If we hit it the probabilities shift to the case that the low at 111'850 USD is already the end of pink Wave C.
If we get white Wave 5 the first target would be at the 1 to 1 FIB at 111'319 USD which is right below the last ATH of which we bounced recently but that seems a bit shallow.
The next target would be at around 109'700 USD where we got some confluence between the 1.38 FIB target for white Wave 5 measured with the white Wave 1 as well as the 1.618 FIB target if we measure of the white Wave 4. It is also close to the 0.5 FIB of a bigger support area.
Be aware that the bigger support area below goes down to 103'000 USD which is the 0.786 FIB of the support area.
Due it looking likely that pink Wave C is finished we also added the support area for the potential Wave 2 in the bullish scenario.
It is between the 0.5 FIB at 113'640 USD and the 0.786 FIB at 112'616 USD. From this area we would like to see a bounce if the low is already in.
Thanks for reading.
We would appreciate a follow and boost if you like the analysis! :)
NO FINANCIAL ADVICE.