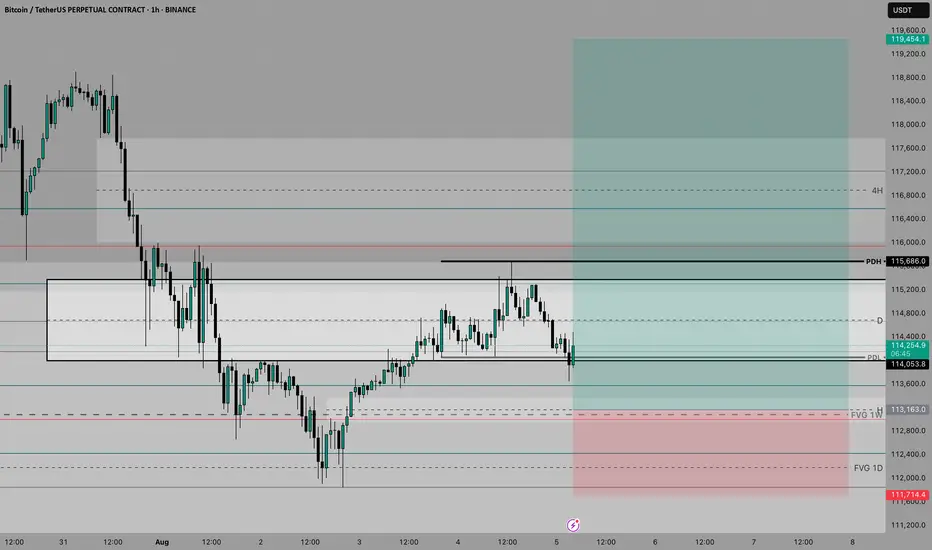
Daily Bitcoin AnalysisBitcoin is at support at $115,000. Personally, I think this support will not hold and it will reach the next level of 112,000. Why? Because the downward momentum of the price is high.
This is not financial advice
BTCUST trade ideas
BTC Next Move Toward $150K?Bitcoin recently broke out above a long-standing resistance zone ($110K–$115K), supported by a clean move through the volume profile high node. After testing local highs, BTC is now pulling back to retest the breakout area, a critical level that could act as new support.
Key Points:
Breakout Retest: Price has pulled back into the breakout zone around $114K, aligning with strong previous resistance that may now flip to support.
Volume Profile: A strong high-volume node is visible below ($105K–$110K), which reinforces this area as a major demand zone.
EMA Confluence: The 50-day and 100-day EMAs are trending upward and aligning near the retest area, providing additional support.
If this level holds, BTC could resume its bullish leg toward the $150K level.
Cheers
Hexa

This is why I firmly believe we'll witness BTC reach 150K soon.No caption needed and every reasons are kept in the chart. Zoom In and analyze every single lines in the chart and hope you will see what I tend to see as far as my capabilities allows me. Let me know your comments on the idea. I am looking forward to witness $150K in the next 3 to 4 months time. I will be updating my confluences to say this on higher timeframes too.
With Regards. And stay Tuned.
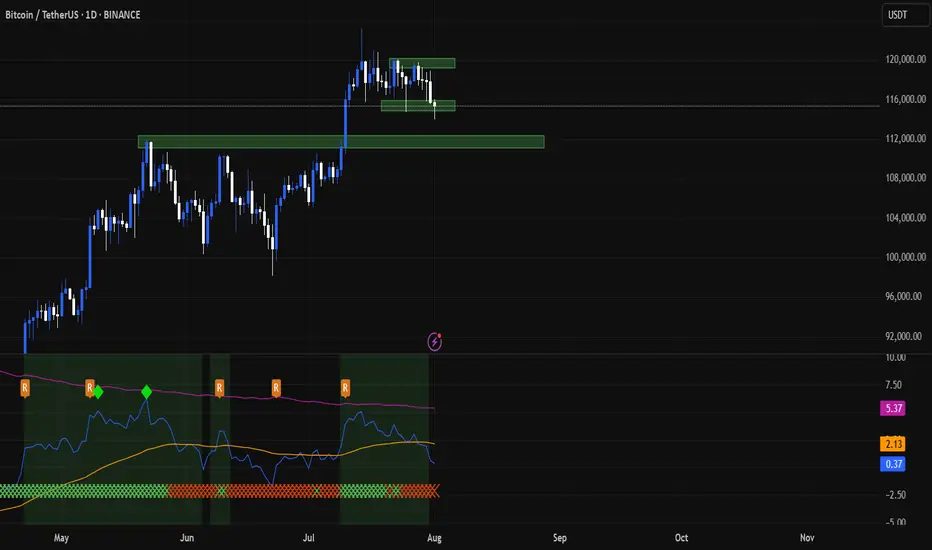
Bitcoin & The Altcoins —Name Your AltcoinBitcoin is sideways right now and is moving in a very tight and narrow range. All the action has been happening between $117,000 and $120,000 based on candle close since 11-July. This is bullish, think about it.
Bitcoin hits a new all-time high and next thing you know it turns sideways very close to resistance. The only drop was short-lived and everything sold was quickly bought. Why is Bitcoin consolidating so close to resistance? It is preparing to move ahead.
What happens when Bitcoin moves forward after so much recovery? Everything experiences a positive cycle. This is a very strong signal.
This chart allows for more whipsaw as you know nothing else is possible in a trading range. We predict the pattern to resolve bullish, but there can be swings to either side. A swing down just as it happened 25-July. A swing up just as it happened 14-July. This is always possible but the end result won't change. Bitcoin will continue sideways but when the sideways period is over, you will not see a move toward $110,000 or $100,000. The break of the trading range will confirm the advance toward $135,000 next month. Bitcoin is likely to continue in the same mode. While Bitcoin consolidates the new advance, the altcoins grow. In this way the entire market continues to recover and grow month after month after month.
Name Your Altcoin
Leave a comment with your favorite altcoin trading pair and I will do an analysis for you. I will reply in the comments section. Make sure to include any questions you might have beforehand.
If you see a comment with a pair you like, boost and reply so these can be done first.
Thanks a lot for your continued support.
Namaste.
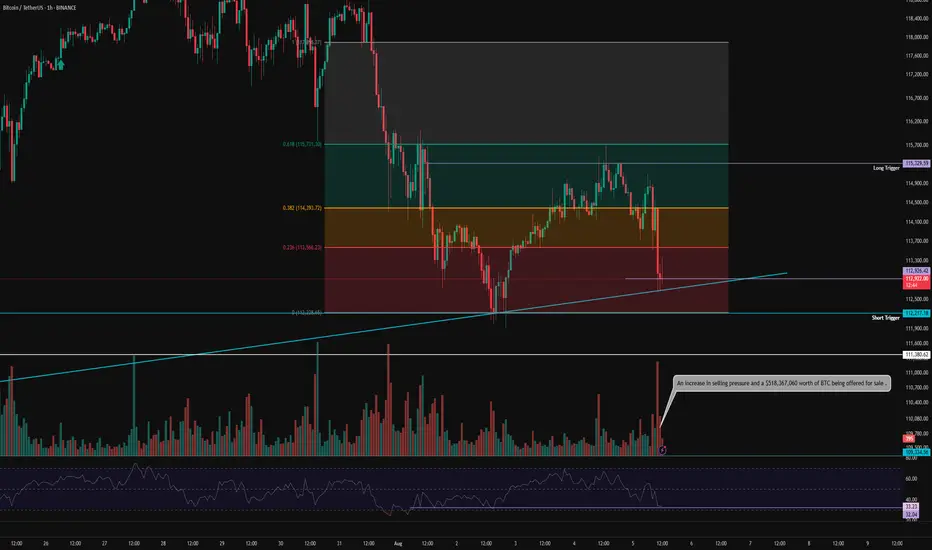
BTC 1H Analysis – Key Triggers Ahead | Day 4💀 Hey , how's it going ? Come over here — Satoshi got something for you !
⏰ We’re analyzing BTC on the 1-hour timeframe .
👀 After triggering our long entry levels , Bitcoin faced increased buying volume , and the U.S . unemployment claims came in higher than expected, which was interpreted positively for the crypto market .
🔼 With rising buying volume, Bitcoin may continue moving toward higher levels and could even aim for a new local high. Our key support zones are the same trigger levels we've been watching—these are also our ideal long entry points .
⚡️ There is a strong resistance around $117,000, where taker sellers are actively selling their Bitcoin at premium prices. In order to break through this area, we’ll need solid volume inflow from both market makers and retail buyers .
⚙️ There’s no clear RSI support zone at the moment, since on the 1-hour chart RSI is already in the Overbought area and oscillating there .
📈 Long position : Be a bit patient here . Wait for Bitcoin to pull back to key Fibonacci levels , preferably around 0.236 and 0.382, and then bounce back up . Once we break above the pullback, you can consider entering a long trade .
📉 Short position : A short setup could form only if both of our marked trigger levels get stop -hunted, combined with increased selling pressure , support breakouts , and confirmation from bearish candlestick patterns.
That said — we are not looking to short right now, as there are better opportunities to catch strong long entries .
❤️ Disclaimer : This analysis is purely based on my personal opinion and I only trade if the stated triggers are activated .

BTC Hourly Analysis – Day 1 | Trend Structure & Key Reactions⏱️ We’re analyzing Bitcoin on the 1-hour timeframe.
👀 After breaking below its support zone at 107,402, Bitcoin experienced a correction along with increasing sell pressure. The price then moved toward the 112,200 support area, where it formed a V-pattern — which has now been broken to the upside.
🎮 We’re using Fibonacci levels to identify key resistance zones and long-entry triggers. A higher low has formed above the 112,217 support and above the 0.382 Fib level, which could serve as a strong confirmation of the breakout .
⚙️ The RSI oscillator on the 1H chart is currently above 50. If buying volume increases, RSI may enter the Overbought zone. The critical level here is 70 — breaking above it can act as a confirmation for a long position .
☄️ A specific Fibonacci-based zone, linked to market maker sellers and supply pressure, was touched, triggering a reaction — around 177 BTC were sold following that touch .
🖥 Summary : As long as Bitcoin stays above its previous high, there’s no immediate concern for long positions. Based on the confirmations above, you may consider entering a long position upon a resistance breakout and taker-seller zone clearance .
📉 No short positions are planned until the 110,000 support level is clearly broken .

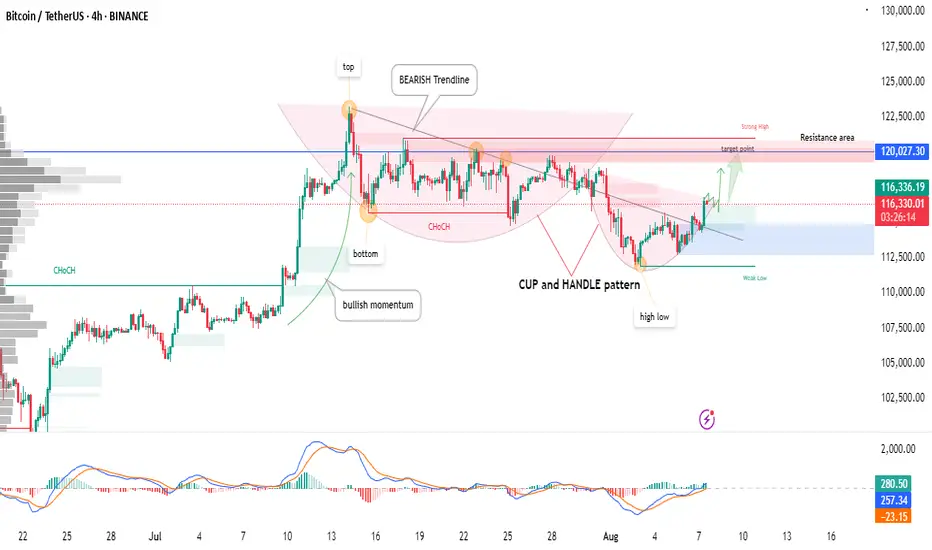
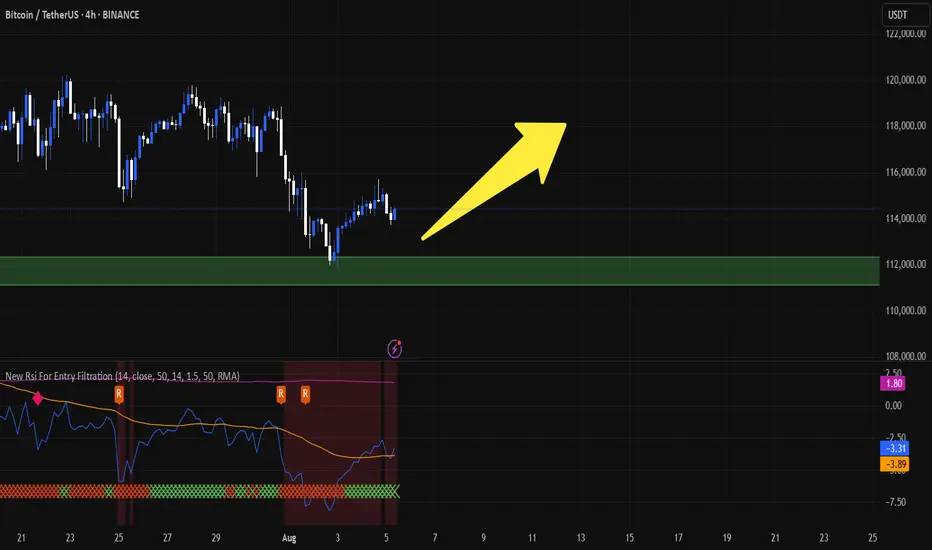
BTCUSDT | Cup & Handle Breakout Forming – Key Resistance Ahead!Bitcoin is forming a classic Cup and Handle pattern on the 4H chart, indicating potential for a bullish breakout.
🔹 Key Highlights:
Clear bullish momentum after a confirmed ChoCH (Change of Character)
Bearish trendline has been broken, shifting market structure
Price approaching the resistance area near $120,000, which aligns with a strong high
Watch for breakout above the target zone for potential continuation
MACD shows bullish divergence supporting momentum
📌 A clean break and close above the resistance zone could trigger the next leg up. However, a rejection here may retest the $112,000–$114,000 demand zone (handle support).
🧠 Not financial advice. Always do your own research before trading.
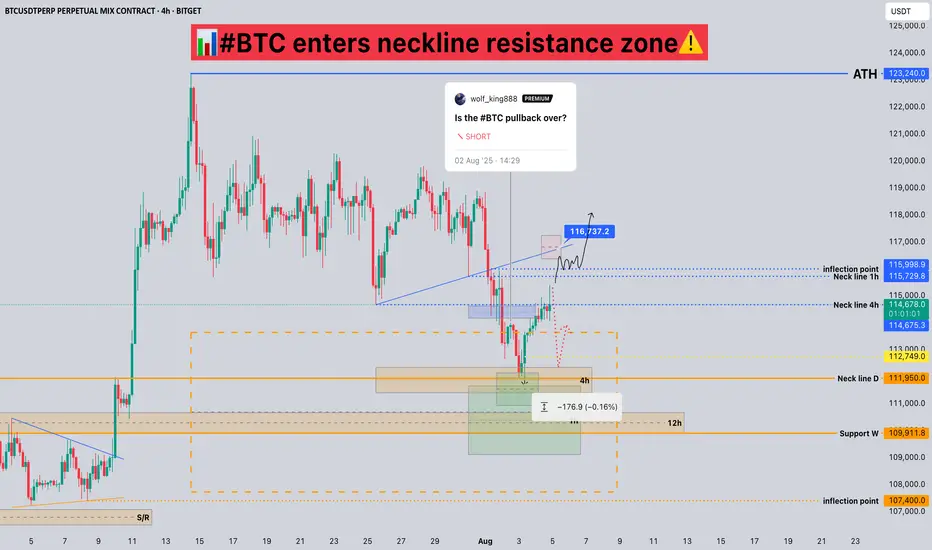
#BTC enters neckline resistance zone📊#BTC enters neckline resistance zone⚠️
🧠From a structural perspective, we hit the daily neckline support and began to rebound. Unfortunately, it's about $170 away from the overlapping support zone I'm focused on, and the rebound didn't establish a 1-hour bullish structure. This suggests a high probability of encountering resistance and a pullback after this rebound. Therefore, don't chase the rally at the neckline resistance zone! Only if we can break through the neckline resistance zone and stabilize for a day or so should we actively consider a bullish move.
➡️Support is clearly around 120,000. Even if it falls below this level, as long as the 4-hour closing price is above it, this support level will remain valid. Extreme support is still around 110,000!
🤜If you like my analysis, please like 💖 and share 💬
BITGET:BTCUSDT.P
BTC 1H Analysis – Key Triggers Ahead | Day 2💀 Hey , how's it going ? Come over here — Satoshi got something for you !
⏰ We’re analyzing BTC on the 1-hour timeframe .
👀 After the strengthening of the US dollar , Bitcoin experienced a drop and formed a short-term support bottom around the $113,000 level . It is currently completing a pullback to the levels of this recent decline .
🎮 Our Fibonacci retracement is drawn from the breakout zone to the $112,200 bottom . Bitcoin broke below the 0.236 level and then found support . The best potential entry trigger, based on Fibonacci, is at the 0.382 level, or around $115,000 . If Bitcoin breaks above this level , it could form a higher high and a higher low in this timeframe .
⚙️ The RSI is showing a support level around 32 , which is currently preventing Bitcoin from entering the oversold zone . However , if this support is lost , Bitcoin could move into oversold territory .
📈 Our long position trigger is at the 0.382 Fibonacci level . A confirmed breakout of this level , combined with RSI overbuying and increased volume , would be our entry signal .
📉 Our short position trigger is around $113,000 . If this support breaks , we may open a short position . However, the main short trigger is at the 0 Fibonacci level ( support at $112,200 ) . If selling pressure increases and RSI enters the oversold zone , we will consider entering a short position with confirmation .
❤️ Disclaimer : This analysis is purely based on my personal opinion and I only trade if the stated triggers are activated .
BTC_TRADING IDEA 08/01/25So we had a nice retracement. I’m now patiently waiting in a discount zone, aiming for a MTF LQ.
I have plenty of reasons to wait here:
– FVG
– OB
– OTE
If it doesn’t play out, I’ll look for another PD Array.
Let’s see!
BTCUSD : Long levelHere is a great entry point for those who scalp this instrument or pips. The level is marked with a green arrow. It will be active until I report. It may become inactive over time.
Watch out for trading on the news.
Is the current Bitcoin price a good place to buy?Bitcoin has been falling since last night towards $112,000. I don't think it will go below that. I think $113,000 is a good price to buy. Of course, with a stop loss of 111,500. This is not a financial offer. Don't get into futures trading because you might lose all your money.
BTCUSDT: A Bullish Foundation Meets Fibonacci FirepowerBTCUSDT: A Bullish Foundation Meets Fibonacci Firepower
BTCUSDT is currently at a critical juncture, navigating a significant upward trendline and a key Fibonacci retracement level. The chart highlights the ongoing battle between buyers and sellers following a strong multi-month rally. Price action is testing a major confluence zone, which will likely determine the immediate future direction of the market.
1. The Bullish Foundation (Late March - July):
• Long-Term Uptrend Line (White): A prominent upward-sloping trendline originating from the late March lows has defined the bullish narrative. Price has consistently found support on this line, demonstrating a strong underlying buying interest and a disciplined ascent. This trendline has been a reliable gauge of the market's health and a key area for bulls to defend.
• Fibonacci Retracement Levels: When we apply the Fibonacci retracement tool from the recent swing low to the all-time high, several potential support areas are identified. These levels are critical for understanding potential pullbacks and market structure.
2. The Current Inflection Point (Late July - August):
• Confluence Zone: The market is currently engaging with a high-stakes confluence zone. This area is defined by two key technical indicators:
o The Long-Term Uptrend Line: Price is testing this foundational support line for the first time since the July peak. A bounce from this level would reinforce the long-term bullish bias.
o The 0.236 Fibonacci Level (~$111,804): This is the first level of support in the Fibonacci sequence. The market is finding temporary footing here, and a decisive break below this level would be a bearish signal, suggesting a deeper retracement is likely.
3. Potential Scenarios:
• Bullish Continuation : The most optimistic scenario involves a successful defense of the current confluence zone. A strong bounce from the white uptrend line and the 0.236 Fibonacci level, backed by increased buying volume, would signal that the bulls are still in control. In this case, a re-test of the recent all-time highs would be the next logical target.
• Bearish Retracement : If the confluence zone fails to hold, and BTCUSDT breaks decisively below the trendline and the 0.236 Fibonacci level, it would suggest a deeper correction is underway. The next major support zone to monitor would be:
o The 0.382 Fibonacci Level (~$104,666) : This level has historically acted as both support and resistance, making it a critical psychological and technical area. A drop to this zone would likely be met with renewed buying interest.
o The 0.5 Fibonacci Level (~$98,897) : A move to this level would signal a more significant correction, potentially testing the psychological $100,000 mark.
Conclusion:
BTCUSDT is at a pivotal moment. The market's reaction to the current confluence of the long-term uptrend line and the 0.236 Fibonacci retracement level will dictate the short-to-medium-term direction. A bounce from here would confirm the strength of the uptrend, while a break lower would open the door for a deeper retracement toward the next key Fibonacci levels. Traders should closely monitor price action and volume at these critical levels for confirmation of the next directional move.
Disclaimer:
The information provided in this chart is for educational and informational purposes only and should not be considered as investment advice. Trading and investing involve substantial risk and are not suitable for every investor. You should carefully consider your financial situation and consult with a financial advisor before making any investment decisions. The creator of this chart does not guarantee any specific outcome or profit and is not responsible for any losses incurred as a result of using this information. Past performance is not indicative of future results. Use this information at your own risk. This chart has been created for my own improvement in Trading and Investment Analysis. Please do your own analysis before any investments.
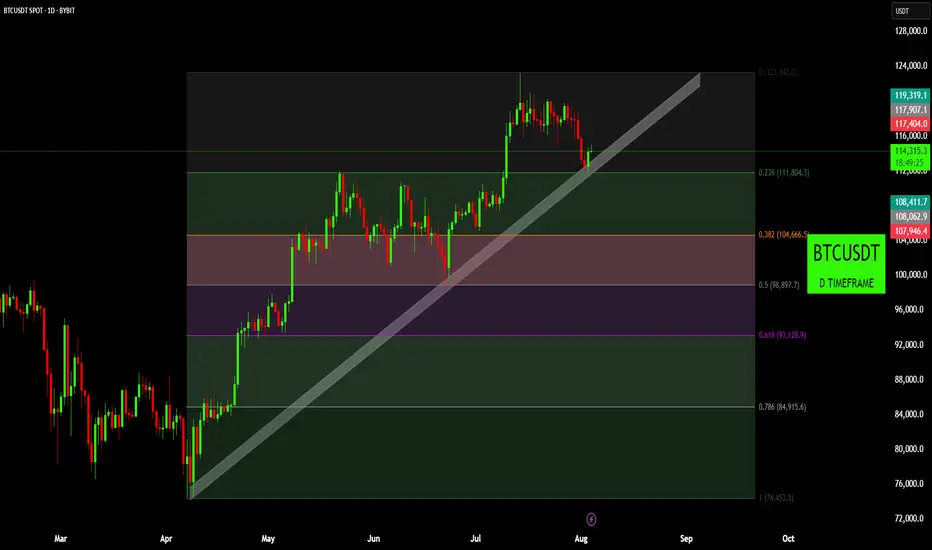
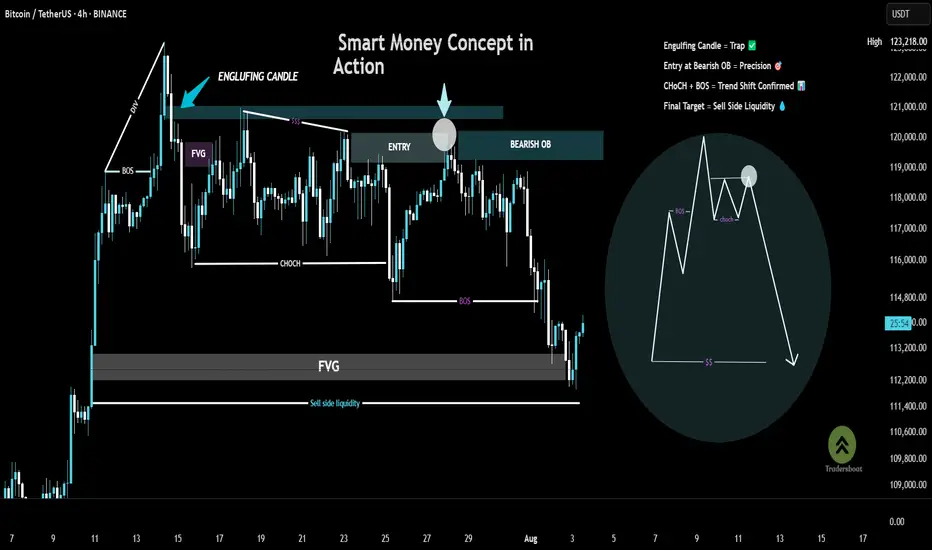
Chart Breakdown – Smart Money Concept in ActionThis chart showcases a textbook example of a bearish setup based on Smart Money Concepts (SMC):
BOS (Break of Structure) at the left confirms a shift in momentum.
A strong engulfing candle pierces into a supply zone, setting the stage for a potential reversal.
Price forms an FVG (Fair Value Gap) and returns to fill the imbalance, offering a high-probability entry within the Bearish Order Block (OB).
A clear CHoCH (Change of Character) signals a bearish trend shift, validated by the second BOS.
The trade targets Sell Side Liquidity, resting below the recent lows—just where smart money aims.
🎯 This setup combines precision, patience, and the power of understanding institutional moves.
BTC Retracement Loading.....Bullish Bounce Ahead?Bitcoin is showing signs of a short-term pullback after tapping into a Fair Value Gap (FVG) zone, triggering a potential short setup. Price is likely to retrace toward the bullish order block and retracement zone around 105,000–110,000. If that area holds, we could see a strong bounce back toward the 123,000 level.

$BTC - LTF OutlookCRYPTOCAP:BTC | 1h
On lower timeframe, we want 115.6k (monthly open) to hold.
If you're currently short, might take partial profit if we bounce and break above 116.8k
Short remains safe below 116.8k. If 115.6k (monthly open) breaks, eyeing for 114.2k-113.3k (mondayLow) for long re-entry.
BTC Price Prediction and Elliott Wave AnalysisHello friends,
>> Thank you for joining me in my analysis.
* For the biger imagination of the BTC path, we are still moving into the Orange wave A of the final Green C for ABC from its begining.
* For the smaller imagination of the BTC path, we are still moving into the Blue wave C of the final Green C for the upper Orange wave A.
* For the tighter imagination of the BTC path, I think we are still moving into the correction wave B for the upper Blue wave C.
>> Now we are moving in this Pink wave C for this correction B wave.
Keep liking and supporting me to continue. See you soon!
Thanks, bros
BTC-Stay Sharp. Self RegulateBTC Update
👀All Eyes on These Levels 👇
We’re back in A zone.
The level? 115,727.
This isn’t just any line on the chart — this is the same trendline that flipped from major resistance to support back to resistance on the same date of the infamous #bUCKmOON pump.
📈 If BTC breaks this level with strength and volume — I’m in long.🟢
No volume? No conviction. No entry.
But let’s not get carried away — resistance lurks right above at 117,000 — the former Exhaustion Zone Support now turned resistance.
A classic case of "what once held you up now wants to drag you down."
And if the bulls somehow clear that hurdle?
They'll run headfirst into the Exhaustion Zone Resistance — the real boss fight.
These are stacked walls — one after the other. No easy wins here.
🧠 As a chartist, I’m not here to write about what happens if we break through every ceiling like it’s some fanboy fantasy. That’s not analysis — that’s hopium.
🥂 Yeah yeah but— it’s fun to daydream about all the champagne showers, yacht parties, laser eyes, and the sudden urge to start a DAO that changes the world.
We all picture it.
We all love it.
And sure, when BTC rips through all resistance like butter, we’ll act like we "knew all along."
But anyways — snap back to reality...
There’s another level we can’t ignore:
112,388
👀 Even a 4-hour close below this level?
Just check the chart.
That’s when the bears come storming out of hibernation — angry, hungry, and ready to feast.
🎯Bottom line:
Stay sharp. Self Regulate.
The chart is the map. Discipline is the treasure.
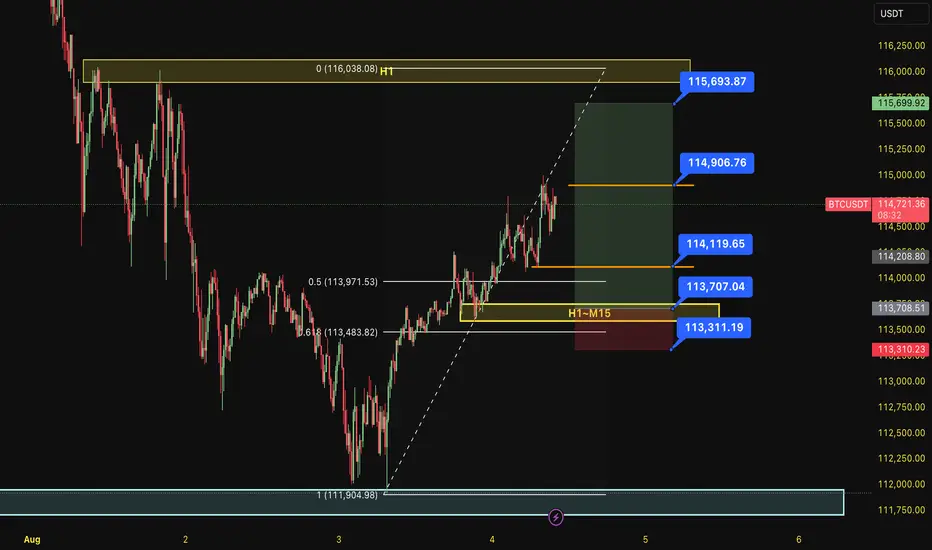
BUY BTC 4.8.2025Confluence order: BUY at H1~M15
Type of order: Limit order
Reason:
- The current top is not touching anything, expected to rise to the H1 above.
- M15~FIBO 0,5-0,618 (same position)
Note:
- Management of money carefully at the last bottom (114,119)
Set up entry:
- Entry buy at 113,707
- SL at 113,311
- TP1: 114,119 (~1R)
- TP2: 114,906 (~3R)
- TP3: 115,963 (~5R)
Trading Method: Price action (No indicator, only trend and candles)
BTC NEW LOOKBtcusd sell from 115,000
Target1 114,000
Target2 112,000
Target3 110,000
Stope Lose 116,500
TRADE AT YOUR OWN RISK

BITCOIN → Correction within a downward channel. 112K or 125K?BINANCE:BTCUSDT is consolidating. However, a local downward trading range is forming relative to the current setup. What is the probability of a correction continuing to 112K or growth to 125K?
Daily structure: a local correctional channel within a global bullish trend. We have cascading resistance at 119.2, 119.6, 120, and 120.8. It will be quite difficult to break through this zone on the first attempt, but MM can use it to form traps and collect liquidity.
At the bottom, everything is simpler — a breakdown of the local bullish structure, the formation of an intermediate minimum, below which there is a void down to 112K.
Yesterday, relative to 115-116K, mm staged a massacre (trap) on both sides of the market.
Liquidity collection, return to the range, and growth. The reaction to the false breakdown of support is quite strong. Since the opening of the session, Bitcoin has been heading towards resistance, but there may not be enough potential to break through the upper resistance conglomerate, so I expect to see a pullback or decline to 116-115-114.
Resistance levels: 119.2, 120.1, 120.85
Support levels: 116.37, 115.67, 112
Technically and fundamentally, I do not see any drivers that could support the market (I am talking about Bitcoin, since the driver for altcoins is the decline in Bitcoin's dominance). It is possible that this may appear later. In the current situation, I am considering a false breakout and correction, as the market has not yet finished consolidating or correcting, and the current downward trading range may be extended.
PS: As the price moves towards resistance, it is necessary to monitor the reaction. The market itself will show what it is preparing for...
Best regards, R. Linda!

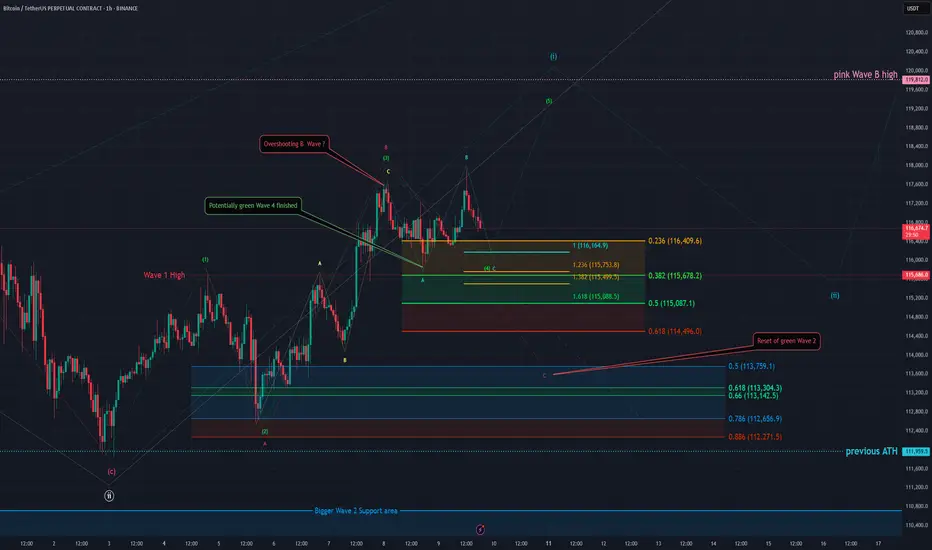
BTC - 1H Elliott Wave Analysis - 09.08.25Greetings and welcome to our next update for our Elliott Wave Count for Bitcoin.
The case is pretty much the same as yesterday in our last update so we'll try to keep it shorter today but feel free to check out our last analysis if you're interested in more details!
It'll be linked below in the notes :)
It is possible that we finished the green Wave 4 already and started moving up in the green Wave 5 but we think it is rather unlikely as the move up looks like a three wave move which indicates that it is corrective. It looks more like the correction extends a bit in the turquoise ABC a possibility we already mentioned yesterday.
We got the turquoise A in and the B was an overshooting Wave B and it seems we started working on the C Wave down. The targets for the turquoise Wave C are the 1 to 1 FIB at 116'164 USD, the 1.236 FIB at 115'753 USD, the 1.382 FIB at 115'499 USD which would also be in confluence with the 0.382 FIB of the Wave 4 support area and finally the 1.618 FIB at 115'088 USD which is right on top of the 0.5 FIB of the Wave 4 support area.
Keep in mind it still could be the bigger ABC displayed in red which would reset the green Wave 4 but we think the green count is more likely for now. First indication would be breaking the green Wave 4 support area.
Thanks for reading.
Would really recommend to check out the last analysis too for a better in depth view of the count and scenarios. :)
NO FINANCIAL ADVICE.