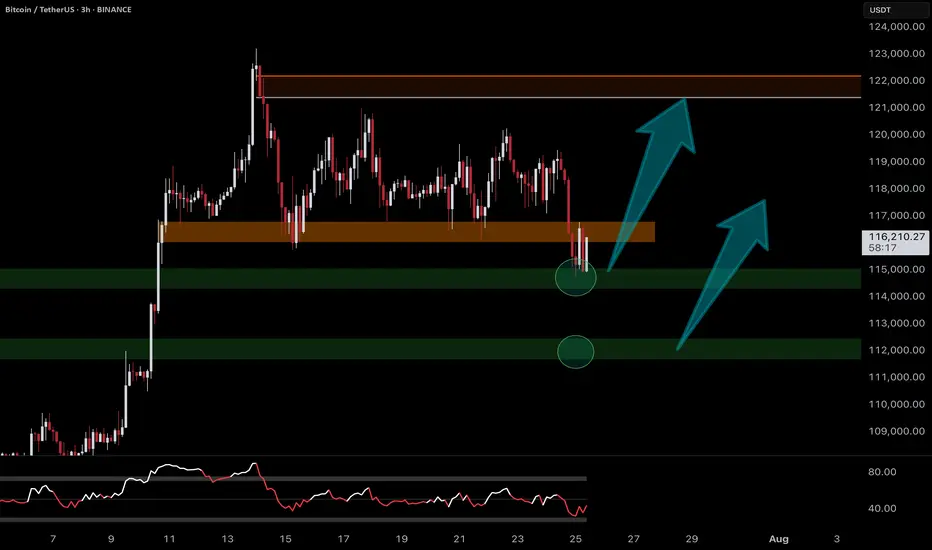
BTC/USDT Bull triangle still exists ? Hidden on fake camouflage?Bitcoin is moving sideways in a tight consolidation range between $117,000–$120,000 . Institutional players are accumulating positions here based on recent on-chain whale inflows, positive funding, and OI increase.
Key points with real chart zones:
The big drop down was likely a "fake out": Price wicked down to ~$115,000, triggering stop losses below this support, letting smart money buy cheaper.
Strong bounce back:
After the sweep, price quickly reclaimed the range, returning above ~$117,300–$118,000 , indicating strong buyer presence.
Bullish triangle is still valid:
Structure holds as long as price trades inside/bounces between $117,000 (lower zone/fake-out base) and $120,000 (upper resistance/consolidation top). Watch for volume spikes around $118,000–$120,000 as signs of institutional accumulation or breakout intent.
If price breaks above the range:
If we see a proper H1/H4 close above $120,000, expect a strong move to the next resistance: $123,000–$124,000 zone.
If price breaks down and holds below:
Sustained price action below $117,000, especially after another fake-out, could lead to a drop toward previous demand/stop zones at $115,000, and if that fails, further down to $110,000–$113,000.
Bottom line:
BTC sits in a “make-or-break” zone between $117,000–$120,000. Break out above $120k opens the path to $124k+. Loss of $117k/115k support risks further downside. Order flow and on-chain favor bulls for now, but always use stops – low volatility ranges can quickly resolve with liquidity grabs.
Tip:
Don’t chase every breakout or drop. Watch closely how price reacts near $120,000 (upside) and $117,000/$115,000 (downside). It is crucial to follow macroeconomic news, especially FED updates – trade safely and always do your own research!
This is not financial advice!
BTCUST trade ideas

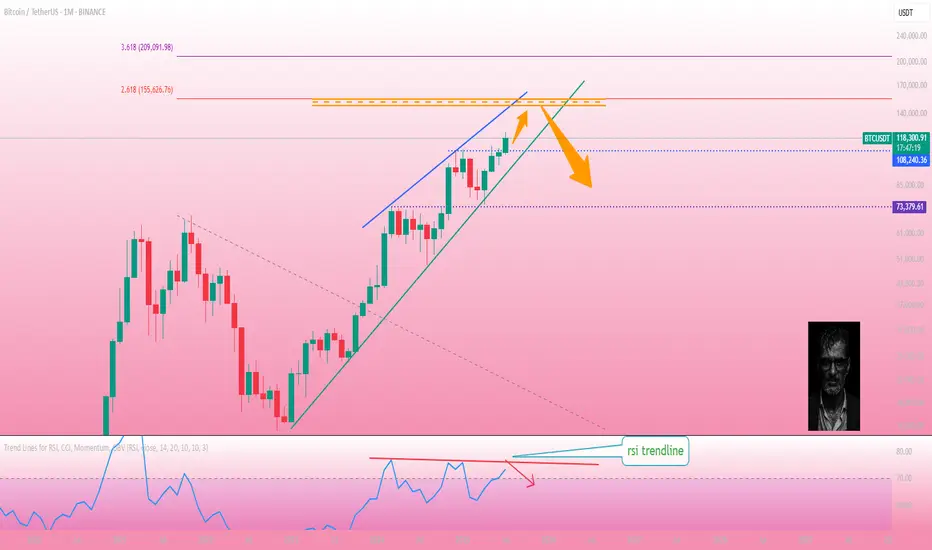
Bitcoin on a monthly time frameBitcoin on the monthly time frame.
If the monthly candle closes in this way, the price is expected to move to the 618 Fibonacci area. According to the trend line in RSI, we will enter a correction phase after the price rises.
Bullish Flag Forming on BTCUSDT – Is the Next Big Move Coming?🧠 Complete and Insightful Technical Analysis:
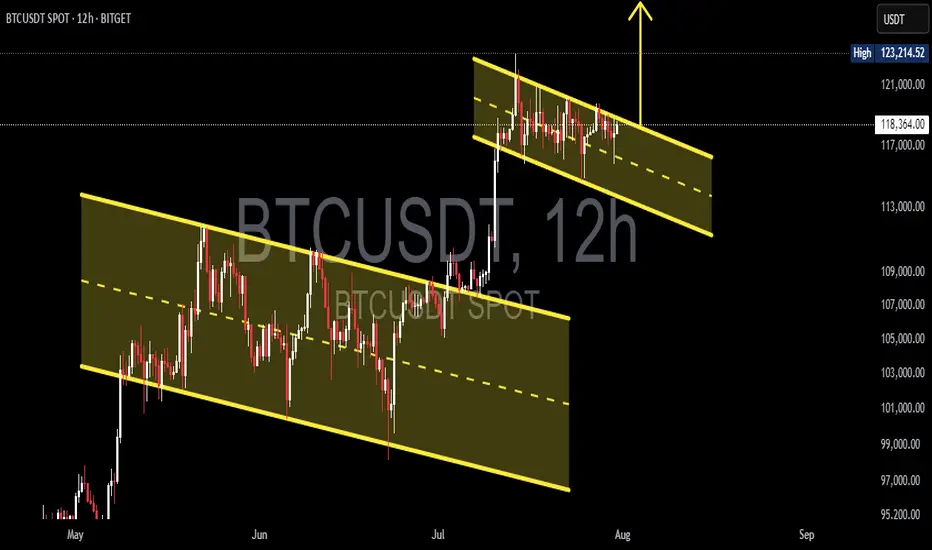
The 12H BTCUSDT chart is currently showcasing a textbook Bullish Flag pattern, a powerful continuation structure that often precedes major upward moves.
---
🏗️ Pattern Breakdown: Bullish Flag
1. Flagpole:
The sharp breakout from around $107,000 to $123,000 marks the impulsive rally — this is the flagpole, created by strong bullish momentum.
Represents the "lift-off" phase where buyers dominate the market.
2. Flag (Consolidation Phase):
After the strong rally, price consolidates inside a downward-sloping parallel channel, forming the flag.
This pullback is healthy, characterized by declining volume, a key feature of the Bullish Flag.
Indicates temporary profit-taking before continuation.
3. Confirmation:
A breakout above the flag's upper boundary (around $123,000 – $124,000) with strong volume would confirm the pattern.
Breakout traders often use this as a high-probability entry.
---
📈 Bullish Scenario (High Probability):
If BTC breaks above the flag structure:
🎯 Measured Move Target (Based on Flagpole Height):
$123,000 + ($123,000 - $107,000) = $139,000
🚀 Potential for further upside if macro conditions and sentiment support the move, possibly reaching $135,000+ in the medium term.
Confirmation Required: A strong candle close above $123,500 with volume spike.
---
📉 Bearish Scenario (If Breakdown Occurs):
If BTC breaks down below the flag (~$117,000):
Retracement likely toward previous breakout zones at $112,000 – $109,000
Such a breakdown could turn the current structure into a fakeout or bear trap
However, this zone may present a strong re-entry opportunity for long-term bulls.
---
📚 Educational Insight for Traders:
Bullish Flags often appear during strong uptrends, acting as a pause before the next leg up.
A healthy pattern shows shrinking volume during the flag and rising volume at breakout.
Traders should monitor key horizontal resistance and volume behavior for confirmation.
---
🧭 Conclusion:
BTCUSDT is at a critical technical juncture. The formation of a clean Bullish Flag suggests the potential for a major continuation rally. Confirmation through a breakout is key — this is the time to prepare, not react.
#BTCUSDT #Bitcoin #BullishFlag #BTCBreakout #CryptoTechnicalAnalysis #CryptoTrading #PriceAction #BTCAnalysis #BitcoinPattern #CryptoEducation #BTCFlag #ContinuationPattern
Bitcoin at a Decisive Moment! Rising Wedge Formed — Breakout?🧠 In-Depth Technical Analysis (BTCUSDT – Weekly Timeframe)
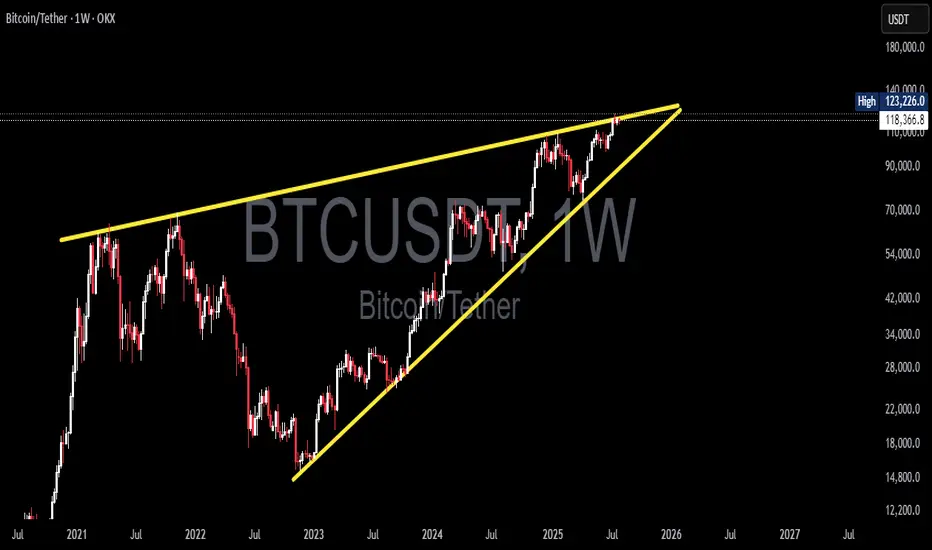
Bitcoin is currently trading within a large Rising Wedge pattern, formed over the long term from late 2022 to mid-2025. This structure is typically a bearish reversal formation, although it can also lead to a breakout in strong bull markets.
The wedge is defined by:
Consistently higher lows on the lower trendline
A gradually rising upper resistance line that currently caps price around $123K–$125K
Decreasing volume, indicating consolidation and energy buildup near the apex
This wedge reflects a period of euphoric price action post-2022 bear market accumulation, with price now testing the top of a historically significant resistance zone.
---
📊 Key Price Levels:
🔹 Current Price: ≈ $118,436
🔹 Recent Weekly High: $123,226
🔹 Critical Resistance (Wedge Top): $123,000–$125,000
🔹 Dynamic Support: Rising wedge base (~$90,000–$95,000)
---
🐂 Bullish Scenario: “Historic Breakout Incoming”
If BTC successfully breaks above the wedge’s upper resistance and closes a weekly candle above $125K with strong volume, it would signal a confirmed breakout from the long-term wedge structure.
📈 Upside Targets:
🎯 Target 1: $140,000
🎯 Target 2: $155,000+ (based on Fibonacci extension and macro targets)
🚀 A breakout of this magnitude may trigger a new parabolic rally, especially if accompanied by:
Increased institutional adoption
Spot ETF inflows
Favorable macroeconomic shifts (e.g., rate cuts)
---
🐻 Bearish Scenario: “False Breakout or Breakdown Risk”
If Bitcoin fails to break out and faces strong rejection from the resistance zone (possibly a false breakout), the rising wedge formation may break down — leading to a steep correction.
📉 A breakdown from this structure often leads to sharp drops due to:
Overextension of the current trend
Distribution phase by smart money
🎯 Downside Targets:
Support 1: $95,000–$90,000
Support 2: $76,000
Major Support: $54,000 (historical demand & EMA zones)
---
🔍 Optional Indicators for Chart Confirmation:
Weekly RSI: Watch for bearish divergence
Volume Profile: Can highlight distribution or accumulation zones
EMA 21/50: Ideal for identifying dynamic support levels in retracements
---
📌 Conclusion:
Bitcoin is at a crucial inflection point within this multi-year Rising Wedge. A confirmed breakout could lead to new all-time highs, while a breakdown may trigger a broad correction. Traders should prepare for high volatility, wait for clear confirmation signals, and manage risk wisely in this pivotal zone.
#Bitcoin #BTCUSDT #RisingWedge #BTCBreakout #TechnicalAnalysis #CryptoMarket #PriceAction #BearishReversal #CryptoSignal #ChartPattern #BitcoinAnalysis #Cryptocurrency
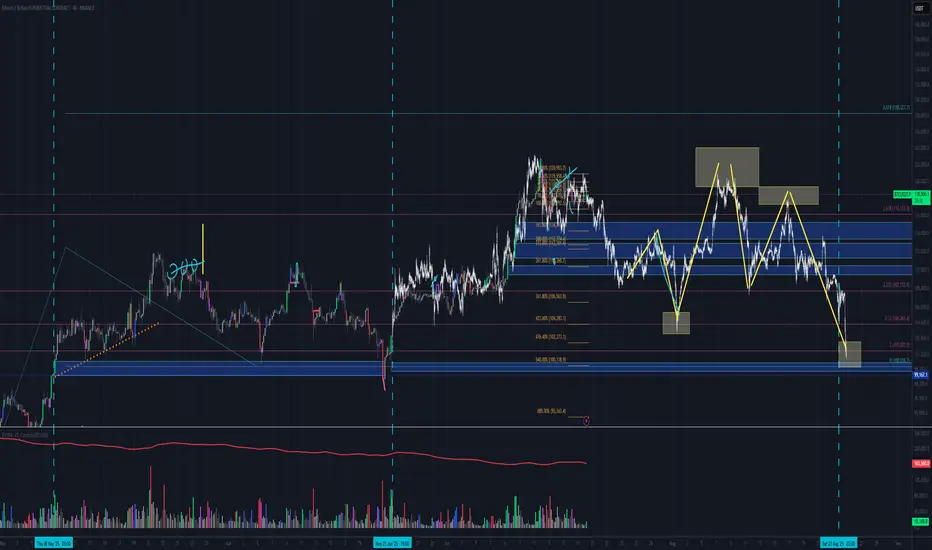
Will BTC ever reach 130k?Yes in your dreams, I am joking, it can but not now, blue shows what fall can trigger when massive selloff happens, and here it looks the smaller momentum to happen soon!

$BTC Retest Before Takeoff?Back on July 27, I shared a path 120K → 114K → 127K
Price has followed this playbook closely and now we’re at a critical zone again.
On daily timeframe, structure is still in an uptrend, but momentum is fading.
Price is consolidating between 119.9K–120.1K (Fib 61.8–65%) and 117.8K–116.6K (Fib 38.2–23.6%). MACD bearish crossover and histogram is still growing. RSI is neutral at 51 but definitely losing bullish energy.
If 117.8K breaks cleanly, we may revisit 114.7K (demand zone + full Fib retracement) before bulls reclaim control.
If we look at lower timeframe (4H). It is forming a tight range, but a lower high + weakening MACD suggests a bit more downside short term. Also, RSI at 46 confirms that consolidation with mild bearish tilt.
Key levels that I am currently looking are 118.8K–117.8K for the short-term intraday range play. And 116.6K & 114.7K for the support & potential bounce zone.
The scenario is still in play
- Rejection at 120K
- Retest 114K–116K zone
🚀 Then potential launch toward 127K (measured move + channel top)
Only a daily close above 120.1K with volume invalidates this retrace idea.
TL;DR
🟥 Resistance: 119.9K–120.1K
🟧 Neutral zone: 117.8K–118.9K
🟩 Support: 116.6K - 114.7K
🟦 Target: 127K if bulls reclaim the high ground
Still playing the patient game. Let’s see if 114K gets tagged one more time. What do you guys think?

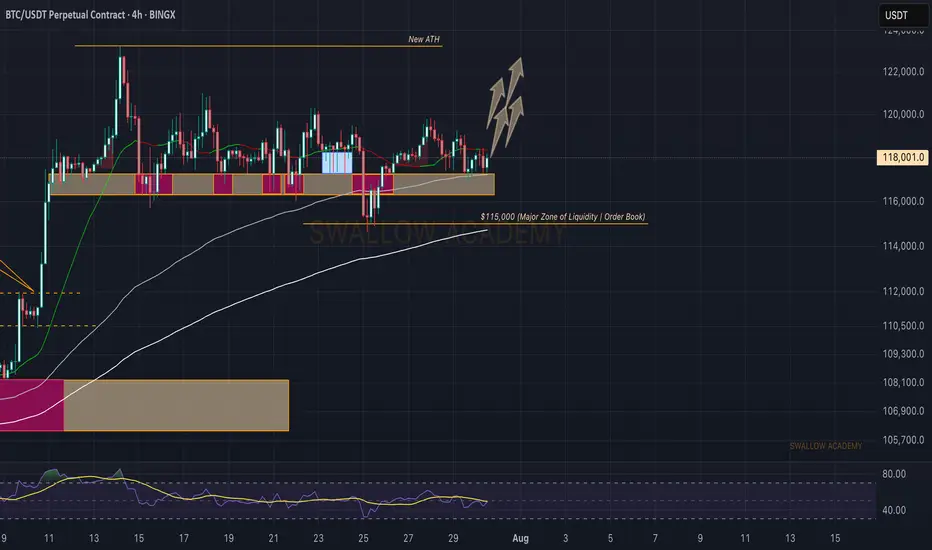
Bitcoin (BTC): Still Above Local SupportIt's been a choppy week so far but BTC is still above the local support zone, which means we are still bullish and the bullish sentiment has not disappeared (for now, at least).
We wait for and mostly keep an eye on that middle line of BB (Bollinger Bands) for now. The order book is our friend currently as well with all those liquidity hunts taking place!
Swallow Academy
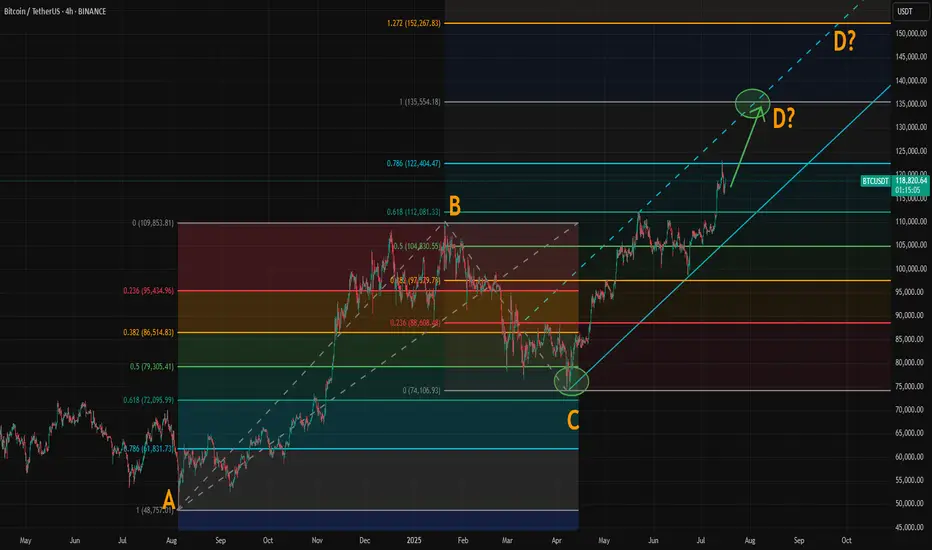
Where Could Bitcoin Make Its Cycle Top? Model and ABCD AlignedWith the breakout above resistance around 110,000, Bitcoin’s rally appears to be back on track. If you've been following our crypto analysis, either here or on our website, you’ll know our target range for this bull cycle is between 135,000 and 150,000, with the top of the range possibly extending further depending on the strength of the final wave.
Now, a possible ABCD pattern is forming, with point D potentially landing at either 135,000 or 150,000. A coincidence? Maybe, maybe not.
How Did We Arrive at the 135K–150K Target?
We based this range on historical halving cycle returns:
Halving Year - Return to Cycle Top
2012 - 9,076%
2016 - 2,122% (↓ 4.27x)
2020 - 541% (↓ 3.92x)
Two things stand out:
Each cycle has shown diminishing returns.
The rate of decline appears roughly consistent, dropping by around 4x each time—but slightly less with each cycle.
So depending on the multiplier used:
If returns fall by 4.27x again → target: 135K
If reduced by 4x → target: 140K
If reduced by 3.92x → target: 142K
If the rate of reduction itself slows (difference of 0.35 between 4.27 and 3.92) → target: 150K
While the sample size is too small, we believe the model holds reasonable logic with fundamental backing from various metrics.
The chart now shows a possible ABCD pattern:
If it becomes a classic AB = CD structure, point D could form near 135K.
If it becomes an extended ABCD (with CD = AB × 1.272), then point D could reach just above 150K.
These technical targets align closely with our halving model projections, increasing our confidence in the 135K–150K range as a likely top zone for this cycle.
Also, please check our earlier post for possible altseason start. A correlation between BTC/ETH and Gold/Silver might give some tips about possible Ether surge.
Bitcoin ready to fall?!??I think this is the best analysis that can be made of Bitcoin. I don't see any strength in its trend and I feel that it is going to correct to the specified areas, but our trend is completely bullish.

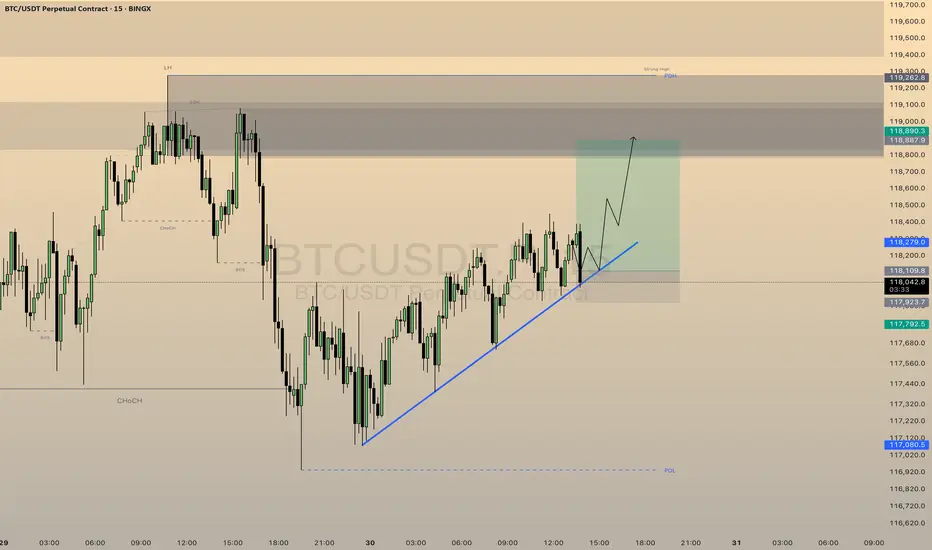
FUTURES SIGNALFUTURES SIGNAL
Coin: BTC
Direction: LONG
🟢Input range: 118109
✔️ТР: 118890
❌SL: 117923
We trade with the trend, stop at the minimums
BTC AI Prediction Dashboard - 6h Price Path (30.07.25)
Prediction made using Crypticorn AI Prediction Dashboard
Link in bio
BTCUSDT Forecast:
Crypticorn AI Prediction Dashboard Projects 6h Price Path (Forward-Only)
Forecast timestamp: ~10:45 UTC
Timeframe: 15m
Prediction horizon: 6 hours
Model output:
Central estimate (blue line): -118,306
Represents the AI’s best estimate of BTC’s near-term price direction.
80% confidence band (light blue): 118,086 – 118,670
The light blue zone marks the 80% confidence range — the most likely area for price to close
40% confidence band (dark blue): 117,520 – 119,603
The dark blue zone shows the narrower 40% confidence range, where price is expected to stay with higher concentration
Volume on signal bar: 80.50
This chart shows a short-term Bitcoin price forecast using AI-generated confidence zones.
Candlesticks reflect actual BTC/USDT price action in 15-minute intervals.
This helps visualize expected volatility and potential price zones in the short term.

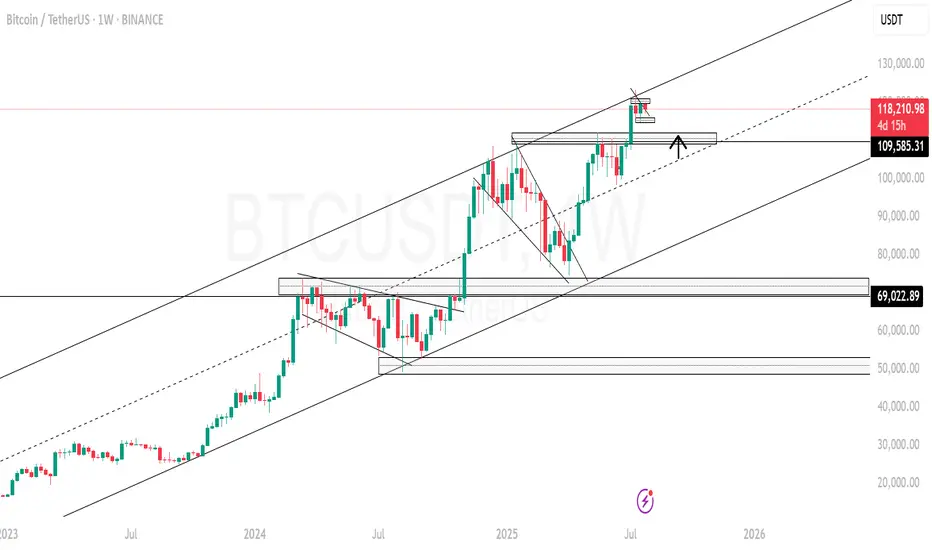
BTCUSD As I prepare for the continuation of the weekly Bitcoin bullish trend, I foresee a potential price retracement down to the 109k zone. This dip could offer a valuable opportunity for a robust bullish continuation, setting the stage for upward momentum in the market. The anticipation of this movement encourages a strategic approach, as we watch for signs of strength and confirmation in buying pressure. I'm preparing to capitalize on the ongoing weekly bullish trend in Bitcoin. I anticipate a price retracing to 109k zone, which could provide a strong opportunity for bullish continuation
BTC, ETH & Indexes daily analyze 🚀🔥 BTC, ETH & Indexes daily🔥🚀
💎 Daily Market Routine, Structure-Based Crypto Analysis & Watchlist Insights
💥 Like – Follow – Comment to keep this momentum alive!
👋 Hey everyone! Welcome to our daily crypto trading routine:
📅 Daily:
🔹 BTC & ETH analysis
🔹 Full market structure review (TOTAL, BTC.D, USDT.D…)
📅 Weekly (Every Sunday):
🔸 Top 10 Altcoins Analysis (excluding BTC & ETH)
🔸 🆕 Coming soon: Weekly Watchlist Picks!
💛 Your likes, follows, and comments give me the motivation to continue this journey and share deeper insights!
🟡 Methodology
💠 Long-Term Cycle (HWC): 1D timeframe
💠 Mid-Term Cycle (MWC): 4H timeframe
💠 Short-Term Cycle (LWC): 1H timeframe
💠 Market structure review:
TOTAL / TOTAL2 / TOTAL3 / BTC.D / USDT.D
💠 Technical approach: Dow Theory
💠 Fundamental events + news tracking
🔥 Today Could Be the Most Important Day of the Week!
📢 The Fed’s interest rate decision is expected today. Market consensus leans toward no change, but Powell’s press conference could trigger major volatility.
📈 If BTC starts a bullish trend in the coming days, ETH, BNB, and AVAX are likely to outperform – and this probability is high.
♦️ BTC/USDT – Market Still Ranging
💎 Bulls have failed to break above 120,000, but bears also haven't broken below the critical 115,000 zone.
📊 This two-week range is not surprising – it's likely a time correction, consolidation, or even distribution phase.
🚀 If 120K breaks with strong momentum and volume, price may rally to 123K → 135K → 150K.
❗ If 115K breaks, expect a drop to 110K → 100K.
⭕ Breakouts need strong candles and volume – otherwise expect fakeouts.
🟡 My strategy doesn't allow shorts at this phase. I only seek bullish confirmation – though bearish signs like buying exhaustion and profit-taking near 118K exist.
📌 I’ll re-enter long on breakout above 120K, using buy stops and proper risk control. Even if it hits my stop-loss later, I’m okay with that.
🔥 BTC must break 120K to unlock full altcoin rally potential.
♦️ BTC.D – Decision Time Nears
📉 Recent downtrend shows weakness, but not a bullish reversal yet.
🔸 Watch levels:
• 🟢 Break below 60.42 → Confirmed altcoin rally
• 🔴 Break above 62.17 → Likely altcoin crash
♦️ USDT.D – Position Before the Break!
🟡 We must take altcoin & BTC positions before USDT.D breaks 4.13.
⏳ A break there likely triggers a sharp upward move in alts.
• 🔹 Pullback to 4.64 = still bullish for alts
• 🔹 Current key zones:
• 4.44: Not tested yet
• 4.13: Likely to be retested
♦️ TOTAL Market Cap
💎 Break above 3.91T → Bullish confirmation – be in the market!
♦️ TOTAL2 (Altcoin Market Cap)
🟡 Major resistance ahead: 1.54T
♦️ TOTAL3 (Altcoin Market w/o BTC & ETH)
🟡 Important level: 1.08T
♦️ ETH/USDT – Institutions Are Accumulating!
💼 Institutional buying continues – a strong bullish signal.
💎 Buyers are trying to flip 3750 into support. Heavy order blocks detected.
📌 Key Level: 3900
• 🔹 Break & hold above = Easy ride toward 4000+
• 🔻 Bearish view: Break below 3750 = Drop to 3500–3600
🟡 Recent demand spike and fresh capital inflow = bullish sentiment
♦️ Strategic Outlook
1️⃣ Still focused on long setups
2️⃣ If BTC breaks 120K and ETH breaks 4K then ranges → and BTC.D drops = 🎉 Altcoin Party!
3️⃣ If BTC fails to break 120.3K, we won’t get a strong rally
4️⃣ If BTC keeps ranging and BTC.D keeps dropping → alts will gain, but not full bull run yet
💬 Drop your thoughts in the comments below!
🚀 Smash that ROCKET, hit LIKE, and don’t forget to FOLLOW for daily setups!
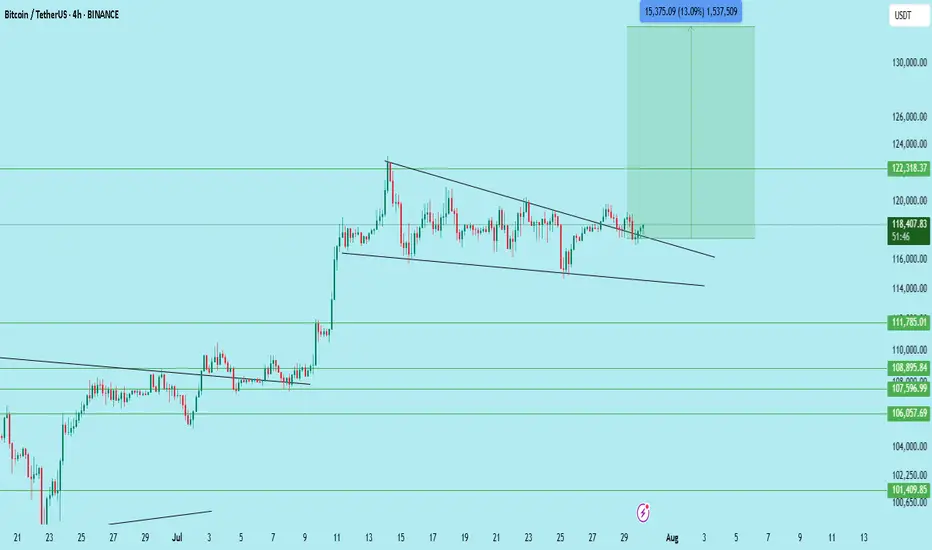
$BTC/USDT – Bull Flag Breakout on 4H | Targeting $133,700Bitcoin has just broken out of a well-defined bull flag structure on the 4H chart, signaling a potential continuation of the previous uptrend.
This breakout comes after a strong impulsive move upward, followed by a textbook flag consolidation with lower highs and lows forming a descending channel. The breakout above the flag resistance suggests a bullish continuation pattern is in play.
Technical Breakdown:
Pattern: Bull Flag (Continuation)
Flagpole base: ~106,700
Breakout zone: ~117,600
Retest Support: 116,000
Immediate Resistance: 122,300
Expected Target: 133,700 (based on flagpole projection)
Invalidation: Breakdown below 115,500
Expected Move:
Measured Move Target: ~13% upside from breakout
Confluence: Target aligns with past supply zone near 133K–135K
Price has also reclaimed the 50 EMA on the 4H chart, and the volume on the breakout shows bullish interest. Watching closely for a clean retest of the breakout zone for confirmation.
Conclusion:
BTC is showing bullish continuation after breaking out of a flag. A successful retest of 117.6K–116K range could offer further upside. Traders should manage risk accordingly.
DYOR | Not Financial Advice
BTC Long trade I'm taking a long position on BTC at 117,100, with a stop-loss at 116,800 and a target of 118,900. I'm taking this trade on the basis of technical analysis and price action.

Pattern detection bitcoinusing hourly btc analysis we can breakdown this move and its time cycles
pvsra volume threshold breaks indicating price instability allows us to break down these moves starting point
present
past pattern repeating
barpattern-overlay
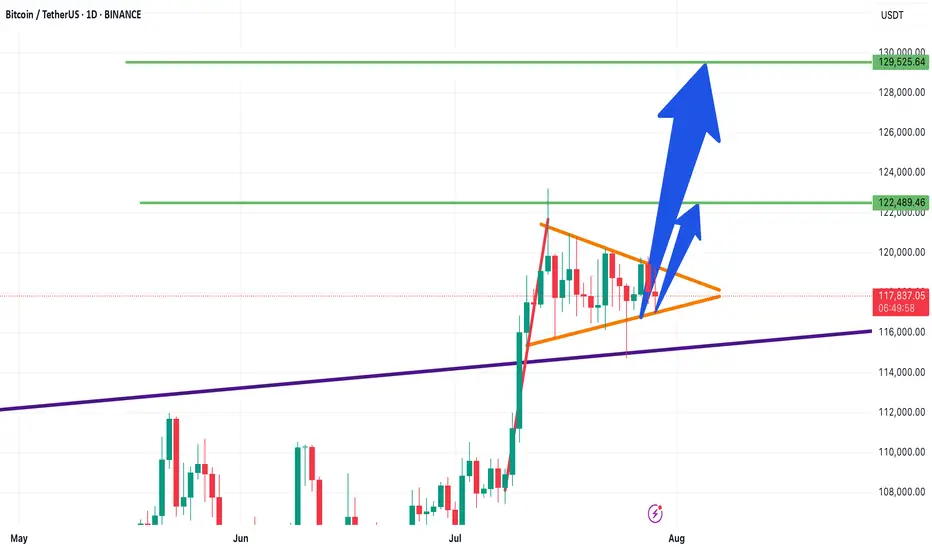
Bitcoin Technical Analysis – Bullish Flag- Symmetrical Triangle📊 Bitcoin Technical Analysis – Bullish Flag or Symmetrical Triangle?
📅 Analysis Date: July 29, 2025
As shown in the chart, Bitcoin appears to be forming a bullish flag or symmetrical triangle pattern—often seen after strong upward moves.
🔹 Bullish Scenario:
If the price breaks above the triangle, the first target is around $122,480, followed by a potential second target near $129,500, based on the length of the flagpole.
🔹 Bearish Scenario:
If the triangle breaks to the downside, the first support to watch is $115,230.
🧭 These key levels act as critical zones of supply and demand, so be sure to keep them on your chart!
🔥 Follow me for real-time setups, clear signals, and expert technical analysis!
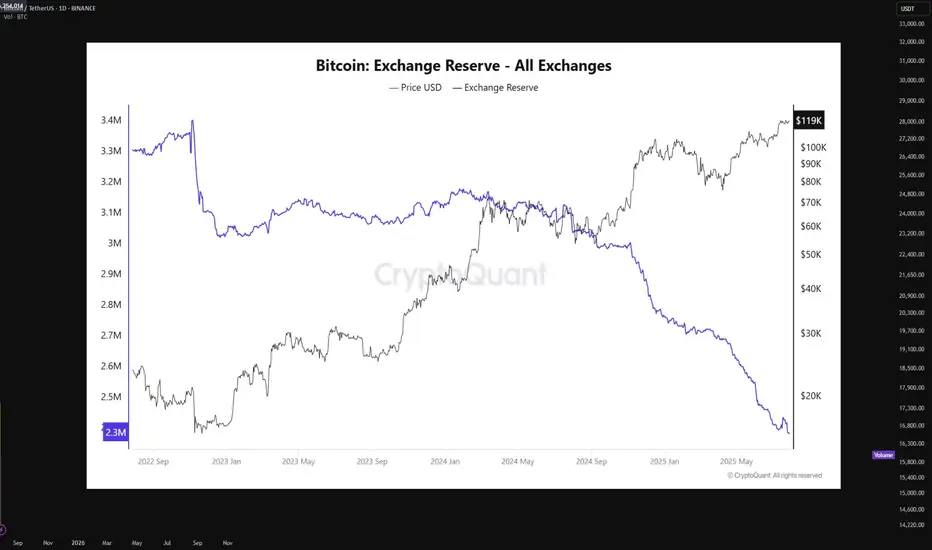
Bitcoin supply on exchanges is at an all-time lowBitcoin is currently undergoing a textbook supply-side shock, a rare phenomenon that historically precedes vertical price expansion. The latest on-chain data from CryptoQuant shows that BTC exchange reserves have declined to an all-time low of just 2.3 million BTC, down from approximately 3.3 million BTC in mid-2022. This marks a 27% drop in immediately sellable supply — a net outflow of over 900,000 BTC from centralized exchanges.
This trend signifies that a substantial portion of BTC holders have opted for long-term self-custody, indicating growing conviction among market participants. When coins leave exchanges, they are typically sent to cold wallets for long-term storage, effectively removing them from the liquid supply pool. This restricts the ability for large-volume sell orders to materialize, especially during rapid price appreciation, thereby creating a supply squeeze.
In parallel, the price of Bitcoin has risen steadily, now trading around $119,000, with a clear break above prior resistance clusters in the $75K–$85K zone. The price has shown strong momentum divergence against exchange reserves, with reserves falling while price rallies, a bullish continuation signal. This decoupling indicates aggressive spot accumulation in the background, often a signal of institutional or whale-level interest.
Technically, BTC is also showing signs of a parabolic structure forming, supported by rising volume on upward moves and decreasing volume on retracements — confirming bullish market structure. Price action has respected key Fibonacci levels throughout the rally, and is currently pressing into a price discovery phase with minimal historical resistance above.
The macro backdrop further supports this narrative. With Bitcoin ETFs now live and facilitating regulated inflows, capital has increasingly favored BTC as a store-of-value hedge amid fiat debasement and monetary policy uncertainty. Combined with the 2024 halving, which cut block rewards from 6.25 to 3.125 BTC per block, new supply issuance has halved, while demand remains elevated.
When supply dries up — as it clearly is — and demand persists or increases, price must equilibrate higher. This is a fundamental economic principle now playing out in real-time. The current environment mirrors late 2020 to early 2021, when a similar supply drop from exchanges preceded Bitcoin’s rally from $20K to $64K.
In summary, Bitcoin is entering a phase of constrained supply coupled with aggressive demand, pushing the asset toward price discovery territory. With on-chain reserves at historic lows, minimal overhead resistance, and strong macro alignment, the technicals now point to a structurally bullish setup.
If this trend persists, a sustained breakout beyond $120K could trigger a feedback loop of FOMO-driven spot bids, further deepening the supply shock and accelerating the next leg of the bull cycle.
BTC | Long | Target: + 121500This technical analysis is for informational and educational purposes only. It does not constitute financial advice. Remember to always research and consult with a professional before making investment decisions. Good luck! 📈💼🚀
BTCUSD : Key levelsI added meaningful levels to my past forecast (I can't add a link to my last forecast by the way, because as it turns out I have to actively participate in other people's discussions, which I am unlikely to do. And if I do, then to be able to add links to my predictions. So you have to check my prev forecast in the my profile overview).
So far, all levels are inactive except for the ~116,600 level. It's still in play.

Bitcoin Weekly Recap & Gameplan | 27.07.2025📈 Market Context:
Bitcoin maintained its bullish momentum, driven by continued institutional demand and a supportive U.S. policy backdrop.
Last week’s gameplan played out well — solid profits were captured (see linked chart below).
🧾 Weekly Recap:
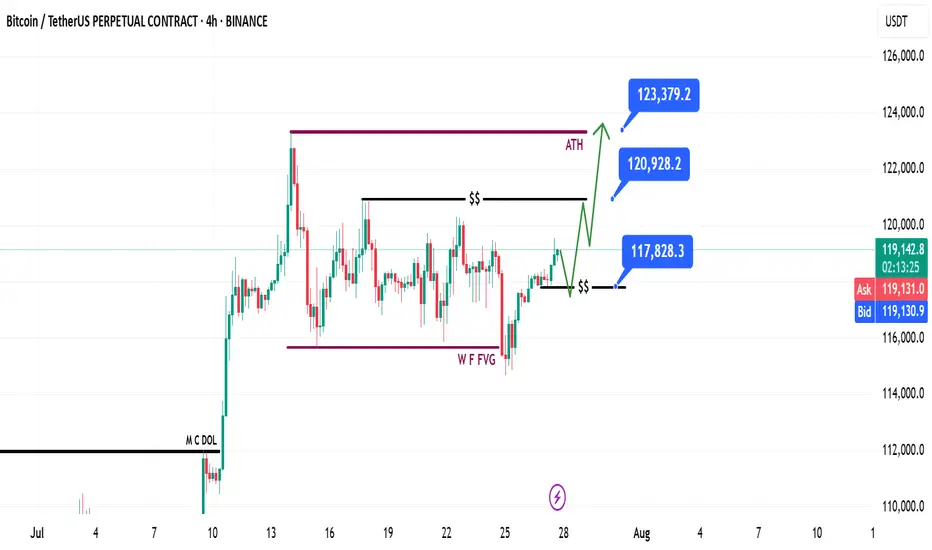
• Price made a bullish retracement into the Weekly FVG (purple line) exactly as projected in last week's post.
• From here, I expect continuation toward new all-time highs.
📌 Technical Outlook:
→ First, I expect a short retracement and a 4H swing liquidity grab at 117,828$.
→ Then, a strong continuation move toward ATH targets.
🎯 Setup Trigger:
Watch for:
✅ 4H liquidity sweep
✅ 15M–30M bullish break of structure (BOS)
This is the confirmation zone for potential long setups.
📋 Trade Management:
• Stoploss: Below confirmation swing low
• Targets:
– 120,938$
– 123,400$
💬 Like, follow, and drop a comment if this outlook helped — and stay tuned for more setups each week!
BTC/USDTWe are approaching the end of the Bitcoin bullish cycle, and the trend will change between $125k and $130k, and there will be a downward trend for several months.

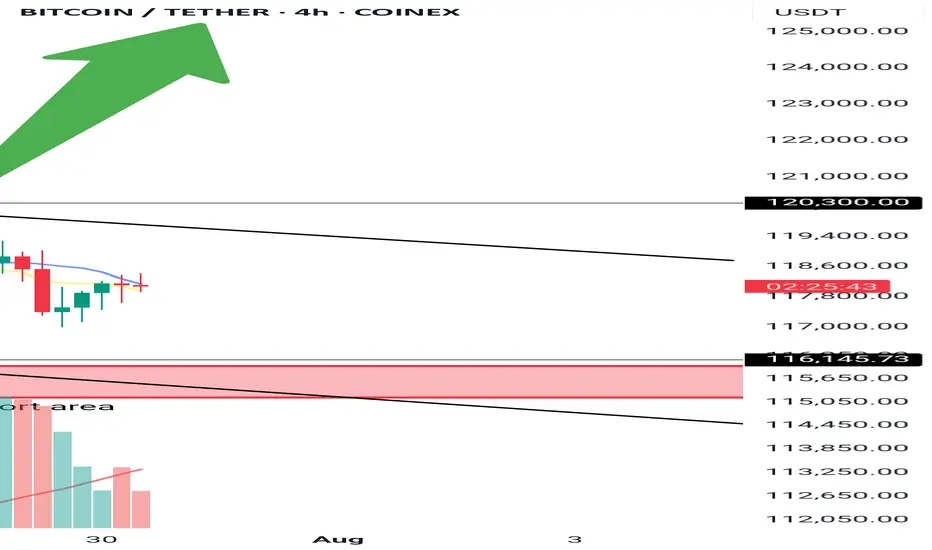
BTC poised to rise further! Market volume remains the problemBTC poised to rise further! Market volume remains the problem
From our chart we can see that BTC likes to make big corrections before moving higher. Over the weekend, BTC transformed from a bearish picture to a clear bullish triangle with a bullish breakout.
The prevailing trend should push BTC higher as shown in the chart, but again the problem is with the volume.
Suppose BTC has not accumulated enough volume during the development of the pattern. In that case, it is very likely that it will fall even further to develop an even larger pattern like the previous one that we can see at the end of the wave.
However, at the moment, BTC has a bullish pattern and the scenario could develop in the way shown in the chart. We cannot assume further transformations at the moment.
You may find more details in the chart!
Thank you and Good Luck!
PS: Please support with a like or comment if you find this analysis useful for your trading day
