Bitcoin can continue to decline and break support levelHello traders, I want share with you my opinion about Bitcoin. Following an earlier upward trend, bitcoin entered a prolonged phase of consolidation, forming a large upward pennant where price action was tightly contested between the seller zone near 117000 and an ascending support line. This period of balance, however, has recently resolved to the downside with a significant change in market structure. A decisive breakdown has occurred, with the price breaking below the pennant's long-standing support line, signaling that sellers have ultimately gained control. Currently, after the initial drop, the asset is undergoing a minor upward correction, which appears to be a classic retest of the broken structure from below. The primary working hypothesis is a brief scenario that anticipates this corrective rally will fail upon encountering resistance from the broken trendline. A confirmed rejection from this area would validate the bearish breakdown and likely initiate the next major impulsive leg downwards. The first objective for this move is the buyer zone around the 112000 support level, but given the significance of the pattern breakdown, a continuation of the fall is expected. Therefore, the ultimate target price for this scenario is placed at the 109,000 level, representing a logical measured move target following the resolution of the large consolidation pattern. Please share this idea with your friends and click Boost 🚀
Disclaimer: As part of ThinkMarkets’ Influencer Program, I am sponsored to share and publish their charts in my analysis.
BTCUST trade ideas

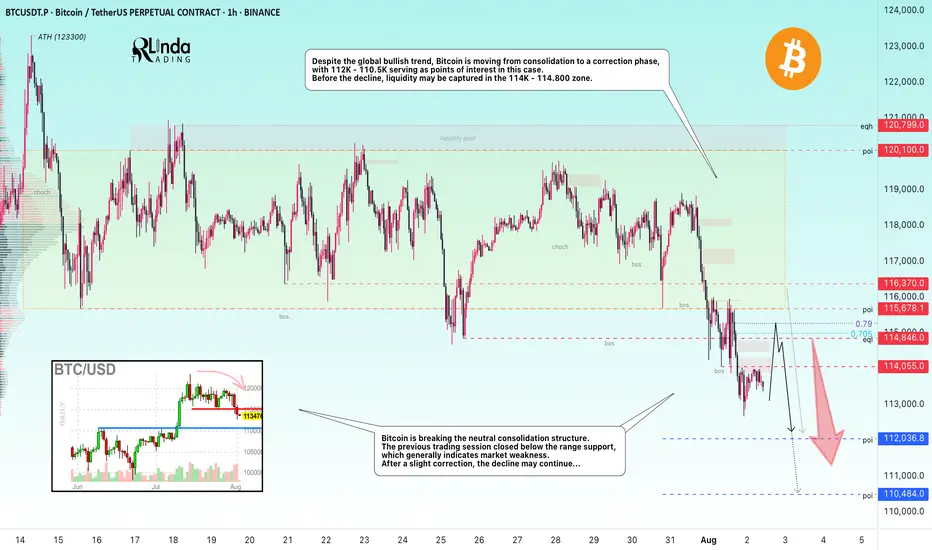
BITCOIN → From consolidation to distribution. Market weaknessBINANCE:BTCUSDT.P is moving from consolidation to a correction phase. The price broke through the support zone of 114.5–115.5, closing within the Friday trading session in the sell zone...
Previous idea from July 22: BITCOIN → Consolidation and compression to 116K. Correction?
The fundamental background is shifting to neutral, the hype has temporarily ended, and there are no bullish drivers yet. And for the health of the market, a correction is needed. Bitcoin is breaking the neutral consolidation structure. The previous trading session closed below the support range, which generally indicates market weakness. Despite the global bullish trend, Bitcoin is moving from consolidation to a correction phase, with 112K - 110.5K serving as points of interest in this case. Before the fall, liquidity may be captured in the 114K - 114.800 zone.
Resistance levels: 114.05, 114.85, 115.67
Support levels: 112.03, 110.48
After a strong movement, the market may enter a correction or local consolidation, during which it may test the specified resistance zones before continuing its downward movement to the zone of interest and liquidity at 112 - 110.5.
Best regards, R. Linda!
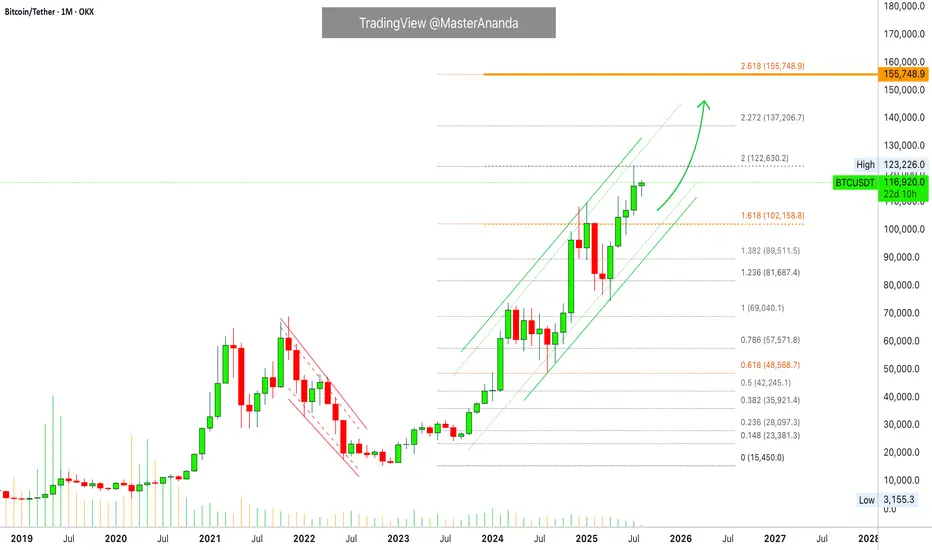
Bitcoin Monthly Update + Top Altcoins Choice, Your PickThis is a monthly Bitcoin chart and is really interesting, it supports without a shadow of doubt a strong continuation and bullish bias.
First, the month started red but is now green. This is always a strong signal when the action starts bad but recovers quickly during the month just to end up good. Starts red to end up closing green.
Bitcoin also closed four consecutive months green. This one will be the fifth month. Since the bears already gave everything trying to push prices lower and failed, we know higher prices are guaranteed next.
We also know this because Ethereum just hit its highest price since December 2021, near the top of the last bull market. Now we have Bitcoin, XRP and Ethereum, the top three Cryptos and the biggest projects, moving forward and doing great.
It is only natural. It is the logical sequence, the smaller pairs/projects will do the exact same.
Just as XRP gained in bullish momentum and hit a new all-time high, to follow Bitcoin, Ether did the same. Then we have Solana and Cardano, Dogecoin, Toncoin, Polkadot, Shiba Inu, Avalanche, Notcoin, Chainlink, Bitcoin Cash, Uniswap and the rest.
They are preparing to grow now and are bullish now. Ready to grow and strong.
No more retraces, no more corrections; the 2025 bull market wave & bull run is getting close.
The next immediate target is $137,206. Notice how the $122,630 target on this chart was hit perfectly. So these numbers are good and work long-term.
» After $137,206, Bitcoin is set to hit $155,000.
(Leave a comment with your Top Altcoins Choice, I will do an analysis for you!)
Thank you for reading.
Namaste.
BTC Once Bearish Momentum Continue AgainBitcoin is currently testing a key resistance zone where a large pool of liquidity has formed, indicating potential for strong price reactions.
On the daily chart (D1), BTC has recently broken through the 116K level, and a new descending trend line is developing. So far, the market has not yet retested the 110K zone, which is a critical support area.
In the short term, price may retest the resistance, which could trigger a downside move if rejected. A correction is expected if bullish momentum weakens.
Key support levels to watch:
1ST Support 112K
2ND Support 110K
You may find more details in the Chart.
Trade wisely Best of Luck Buddies.
Ps; Support with like and comments for better analysis Thanks.

Chart Patterns - How to read them like a ProChart patterns are visual formations on price charts that help traders anticipate potential market movements.
These patterns fall into three main categories: bullish , bearish , and indecisive .
---
1. Bullish Chart Patterns
Bullish patterns often signal that price is likely to move upward.
1.1 Bull Flag
* What it looks like: A sharp upward move followed by a small downward-sloping rectangle (the flag).
* Meaning: After a strong rally, the price consolidates briefly before continuing higher.
* Key insight: A breakout above the flag typically signals a continuation of the trend.
1.2 Pennant (Bullish)
* What it looks like: A strong upward move followed by a small symmetrical triangle.
* Meaning: Similar to the bull flag, but the consolidation takes a triangular form.
* Key insight: Once price breaks above the pennant, the uptrend often resumes.
1.3 Cup & Handle
* What it looks like: A “U”-shaped curve (the cup) followed by a small downward drift (the handle).
* Meaning: This pattern suggests a period of accumulation before price breaks higher.
* Key insight: A breakout above the handle signals the beginning of a new bullish leg.
1.4 Inverse Head & Shoulders
* What it looks like: Three low points, with the middle low being the deepest.
* Meaning: This reversal pattern appears after a downtrend and signals a potential change to an uptrend.
* Key insight: A breakout above the “neckline” confirms the reversal.
---
2. Indecisive Chart Patterns
These patterns show market hesitation, where neither bulls nor bears are clearly in control.
2.1 Consolidation Channel
* What it looks like: Price moves within a horizontal channel.
* Meaning: Market is moving sideways with no strong trend.
* Key insight: A breakout in either direction often leads to a significant move.
2.2 Symmetrical Triangle
* What it looks like: Two converging trend lines forming a triangle.
* Meaning: This is a neutral pattern that can break out in either direction.
* Key insight: Traders wait for a breakout before taking a position.
---
3. Bearish Chart Patterns
Bearish patterns signal a high probability of downward price movement.
3.1 Bear Flag
* What it looks like: A sharp decline followed by a small upward-sloping rectangle.
* Meaning: After a strong drop, price consolidates before continuing lower.
* Key insight: A breakout below the flag suggests a continuation of the downtrend.
3.2 Pennant (Bearish)
* What it looks like: A sharp downward move followed by a small symmetrical triangle.
* Meaning: Similar to the bear flag, but the consolidation takes a triangular form.
* Key insight: A breakout downward typically resumes the bearish trend.
3.3 Inverse Cup & Handle
* What it looks like: An upside-down cup with a small upward drift forming the handle.
* Meaning: Indicates weakness after an uptrend, often followed by a drop.
* Key insight: A break below the handle usually signals a strong bearish move.
3.4 Head & Shoulders
* What it looks like: Three peaks, with the middle one being the highest.
* Meaning: A classic reversal pattern that indicates a potential shift from an uptrend to a downtrend.
* Key insight: A break below the “neckline” confirms the bearish reversal.
---
How to Use These Patterns
* Combine pattern recognition with support/resistance, volume, and indicators for stronger confirmation.
* Always wait for breakouts and avoid acting too early.
* Manage risk with stop-loss orders.

BTC – Bullish Breakout in SightBTC – Bullish Breakout in Sight
Bitcoin recently completed a bullish harmonic pattern near 112K, and the reaction was strong—showing that buyers stepped in around that level.
In just two days, BTC climbed by about 3.5%, reaching 115.7K—and it did so with relatively low trading volume, which highlights quiet but steady buying interest.
Right now, price is pausing between 113.7K and 115.7K, forming a possible accumulation zone.
If momentum picks up again, BTC could launch another bullish move toward:
🔹 116.8K
🔹 119K
You may find more details in the chart!
Thank you and Good Luck!
PS: Please support with a like or comment if you find this analysis useful for your trading day

TradeCityPro | Bitcoin Daily Analysis #143👋 Welcome to TradeCity Pro!
Let’s dive into the Bitcoin analysis. Today, the weekly candle will close and the market will return to its normal condition starting tomorrow. It’s very important to have a solid analysis today so we can make profits in the upcoming week.
⏳ 4-Hour Timeframe
Yesterday, Bitcoin had another short drop and wicked down to around the 111747 zone, but then returned above the 0.618 Fibonacci level.
💥 Even from this timeframe, it’s clear that a long trigger has formed on lower timeframes, and it seems like a V-pattern is being formed, which we’ll analyze in the lower timeframes.
📊 If the market activates the long trigger today, I’ll try to enter so I don’t miss out in case a bullish move starts with the new weekly candle and I can have an open position.
✔️ The RSI oscillator also entered the oversold zone yesterday and exited it. Since Bitcoin is still above the 110000 zone, I still view the trend as bullish. So this double bottom that formed on the RSI is a very good sign for bullish momentum in the market.
⏳ 1-Hour Timeframe
In the 1-Hour timeframe, we had a short trigger at the 114560 zone in the previous analysis, which was activated and the price moved down. I had mentioned in that analysis that I wouldn’t open a short position with this trigger, and I didn’t.
🔽 Now the position of that trigger has shifted and moved to the 114028 zone. Today I’m watching the market closely, and if the price moves up toward this trigger with increasing volume, I’ll open a long position if 114028 breaks.
🔍 This is one of those positions where you can use either a small or large stop loss. If you go with a larger stop, you can ride the next bullish leg that may push the price back toward the 120000 zone. But if you go with a smaller stop, it becomes a short-term trade that will be closed with smaller risk-to-reward ratios.
📈 Personally, I prefer to go with a larger stop loss so that if Bitcoin starts another bullish leg, I can have a well-positioned entry. (Just make sure to practice proper risk management — I personally won’t risk more than 0.25% on this position since the main momentum hasn’t entered yet.)
💫 As for short positions, I won’t provide any triggers for now because I’m not opening shorts myself, and if you open one, I won’t be able to guide you on what to do with it.
❌ Disclaimer ❌
Trading futures is highly risky and dangerous. If you're not an expert, these triggers may not be suitable for you. You should first learn risk and capital management. You can also use the educational content from this channel.
Finally, these triggers reflect my personal opinions on price action, and the market may move completely against this analysis. So, do your own research before opening any position.

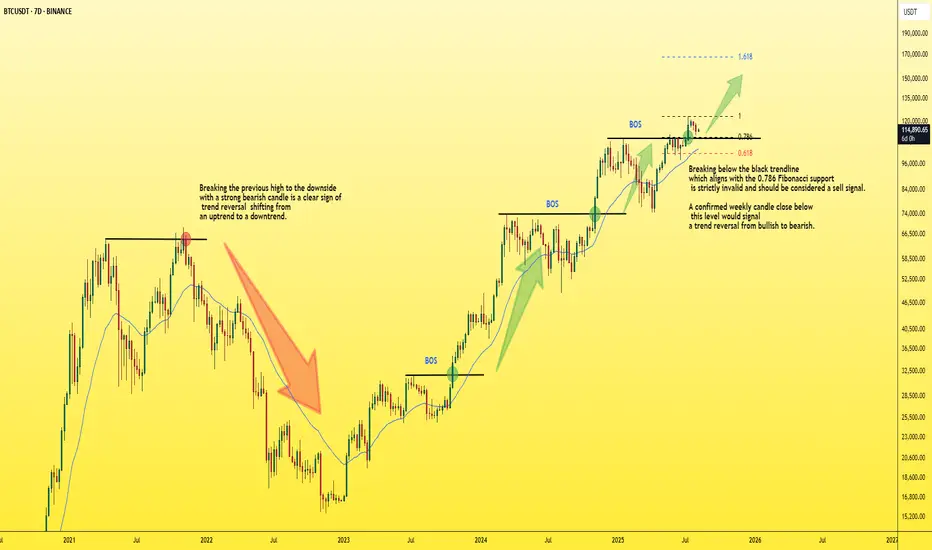
BTC - Key insight you must pay Attention to!📊 This is a weekly Bitcoin chart with a key insight you should pay close attention to:
In a bullish trend, you’ll always notice higher highs being formed. Once price breaks the previous high, it's typically a strong confirmation of bullish continuation, as shown by the BOS (Break of Structure) levels marked in blue on the chart.
🔻 The BOS level must not be broken to the downside — if that happens, it signals a trend reversal from bullish to bearish, just like what occurred at the red zone I highlighted.
✅ Currently, Bitcoin has broken its previous high to the upside, which indicates the bullish trend is continuing.
🎯 Next target: $150K.
⚠️ However, if BTC pulls back for a retest and fails to bounce quickly, it will be considered a strong sell signal. That would likely lead to a correction back down toward the $80K zone.
Best regards:
Ceciliones🎯
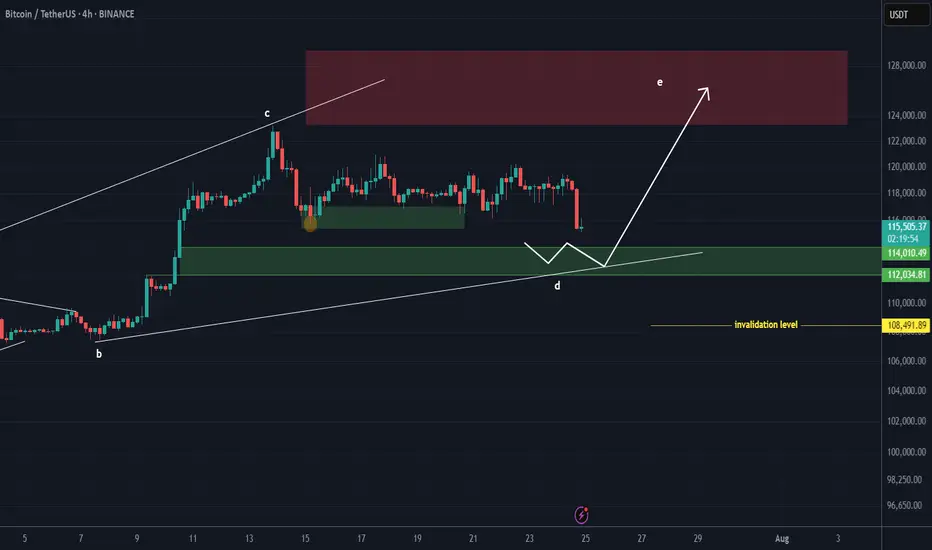
BITCOIN PREDICTION: THIS Breaks - and BTC WILL CRASH TO HERE!!!!Yello Paradisers! I’m sharing my Bitcoin prediction with you. We’re using technical analysis on TradingView, specifically Elliott Wave theory.
On the ultra-high time frame, we noticed a Shooting star candlestick pattern. We’re analyzing the channel where the zigzag formation is occurring.
We’re also looking at bearish divergence on the ultra-high time frame chart and the zigzag on the high time frame chart. There’s a bullish divergence visible there. The Fibonacci level at $108,000 is also noteworthy, as is the volume, which shows that bears are still in control on the medium timeframe. We’re also analyzing the head and shoulders target plus bearish divergence on the low time frame. On the low time frame, we’re looking at the impulse of the flat C, which is an expanded flat and is currently creating its fourth wave.
Remember, don’t trade without confirmations. Wait for them before creating a trade. Be disciplined, patient, and emotionally controlled. Only trade the highest probability setups with the greatest risk to reward ratio. This will ensure that you become a long-term profitable professional trader.
Don't be a gambler. Don't try to get rich quick. Make sure that your trading is professionally based on proper strategies and trade tactics.

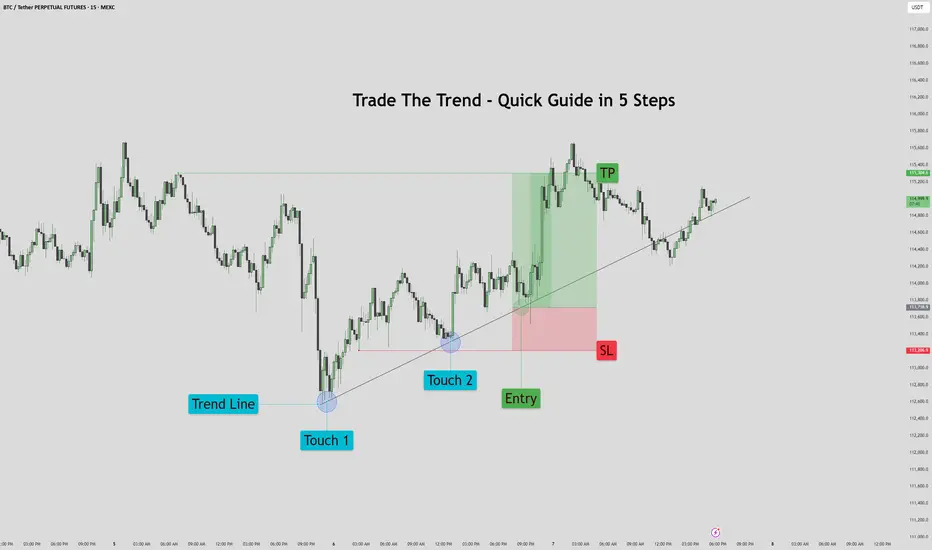
Trade The Trend – Quick Guide In 5 StepsWhat is Trading the Trend?
Trading the trend means buying when the market is going up, and selling when it’s going down.
You're following the direction of the market, not fighting it.
If the trend is up:
Price makes higher highs and higher lows
You look for chances to buy (go long)
If the trend is down:
Price makes lower highs and lower lows
You look for chances to sell (go short)
Why it works:
You’re going with momentum
Simple rule:
Buy in an uptrend, sell in a downtrend — never trade against the flow
1. Assess the chart. Where is it headed? It's headed up.
2. Place your trend line by connecting the first two points.
3. Let the chart play out for a bit. Afterwards prepare your entry on previous failed trend line retest. Set your stop loss below the previous trend line retest, and your TP just before the previous sweep above.
4. Proceed to let the chart play out, then set your pending order.
5. Watch the Trade enter and play out with patience.
This method works for bearish trends as well, just reversed.
If you would like to see more 5 step guides, comment down below.
Thank you!
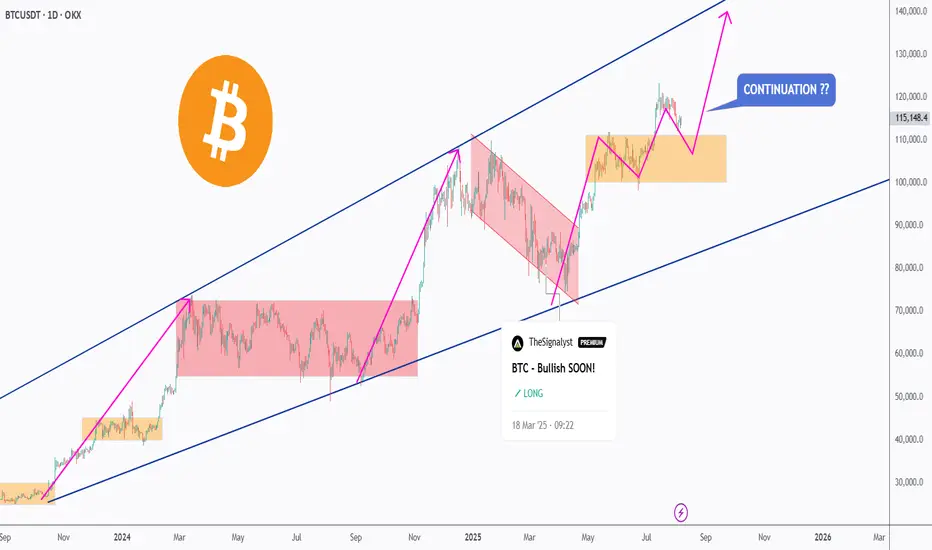
BTC Retest In Progress – Ready for Liftoff?🚀 Bitcoin has been respecting the long-term rising channel (blue) — moving in clear impulsive 📈 and corrective 📉 waves.
After each bullish leg (highlighted in pink), BTC dips into a correction (red), finds support at key demand zones 🟧, and then kicks off a new rally.
🔥 Currently, BTC is hovering near a strong demand zone around the $110,000–$113,000 area, forming a potential higher low within structure.
If this zone holds, the bulls 🐂 could regain control and push price toward the $130,000–$140,000 range — aligning with the upper boundary of the channel 📊.
💡 Continuation soon?
Let the market decide — we’re watching this zone closely for a bullish breakout confirmation ✅
💬 What’s your bias here? Are you bullish or waiting for a deeper pullback?
📚 Always follow your trading plan regarding entry, risk management, and trade management.
Good luck!
All Strategies Are Good; If Managed Properly!
~Richard Nasr
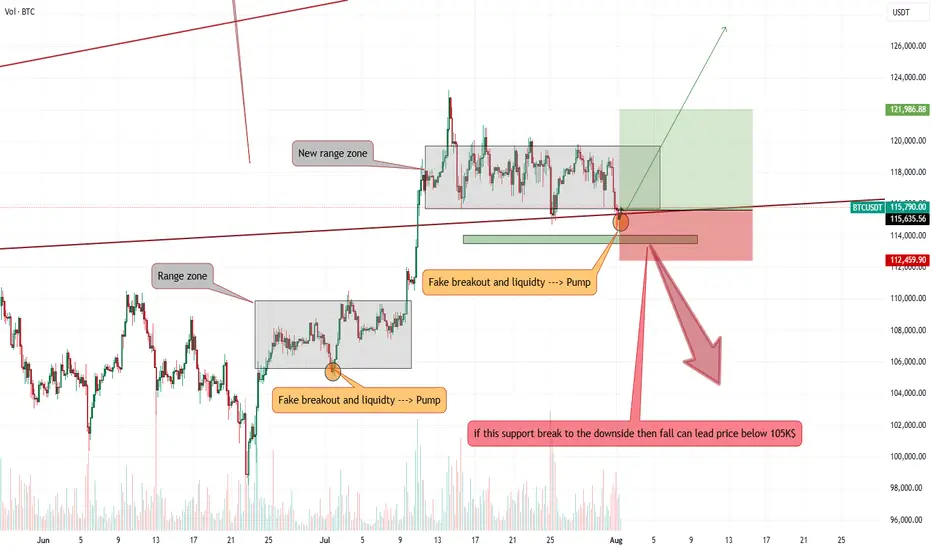
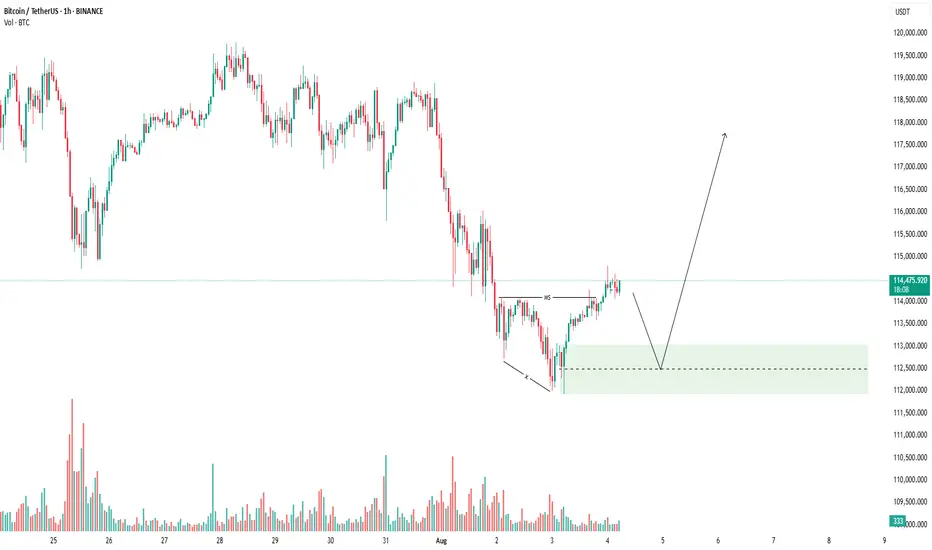
Bitcoin stop loss hunting end, entry for Long is now!!Hi on this chart that may happen with more than 70% possibility we have one of the easy setups and strategy which i call it FAKEOUT&LIQUIDTY this happen usually near trendline support or range zone support or even resistance and after a possible fakeout usually market kick sellers or Buyers and then with high volume market reverse.
I saw High volume and Fake breakout in my mind and i think it can be one of those times so we open long and lets now wait for this 1:2(Risk:Reward) signal to play.
DISCLAIMER: ((trade based on your own decision))
<<press like👍 if you enjoy💚
BTC - Short Trade / Crash Update and DetailsPer my previous post here are the details on my personal trade. Note this is NOT financial advice, and this is my own personal trading plan only. Please use your own judgement.
Entry - 116,300 to 116,600
Stop Loss - 121,800
Target 1 - 95,700
Target 2 - 61,500
Target 3 - 35,000
Target 4 - 8,000
Note that Bitcoin should move up from the 35,000 target to 88,000 making a corrective wave on HTF.
At this point I will post an update and advise my own strategy and if I long 35,000 to 88,000.
Happy trading

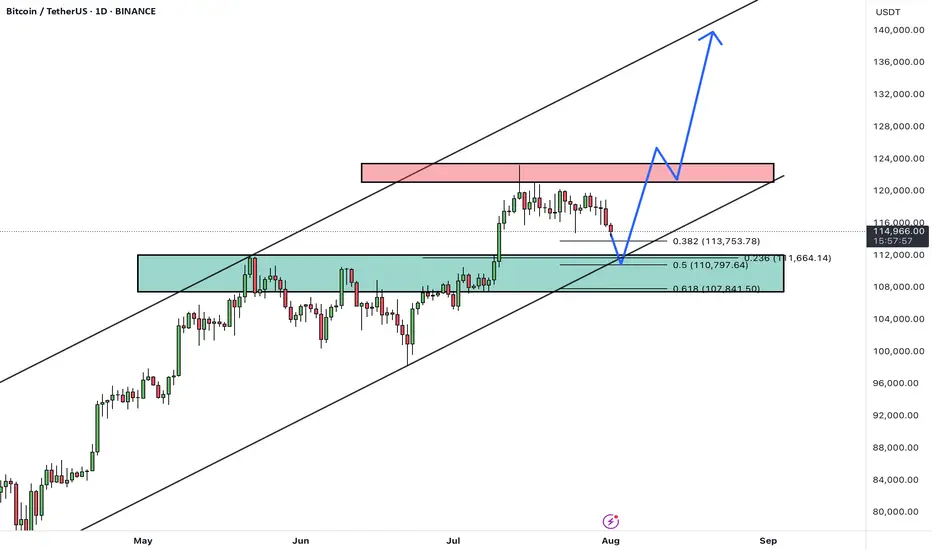
BTCUSDTHello Traders! 👋
What are your thoughts on BITCOIN?
After a strong rally, BTC is currently pulling back from the 124K resistance area, heading toward a major confluence support zone between 108,000– 110,000, which aligns with:
✅ Previous breakout zone
✅ 0.5–0.618 Fibonacci retracement
✅ Lower bound of the ascending channel
This level is expected to attract buyers and act as a base for a new bullish leg.
Scenario Ahead (Main Bias):
1. Price dips into the 108–110K support
2. Bullish reversal from the zone (watch for strong reaction candles or bullish divergence)
3. Target 1: 124K (retest resistance)
4. Target 2: 135K–140K (upper channel boundary upon breakout)
BTC remains in a healthy bullish structure. Current pullback is considered constructive, and the 107–110K zone offers a high-probability long setup. Watch for bullish signals before entering.
A confirmed daily close below 107K would invalidate this bullish structure and expose BTC to deeper correction levels.
What’s your take on this setup? Do you expect a bounce from support or a deeper correction? Share your thoughts below 👇
Don’t forget to like and share your thoughts in the comments! ❤️
BTCUSDT- End of the Rally or Start of a Crash?On the BTCUSDT chart, it appears that the fifth wave of the impulsive structure is nearing completion. The wave count clearly shows a full five-wave sequence, suggesting that Bitcoin may be forming a major top around the $119,000–$125,000 resistance zone.
If price action confirms a reversal and breaks key support levels, we could see a deep correction potentially taking BTC below $90,000.
Keep in mind this is a scenario based on wave structure and requires confirmation via breakdowns and price action.
What do you think? Is Bitcoin ready for a major correction, or will it break into new all-time highs?

BTCUSDT: Good Opportunity to buy Bitcoin has dropped sharply since NFP data came out. We can now see price reversing nicely from 109k area.

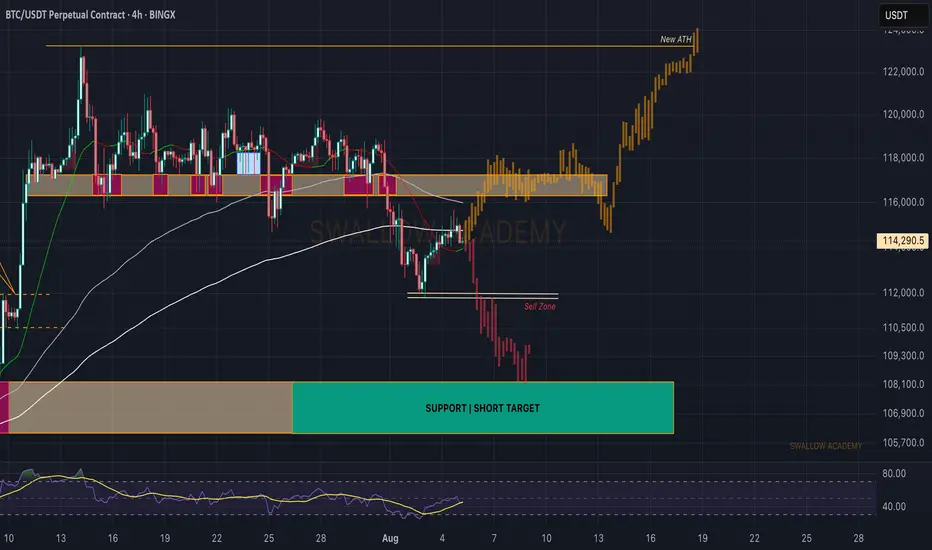
Bitcoin (BTC): Either $108K or Back Above $117KBTC is in a volatile position, where purely on a chart we can't really tell whether we might be heading up or down from here.
What we noticed, though, is the order books orders near lower zones, where buyers have set few buys, possibly hinting to potential bullish movement to happen.
So what to keep in mind here?
1) Keep an eye on that bearish CME gap, which might be filled and marked as smaller target for short
2) Before we see either a breakout from the 117K area or a breakdown from the $108K zone, we should not enter into any early trades here on the current timeframe.
Swallow Academy
BTC New Upodate (4H)This analysis is an update of the analysis you see in the "Related publications" section
We previously stated that Bitcoin lacks the strength to move upward, and we expect the price to soon reach the green zone (114K-112K).
The price is now dropping toward this zone, which is the rebuy area.
The process of reaching the green zone has been and still is somewhat time-consuming, and during this time, it may repeatedly mislead beginners.
For risk management, please don't forget stop loss and capital management
Comment if you have any questions
Thank You
The key is whether it can rise above 115854.56
Hello, traders!
Follow us to get the latest information quickly.
Have a great day.
-------------------------------------
(BTCUSDT 1W chart)
The key is whether it can rise above the newly created DOM (60) indicator point of 119086.64.
If this fails and the price declines, we need to check for support near the previous all-time high (ATH) of 108,353.0.
Since the M-Signal indicator on the 1W chart is rising near 108,353.0, this area is expected to serve as important support and resistance.
-
(1D chart)
This period of volatility is expected to continue until August 6th.
Therefore, the key question is whether the price can rise above 115,854.56 and maintain its upward momentum.
If not, further declines are likely.
-
To rise above 115,856.56,
- The StochRSI indicator must rise within the oversold zone and remain above K > D.
- The On-Bottom Volume indicator must continue its upward trend with OBV > OBVEMA. - The TC (Trend Check) indicator should maintain an upward trend. (If possible, it's best to rise above the 0 point.)
If the above conditions are met and the price rises above 115854.56, it is expected to attempt to rise above 119177.56.
This period of volatility is a significant period of volatility.
Therefore, if the price falls below the HA-High ~ DOM(60) range and encounters resistance during this period, you should prepare for further declines.
-
The basic trading strategy is to buy in the DOM(-60) ~ HA-Low range and sell in the HA-High ~ DOM(60) range.
However, if the price rises in the HA-High ~ DOM(60) range, a stepwise upward trend is likely, while a decline in the DOM(-60) ~ HA-Low range is likely to result in a stepwise downward trend.
Therefore, a split trading strategy is recommended as the basic trading strategy.
When executing a trade, appropriate profit taking secures the liquidity of your investment, giving you the opportunity to seize new opportunities.
To achieve this, you should consider your intended investment horizon before initiating the trade and divide the trade accordingly.
-
The HA-Low indicator on the 1D chart is currently at 89294.25.
Therefore, I believe the market believes it's in a position to take profit.
-
Thank you for reading to the end.
I wish you successful trading.
--------------------------------------------------
- This is an explanation of the big picture.
(3-year bull market, 1-year bear market pattern)
I will explain in more detail when the bear market begins.
------------------------------------------------------

BITCOIN BTCUSDT BUYING SETUPBitcoin is currently showing bullish momentum after a clear market structure (MS) shift. The price has formed a bullish reversal and is now retracing after a short-term rally.
We expect BTCUSDT to pull back into the highlighted demand zone (green area), which aligns with previous structure and volume support. If the price taps this zone and shows bullish confirmation, it could present a high-probability buy entry for the next upward leg.
📌 Trade Plan:
✅ Wait for price to enter the green zone
✅ Look for bullish price action or volume confirmation
✅ Target higher highs if support holds
Always manage your risk properly and wait for clear confirmation!
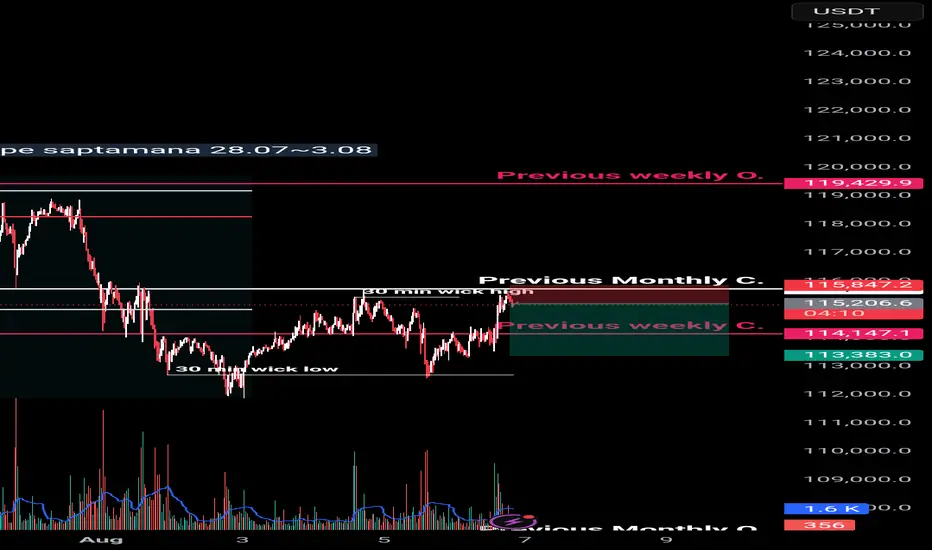
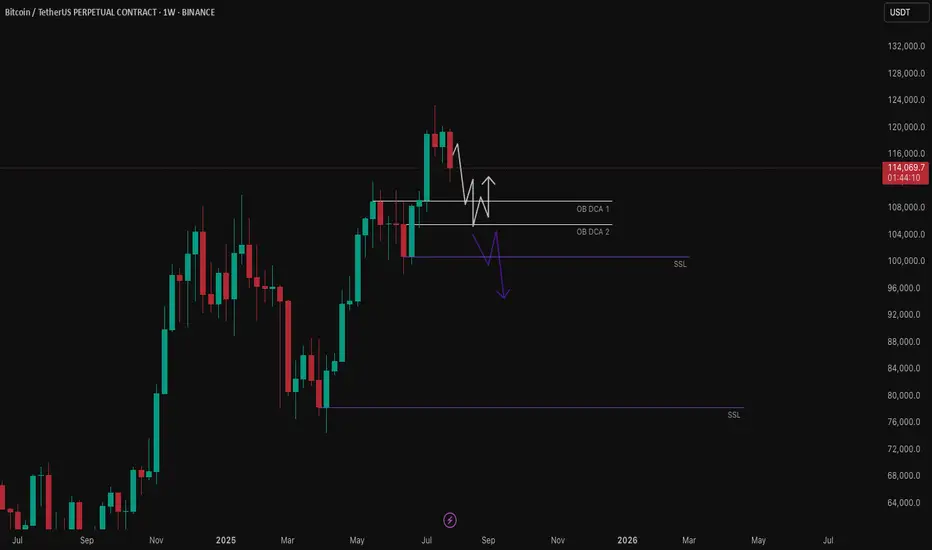
Aug 4, 2025 -- BTCUSDT.PMarket can go to test the weekly Orderblock. If that OB breaks, we are in a reversal and market is more likely to run the HTF SSL. If it runs away from the OB and shows us the first sign of expansion, we can target BSL and beyond.
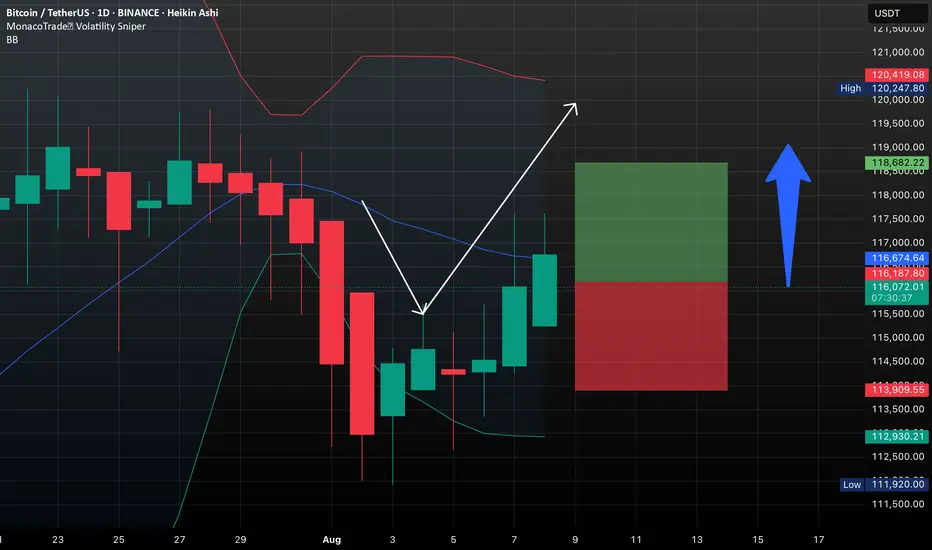
BTC/USDT: Key Levels to Watch Now!Bitcoin remains in a macro bullish structure, but recent price action shows consolidation after breaking through major resistance levels earlier this month. Similar to previous cycles, BTC tends to form short-term ranges after strong rallies before deciding the next move.
Currently, BTC is trading near $116,500–$117,000, just above a key support zone from $115,200 to $114,500. This area aligns with previous breakout levels and the 20 EMA on the 4H chart, making it critical for the short-term trend.
*Bullish Scenario: Holding above $115,200 and breaking $118,600 with strong buying volume could push BTC toward $120,500–$122,000 within days.
*Bearish Scenario: A close below $114,500 could trigger a correction toward $112,800–$111,900. Losing this level may extend the retracement to $110,200 (major demand zone).
Summary:
BTC is consolidating near key support. Past scenarios suggest a breakout above $118,600 could fuel the next bullish leg, but losing $114,500 risks a deeper pullback toward $112,800. The next 2–4 days should define short-term direction.