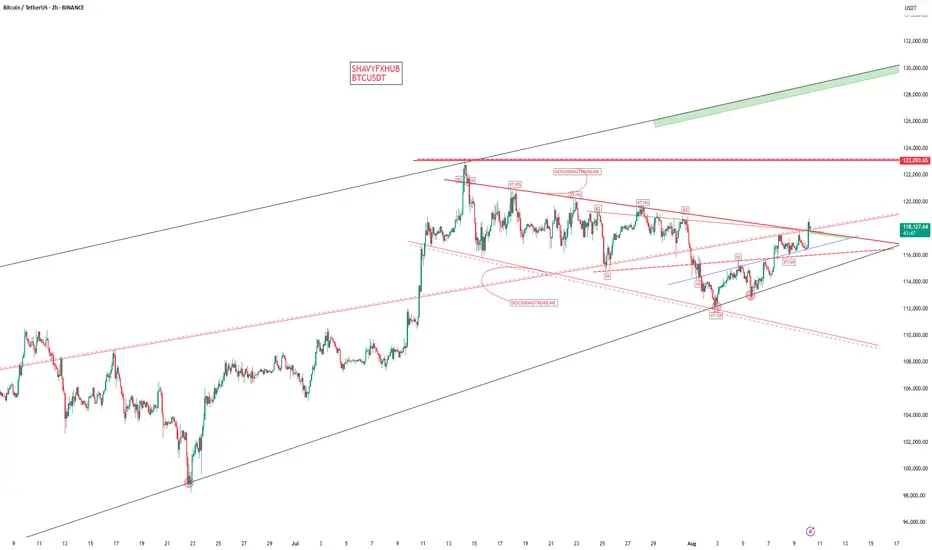
BITCOINBITCOIN ,THE STRUCTURE ON 4HR provided an ascending trendline and we have seen buyers keeping that dynamic support for buy .
we will monitor the current supply roof breakout for better buy confirmation after seeing a 2hr ascending trendline cross providing a support that took us to 118k if correction into 116-117k hold and the broken supply becomes demand than 123k all time high retest is on the desk.
trading is 100% probability.
manage your risk.
#btcusdt #bitcoin #tbc #crypto
BTCUST trade ideas
BITCOIN BTC BITCOIN ,THE STRUCTURE ON 4HR provided an ascending trendline and we have seen buyers keeping that dynamic support for buy .
we will monitor the current supply roof breakout for better buy confirmation after seeing a 2hr ascending trendline cross providing a support that took us to 118k if correction into 116-117k hold and the broken supply becomes demand than 123k all time high retest is on the desk.
trading is 100% probability.
manage your risk.
#btcusdt #bitcoin #tbc #crypto

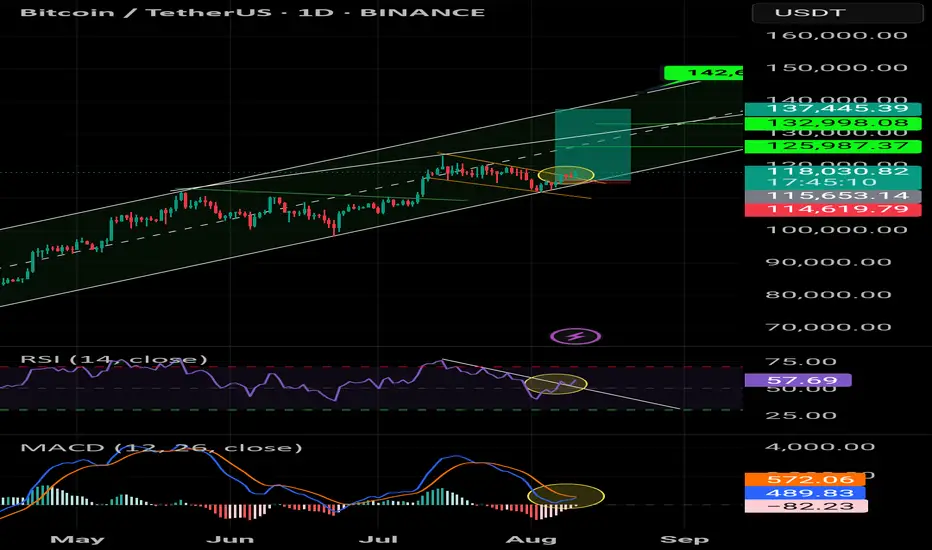
Bitcoin Go 133300On the daily time frame, three bullish charts indicate another bullish move and another high.
Tp1:125800
Tp2:128000
Tp3:130000
Tp4:133000
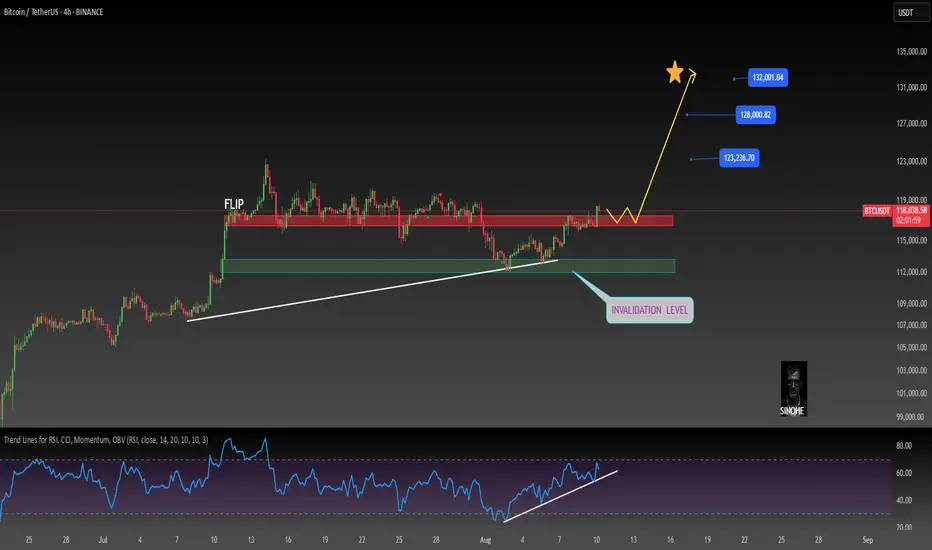
Bitcoin is super bullish (4H)This analysis is an update of the analysis you see in the "Related publications" section
If you’ve been following our previous analyses, we had a bullish outlook on Bitcoin from the lower green zone.
An important level on the Bitcoin chart has been reclaimed, and it is expected to move toward the next targets if it consolidates above the red box.
The targets are marked on the chart.
A daily candle closing below the invalidation level will nullify this analysis.
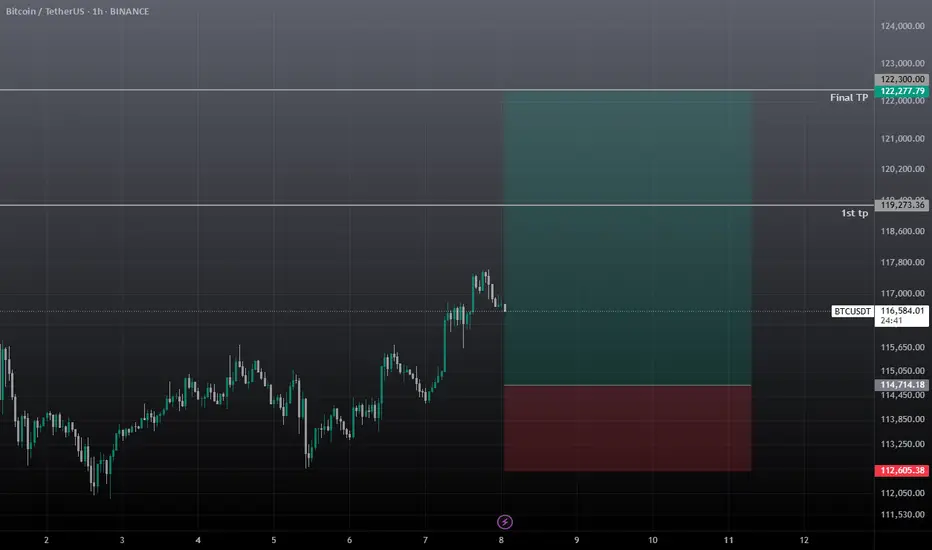
BTCBitcoin in bull-trend so entry in any correction.
EN: 117.300
SL:115.790
TP: 119.000 - 121.000 - 122.777
please control risk management
BTCUSDT — D1 Bottom Still Not Complete?BTCUSDT — D1 Bottom Still Not Complete?
The market’s process works with precision. Not yet means exactly that — even if price pushes higher, it will eventually return to complete the bottom formation.
On the D1 timeframe, BTCUSDT began forming its bottom on July 24, 2025 at $118,300.
On the W timeframe, BTCUSDT started its upward leg on May 12, 2025 (W’s third peak).
On the M timeframe, BTCUSDT began its upward leg on October 1, 2023 and is now in the process of forming a top before a potential decline.
Our strategy is patience: let BTC complete this final D1 peak.
Potential long entries:
Around $115,500
Or when BTCUSDT officially completes its D1 bottom formation — at which point we can also long altcoins to ride the next wave of capital inflow.
5 RRThis may be a very Nice trade on bitcoin! It looks like it is still trying to reach higher in the short term.

BTCUSDTBTC/USDT Price Chart Analysis
1. Chart Type and Instrument
The provided chart is a line chart that displays the price movement of the BTC/USDT instrument on the Binance exchange. The timeframe used is daily (1D), covering the period from approximately October of the previous year to August of the current year.
2. General Trend
Overall, the BTC/USDT chart shows a very strong and sustained upward trend (uptrend) throughout the displayed period.
* Phase 1 (October 2024 - March 2025): A significant uptrend occurred, with the price of Bitcoin rising from below $60,000 to reach its peak at around $120,000. During this period, there were phases of correction and consolidation (e.g., around March), but the main trend remained upward.
* Phase 2 (April 2025 - August 2025): After the correction in March-April, the price resumed its upward trend. This rally brought the price back to the area of the previous peak.
3. Significant Support and Resistance Levels
* Support: Significant support levels can be identified in a few areas:
* Short-Term Support: The psychological level around $110,000, which served as a consolidation area before the price continued its climb.
* Mid-Term Support: The level around $100,000, which previously acted as resistance and now has the potential to become strong support.
* Long-Term Support: The area around $80,000, which was the base for the price recovery from the April correction.
* Resistance: The most crucial resistance level right now is the area around $120,000. The current price, $116,822.78, is attempting to approach and break through this resistance level. This level represents the all-time high (ATH) or a new historical peak.
4. Important Price Patterns or Formations
The chart shows a repeating pattern of price increases, where a strong upward movement is followed by a correction or consolidation, before continuing the rally. The most relevant event currently is that Bitcoin's price is retesting its historical peak level around $120,000. This movement indicates very strong bullish momentum.
5. Technical Indicators
Although the chart is not equipped with technical indicators, the price action itself provides a clear signal. The price is currently trading near its historical peak, which shows buyer dominance.
6. Specific Reasons for Entry
The BTC/USDT chart is at a critical juncture, attempting to break through the historical resistance level of approximately $120,000. There are two primary scenarios for an entry decision:
* Scenario 1 (Confirmed Breakout - Bullish Entry): The reason to enter a long position is to wait for a valid breakout confirmation. If the price successfully breaks and holds (closes a daily candle) above the $120,000 level, this could be a very strong signal that the uptrend will continue to higher levels. This breakout would indicate that buying pressure is strong enough to overcome selling pressure at the resistance level, opening the way for a significant price increase.
* Scenario 2 (Pullback - Safer Bullish Entry): Another option is to wait for the price to undergo a correction or a pullback to the nearest support level, for example, around $110,000 or $100,000. If these levels successfully hold the price and show signs of a bounce, this could be a safer entry point with a lower risk.
7. Risks and Watch-outs During Entry
* Potential for Failed Breakout (False Breakout): The biggest risk is if the price fails to break through the resistance and instead experiences rejection. The price could rise slightly above $120,000 (as the chart shows) and then quickly reverse, forming a "false breakout." This would lead to losses for traders who entered a buy position without confirmation.
* High Volatility at Resistance Area: Historical resistance areas like $120,000 tend to be zones of high volatility, where a fierce battle between buyers and sellers takes place. Price movements can be very erratic.
* Divergence or Trend Exhaustion: Although this chart does not show indicators, it is important to watch out for signs of trend exhaustion, such as bearish divergence on momentum indicators (RSI, MACD), if you were to use them.
Summary of Entry Decision:
The entry decision at this time is highly dependent on how the price reacts to the $120,000 resistance level. It is not an opportune time to enter aggressively because the risk of a rejection is very high. The best strategy is to wait for confirmation.
* Wait for a confirmed breakout: If the price breaks and holds above $120,000, consider entering a long position.
* Wait for a re-test: If the price experiences a correction (pullback) to the nearest support level ($110,000 or $100,000) and shows signs of a bounce, this could also be a good entry point.

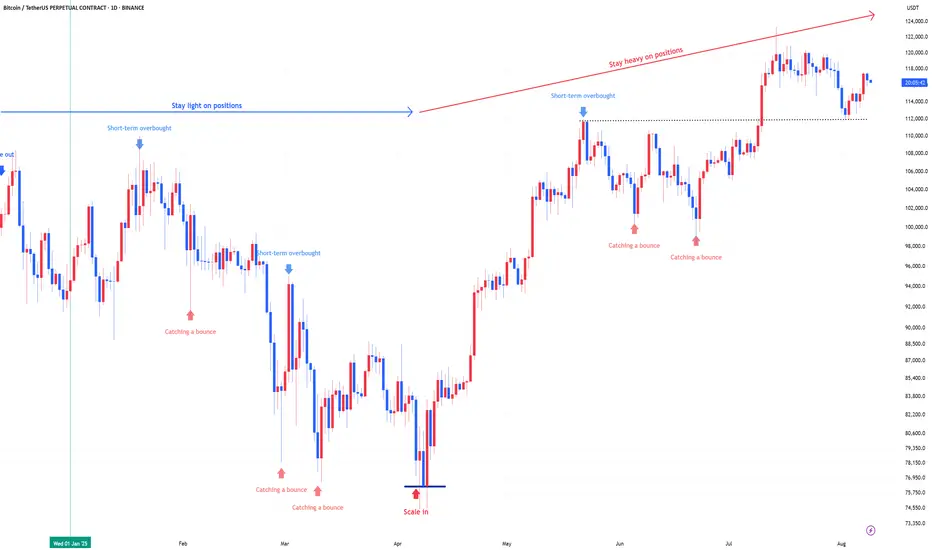
Bitcoin : Stay heavy on positionsSame view as before. No change.
Bitcoin : Stay heavy on positions (2x)
For new Bitcoin entries, now is the time.
If you're using leverage, I’d wait for a scale-in signal before jumping in.
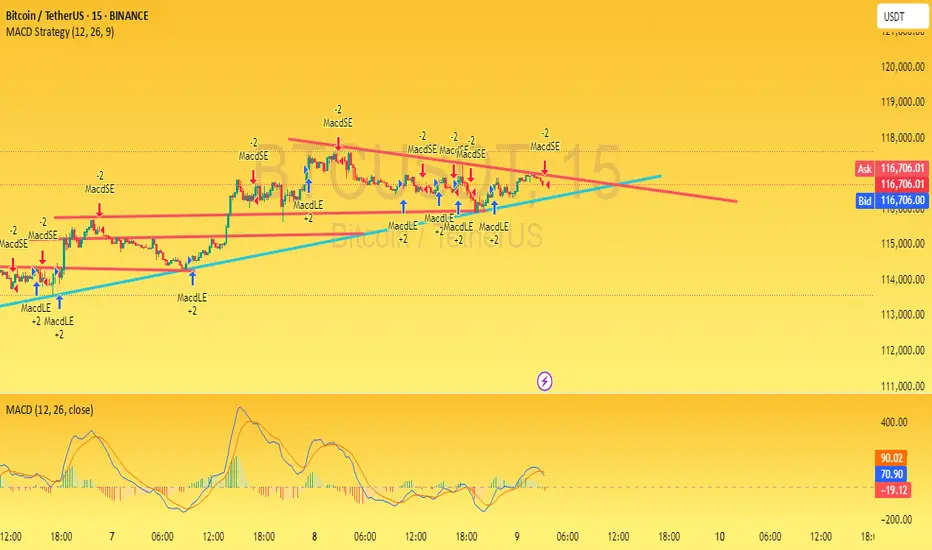
BTCUSDT – Key Resistance Breakout or Rejection? (15-Min AnalysisIn the 15-minute chart of BTCUSDT , the price is currently approaching a significant resistance level. Based on the MACD indicator, bullish momentum is gradually building up, which may lead to a breakout above this resistance. If the breakout occurs with strong volume, the price is likely to move higher, potentially opening the way for short-term bullish opportunities.
However, if the price fails to break above this level and faces rejection, it could signal a shift in market sentiment, leading to a potential downside move. In such a case, we might see the market testing lower support levels in the short term.
Traders should monitor the breakout zone closely and wait for confirmation before entering a position. Managing risk with a proper stop-loss is essential given the volatility on lower timeframes.
$127K Bitcoin in SeptemberBitcoin bullishly moving through major TA areas may be signs its ready for its next leg up. $127k is a FIB extension target.
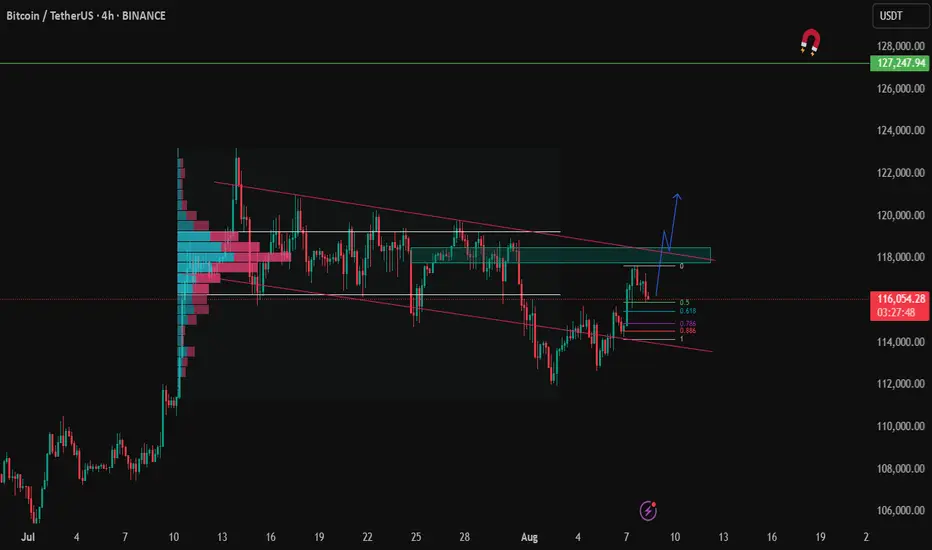
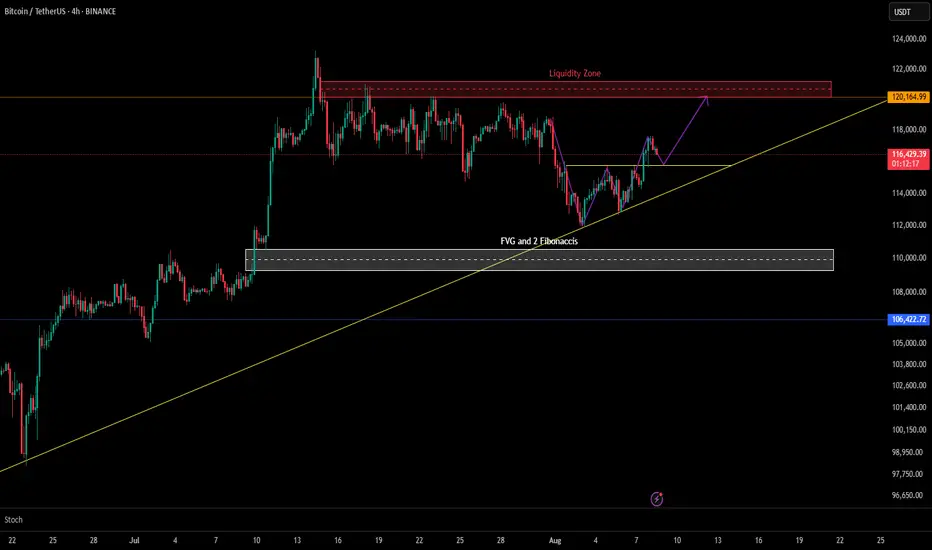
BTC/USDT – 4H Bullish Structure Aiming for Liquidity Grab at $12On the Daily timeframe, BTC is consolidating under a major Liquidity Zone with a strong FVG + Fibonacci confluence below price.
Now, zooming into the 4H chart, we can see the structure more clearly:
🔹 Liquidity Zone (~$120K) – Marked in red, this area is likely loaded with buy stops from shorts. A push into it could be a classic liquidity grab before any reversal.
🔹 FVG + Dual Fibonacci Confluence (~$109K) – Marked in grey, this zone remains a high-probability demand area if price pulls back.
🔹 Bullish Structure – Price has been respecting the ascending yellow trendline. The recent bounce suggests bulls could target the liquidity zone before deciding the next move.
Possible Scenarios:
✅ Bullish Path: Hold above trendline → Push toward $120K liquidity zone.
🔁 Bearish Path: Break of trendline → Deeper retrace into the FVG/Fib confluence zone.
Bias: Short-term bullish unless trendline breaks. Watching $120K for reaction.
Note: This 4H view builds directly on my recent daily chart post for BTC, giving a zoomed-in perspective for shorter-term traders.
Our refinement gives result!After implementing major improvements to our trading system, we got an excellent result:
+8.5% in July - and this without increasing the risks!
How did we achieve this?
🔸In-depth Analysis: for a long time we have been studying already good result of our trading and have long begun to notice a number of patterns related to unrealised pnl.
🔸Using data systematization: AI models allowed us to find clear patterns that we managed to turn into a list of specific improvements to the trading system.
🔸 Risk control: we have not only preserved, but also reduced the level of risk with increasing profitability!
What does this mean for our investors?
✅ More profit is stable and more predictable. New average monthly profit target is now 5%. First month is ahead of him.
✅ Less risk - safety and comfort of investing remains one of our top priorities.
✅ Proven solutions - comprehensive tests were conducted before implementation of improvements, which confirmed the operability of improvements.
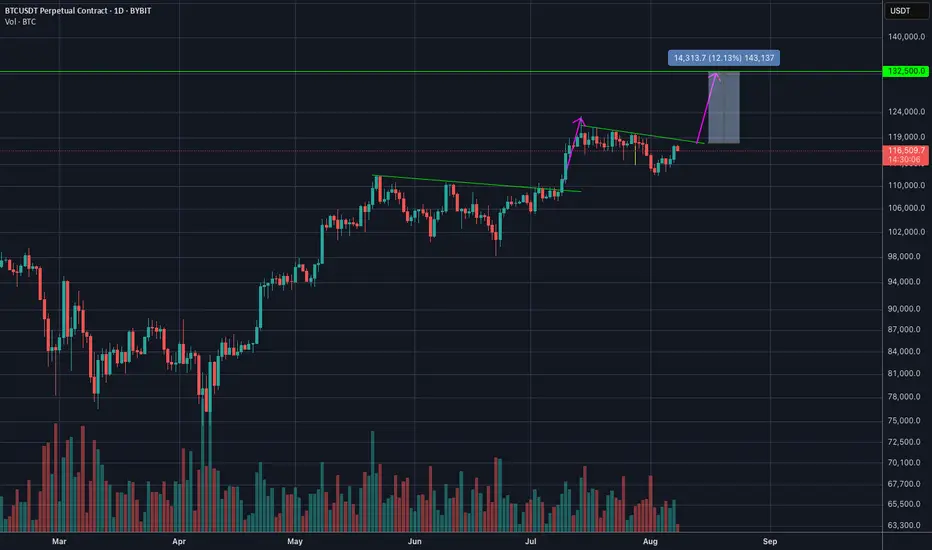
12% upside in 10 days for BTCShort term play for Bitcoin here on a break of $118k
Expect to hit the $130-132k area within 10-14 days.
Good Luck as always!
Risk management is what makes you profitable trader.
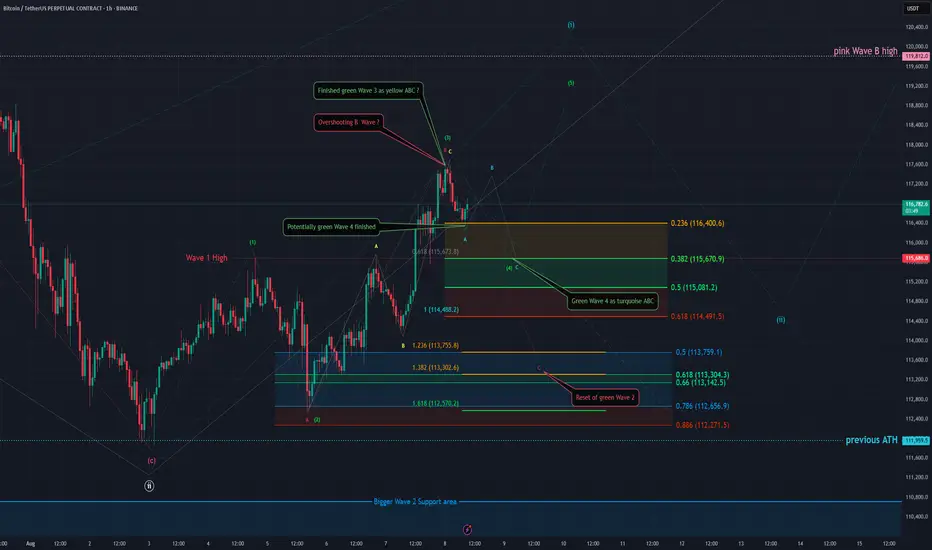
BTC - 1H Elliott Wave Analysis - 08.08.25 Greetings, here is an update on the Elliott Wave Count for Bitcoin.
I highly recommend looking at our last Analysis beforehand to get a better understanding of the case and the developments. As last time we also added some Callouts to try to make it more understandable as it is quiet a tricky situation with different possibilities.
Since our last analysis we got another high which doesn't change much regarding our scenarios.
We still assume that we are in a move upwards displayed as the green 5 Wave move.
Let's look into the more bullish case first.
In the first scenario we assume that we finished the green Wave 1, 2 and that we also finished green Wave 3 now. The 3rd Wave is a ABC displayed as yellow and we're looking for the green Wave 4 retracement before another move up in green Wave 5:
The support area for this green Wave 4 lies between the 0.236 FIB at 116'400 USD and the 0.5 FIB at 115'081 USD. Technically we could have finished the green Wave 4 with the recent low at around 116'400 USD which touched the 0.236 FIB of our support area but it looks rather short and we would prefer a bigger correction in the the turquoise ABC. This turquoise ABC would preferably take to or below 115'670 USD which is the 0.382 FIB of our support area and at the same time the green Wave 1 high. Due assuming this being a diagonal this case would be better as it is common to get overlap between Wave 1 and 4 in diagonals but it is not a must or given.
The alternative scenario is that the recent high was not the green Wave 3 but an overshooting B wave of the pink ABC which would be followed by a C wave down which would then reset green Wave 2. As already mentioned in our last analysis this would be an expanding flat as correction for the green Wave 2. Targets for the pink Wave C would be the 0.618 FIB at 115'673 USD the 1 to 1 FIB at 114'488 USD, the 1.236 FIB at 113'755 USD, the 1.382 FIB at 113'302 USD and the 1.618 FIB at 112'570 USD. Most commonly for such a C Wave is the 0.618 and the 1.618 FIB.
We got a lot confluence around the 115'670 USD price level as besides being the 0.382 FIB of our Wave 4 support area and the 0.618 retracement for our pink Wave C it is additionally the green Wave 1 high as well as the yellow A wave high.
We hope you enjoyed our analysis! :)
Thanks for reading.
Would appreciate a boost and follow if you're interested in more analysis in this style! ^^
NO FINANCIAL ADVICE.
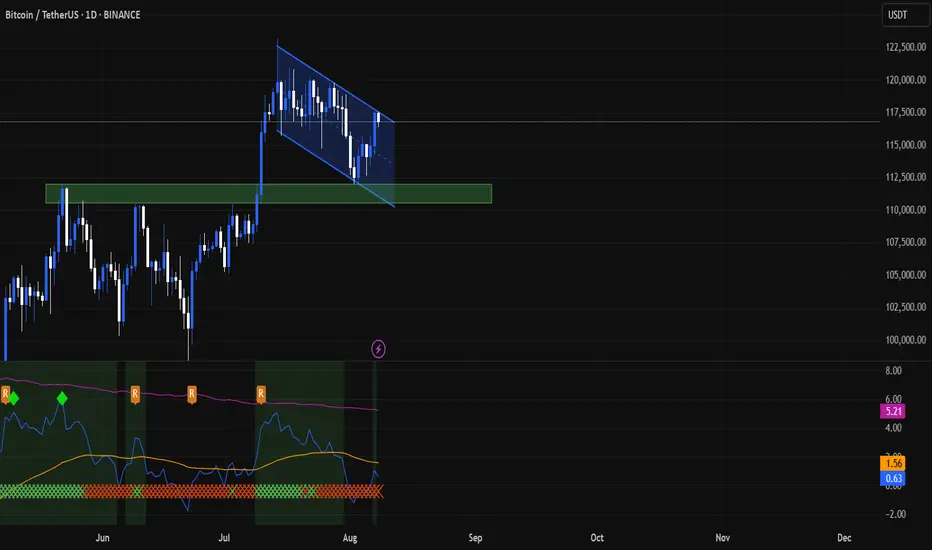
Bitcoin Daily AnalysisIn the last Bitcoin analysis, I announced a price of $113,000 for entry, after which we saw the price grow to $117,000. Now Bitcoin is at the ceiling of a descending channel (of course, money back). If the channel ceiling breaks, it could move back towards the price ceiling of $124,000. Otherwise, it could move back towards $112,000.
This analysis is not a financial recommendation. Crypto is a very risky market and you may lose some or all of your money in it. Especially futures trading.
BTC Buy / Long SetupWait for the entry till London Session, and Hold the trade, Must use SL with proper risk management.
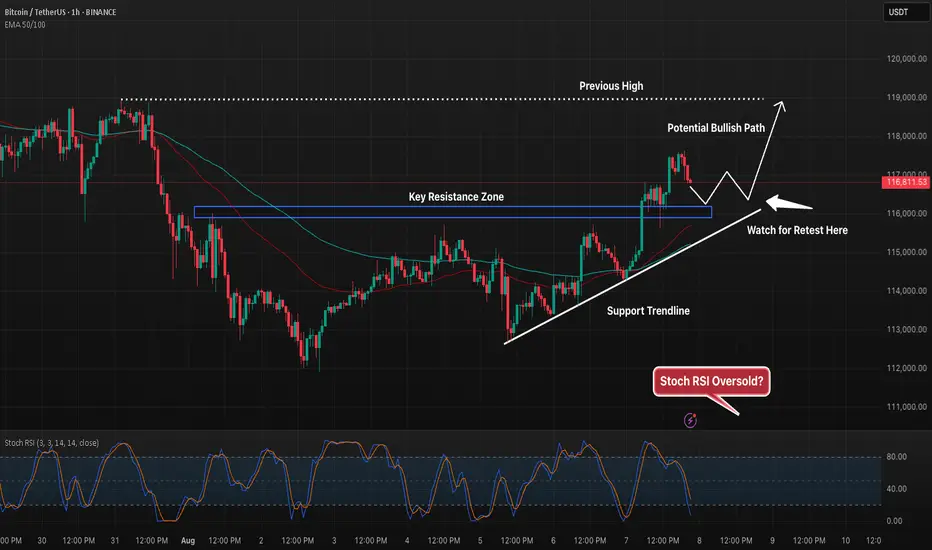
BTC 1H – Ascending Support Holding, Will Retest Launch Bulls?Bitcoin continues to respect its ascending trendline while pushing against the 116.8k–117k resistance zone. Price recently pulled back after a local high, setting up a potential retest of the prior breakout level near the blue support box.
A successful hold here could fuel another leg up toward the 119k target, while failure to hold may bring the trendline into play. Stoch RSI is approaching oversold territory, hinting at possible bullish momentum if buyers step in.
This setup offers a clean structure:
– Clear ascending support
– Defined resistance zone to break
– Stoch RSI nearing reset for potential upside
Traders will be watching the retest area closely for confirmation before committing to the next move.
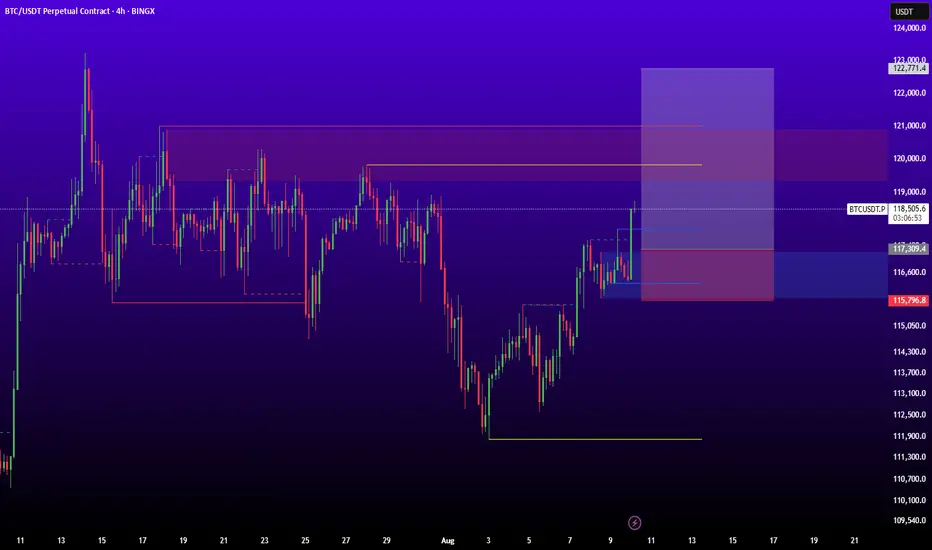
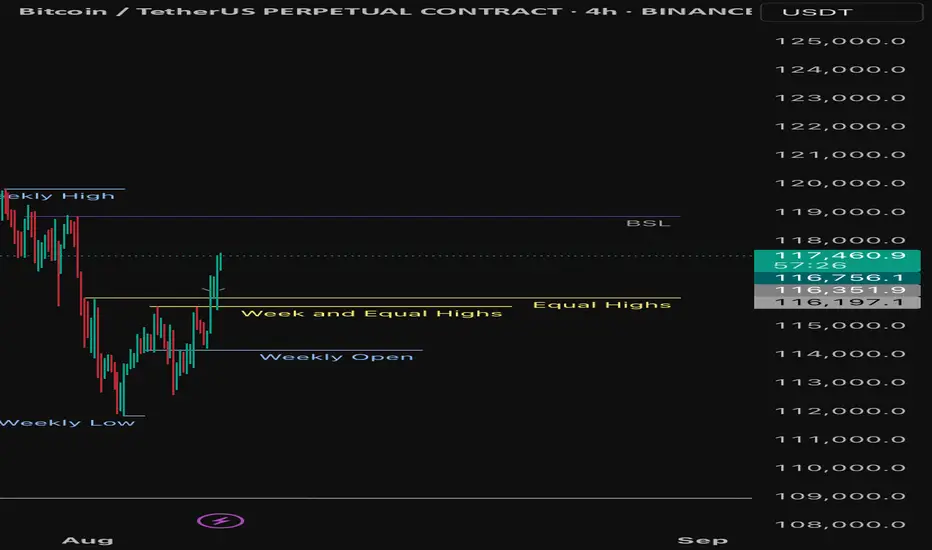
8 Aug — BTCUSDT.PI usually (haha) trade on the basis of what is market doing right now and what is it likely to do next. Right now it looks like reaching for at least the BSL marked. In any case, as traders, we are trading probabilities, so let’s see.
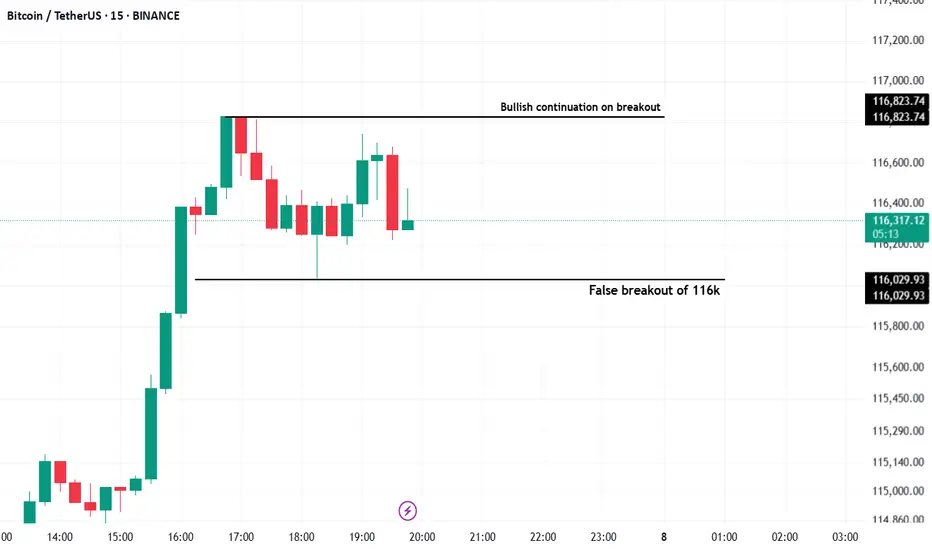
BTC Breaks 116k!We did break the 116k level. But it is not clear yet whether the breakout is bullish or not.
Plotted range extremes let's see
BTC-A weak bull flag is forming A weak bull flag is forming on the 15 M — but momentum is stalling.
📈 Breakout Confirmation: Close above $116,500
📉 Invalidation: Close below $116,100
🧪 RSI is fading, struggling to regain strength. Wait for confirmation
Stay Sharp. Eliminate the Noise.

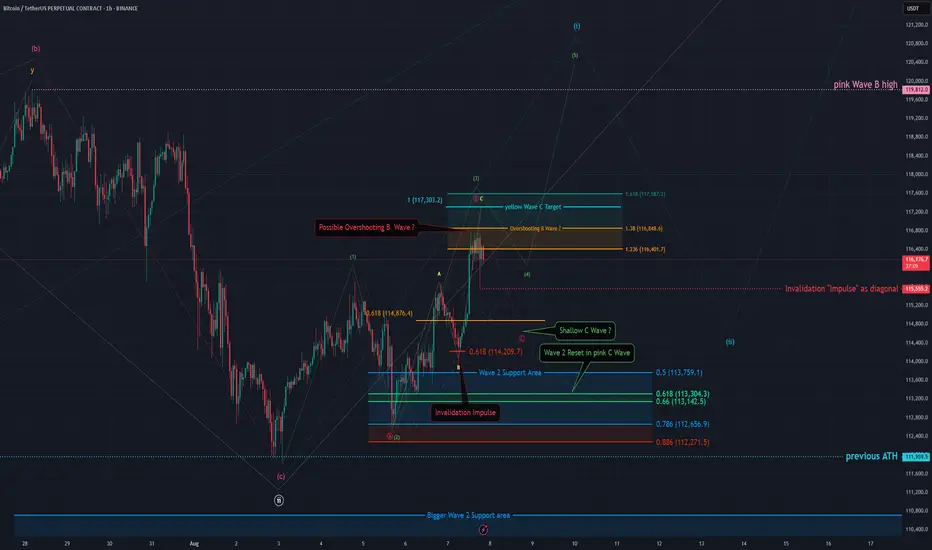
BTC - 1H Elliott Wave Analysis - 07.08.25Greetings and welcome back to another Bitcoin Elliott Wave Analysis!
This Analysis is a bit more complex due to recent price action.
The probabilities of the impulsive structure we discussed last time decrease as the price touched the 0.618 FIB at 114'209 USD of our supposed to be Wave 4 support area which is a warning sign.
It invalidated the impulse we looked into last time. That doesn't mean we turn bearish yet. We are still looking for higher prices to come!
We got two impulsive scenarios.
The first is that we still follow the green count just that it now is a leading diagonal which means every Wave is a three wave move as ABC. For our green Wave 3 in which we currently are this would be the yellow ABC which could be finished but preferably we get another high to hit the 1 to 1 FIB target at 117'303 USD before finishing the green Wave 3 and starting the green Wave 4.
Condition for this count is that we don't move below the last low at 155'555 USD which would shift probabilities to the other cases as the pullback would be too deep.
The other possibility is that we get a reset of the green Wave 2 meaning that the recent move up we saw from the 5th August low is part of the green Wave 2 correction. In this case the move up would be an overshooting Wave B displayed as part of the pink ABC here. Unlike the other count we would prefer to start the move down in pink Wave C now as it would look better.
This doesn't meant that we can't get another high in this count too.
We want to make aware that in this kind of correction which is called expanded flat it is common for Wave C to either undershoot or overshoot Wave A. This means that usually we could get a shallow Wave C to around +- 115'000 USD or a long C Wave.
The overshooting C Wave isn't possible here as it would go beyond the Wave 2 support area and invalidate the count unless we get another high first.
Sadly we can't really calculate the C targets yet due missing price action but we wanted to make you aware of the possibility of it being shallow. :)
Thanks for reading.
We would appreciate if you boost the idea if you enjoyed it as we put extra work into this one. :D
NO FINANCIAL ADVICE.
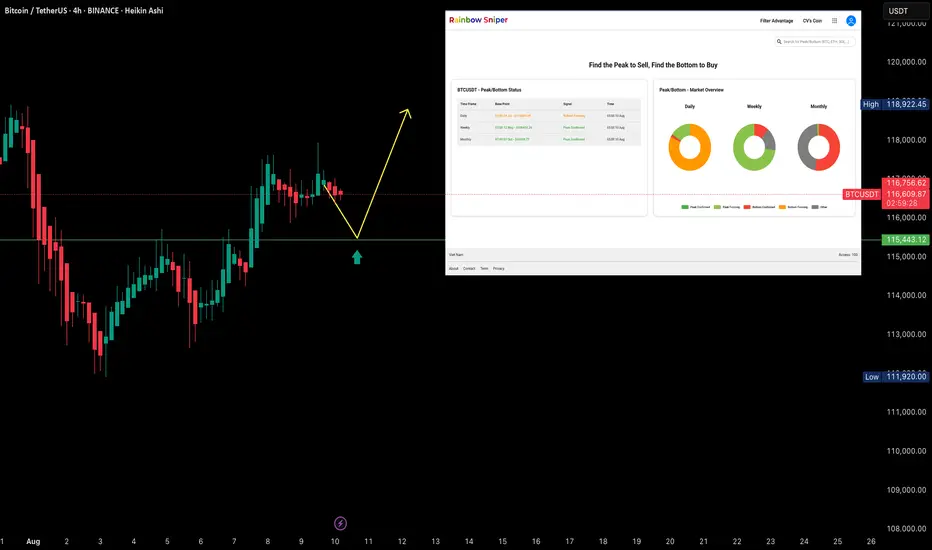
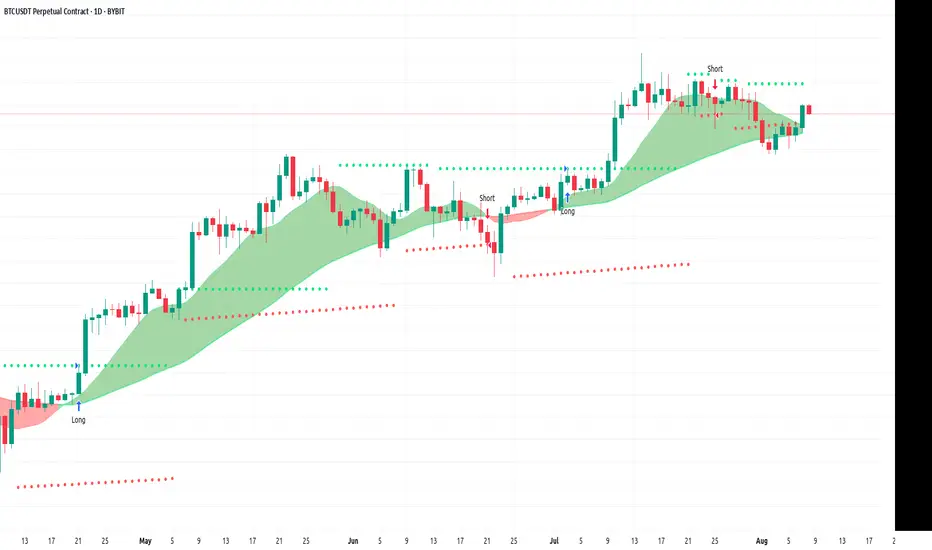
BTC Daily (August 7, 2025)Structure Detected
Ascending Parallel Channel
Bitcoin has been consistently respecting a broad ascending parallel channel (yellow lines) with three clean touches on both upper and lower bounds. The price is currently sitting near the midline of this channel — historically a pivot zone between continuation and pullbacks.
Trend: Strong uptrend with a clear sequence of higher highs and higher lows. Recent pullbacks have all respected the mid-channel and rallied afterward.
Heikin Ashi candles are used, which smooth price action — this makes trend strength visually clearer. A few red candles suggest temporary cooling, but not a structural breakdown.
Market Bias
Bullish — The macro structure remains strong, and price is riding the midline of a clean, long-term ascending channel. No signs of major distribution or topping yet.
If price maintains above the midline (~$115k), upside continuation is favored. A break and close below it could trigger a mid-term pullback to lower channel bounds.
Bullish Targets
If price continues upward from here:
$130,000 → Next horizontal confluence within the channel top zone.
$140,000–$150,000 → Upper channel resistance; could attract long-term profit-taking or final parabolic push.
$170,000 → Extreme target near the top extension of the outer parallel — would imply mania phase or major breakout extension.
Bearish Levels
If midline fails and Bitcoin pulls back:
$100,000–$105,000 → Prior support and lower mid-channel zone.
$90,000 → Bottom channel support — clean historical touchpoints.
$85,000–$80,000 → Strong psychological + structural support cluster; high-confidence long-term demand zone.
Timeframe-Based Targets
Daily Swing Targets
Upside: $130k → $140k → $150k
Downside: $105k → $90k → $80k
Weekly Structure: The weekly mirrors this bullish channel. As long as weekly candles close above ~$100k, the long-term trend is intact.
Summary:
Bitcoin remains in a well-respected bullish channel, currently riding the midline — a typical pivot zone. Holding this zone supports further upside toward $130k+. A breakdown below ~$115k could trigger a deeper pullback toward $100k–$90k support. Macro trend remains bullish unless the lower channel breaks.
