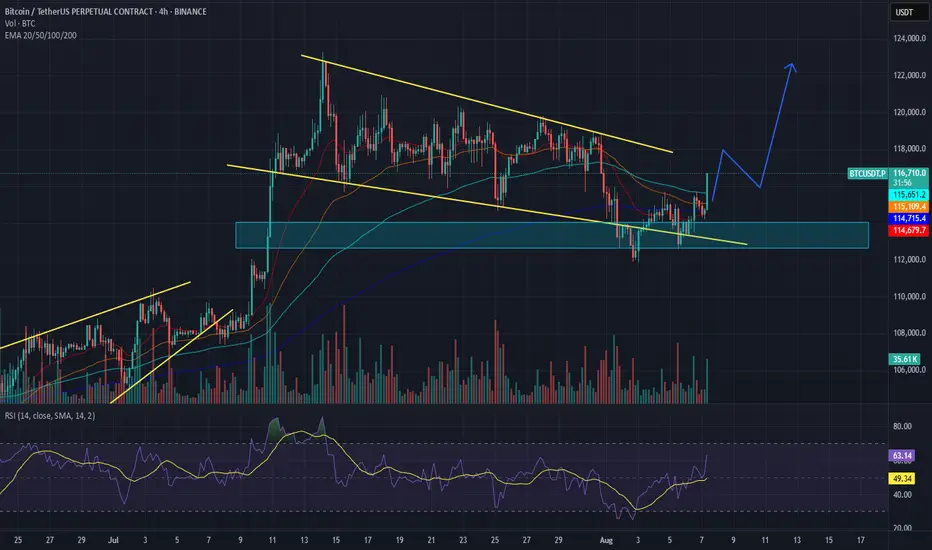
BITCOIN TRADE 07.08.2025After a correction by 10% from ATH, BTC finally closed a huge gap on CME on $114.000 level, we are ready to see another wave of growth. I was waiting for BTC to break out EMA-200 level on 4-hour timeframe, after seeing how the price was consolidating below of EMA-200 and trying to break out a few times in a row, I opened a long position on $115280. So far I'm expecting to see the price to break out the upper channel and then we can expect BTC to try to hit new ATM since there is a lot of liqudity from short traders, but for your calmness, you can completely close your position on $120.000.
BTCUST trade ideas
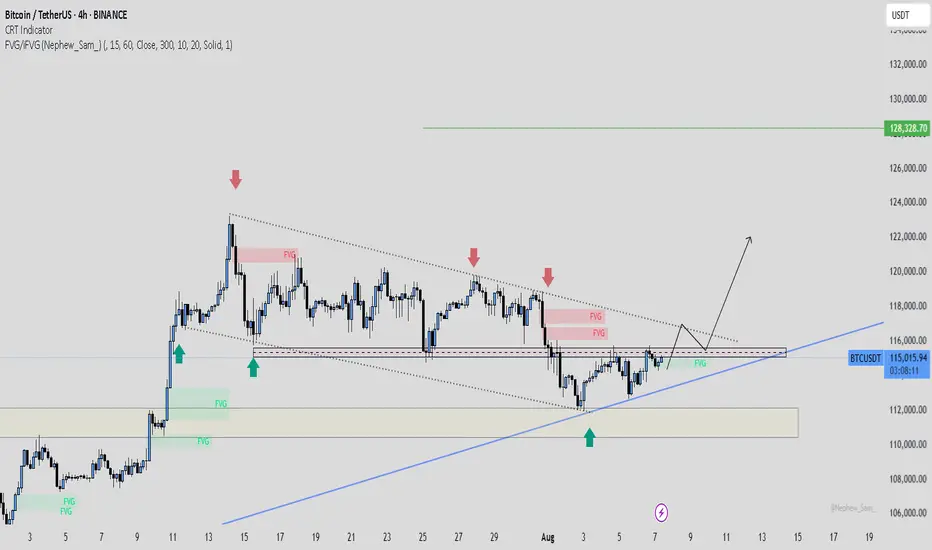
BTCUSDT: The Fuse is Lit | Wedge breakout LoadingThis chart is screaming breakout.
BTC has been coiling inside this falling wedge for weeks and every dip into the demand zone near 110K–112K has been aggressively defended (check those green arrows). Now? Price is pressing hard against wedge resistance right at the top.
This is compression before expansion.
⚡What I'm Watching:
Bullish structure forming: higher lows ✔️
Price reclaiming key levels ✔️
Major breakout zone at 115,800–116,000 coming into play
Break and retest = rocket fuel to 122K and beyond
🎯 My Bullish Targets:
TP1: 122,000 (magnet level)
TP2: 128,328 (next HTF target)
🚨 Invalidation:
A clean break below 112K? I step aside. Until then bullish bias stays on.
#BTC/USDT Breakout needed #BTC
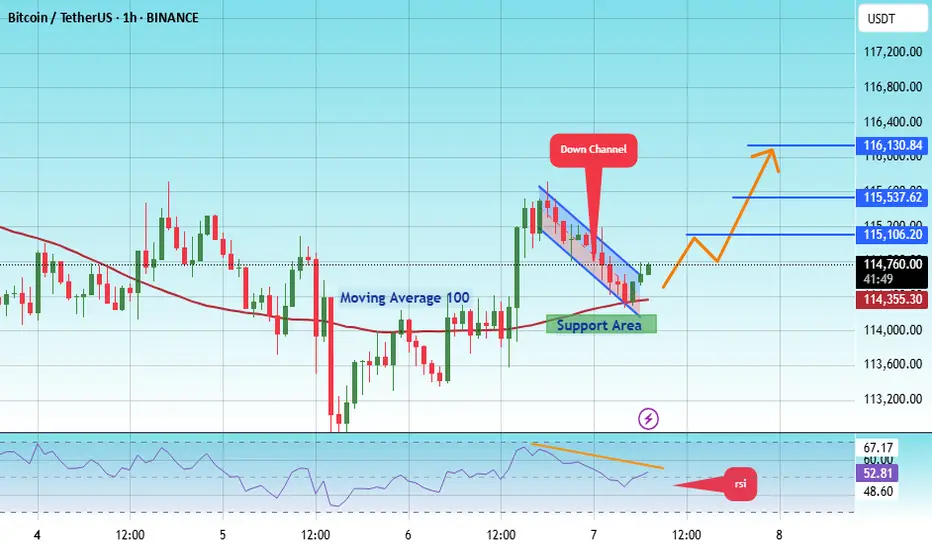
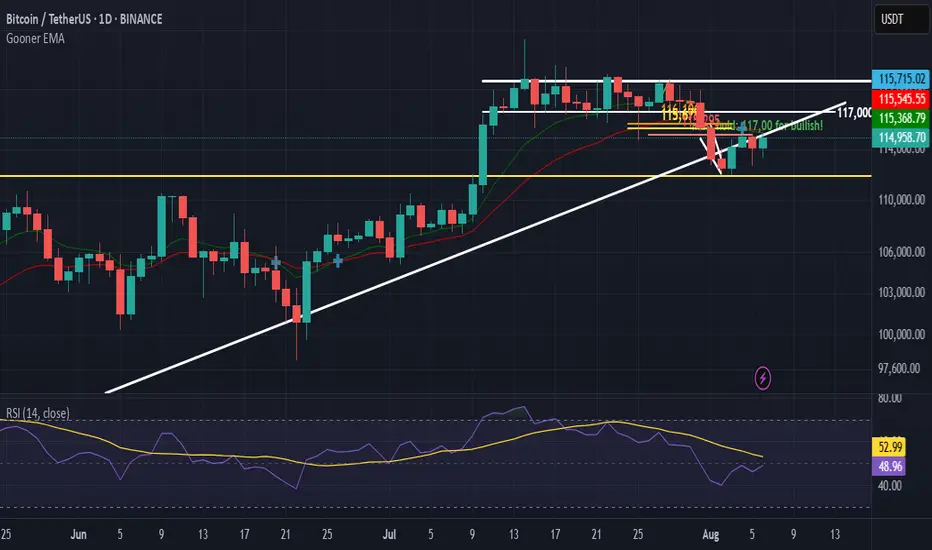
The price is moving within an ascending channel on the 1-hour frame, adhering well to it, and is on track to break it strongly upwards and retest it.
We have support from the lower boundary of the ascending channel, at 114200.
We have a downtrend on the RSI indicator that is about to break and retest, supporting the upside.
There is a major support area in green at 114000, which represents a strong basis for the upside.
Don't forget a simple thing: ease and capital.
When you reach the first target, save some money and then change your stop-loss order to an entry order.
For inquiries, please leave a comment.
We have a trend to hold above the 100 Moving Average.
Entry price: 114700.
First target: 115106.
Second target: 115537.
Third target: 116130.
Don't forget a simple thing: ease and capital.
When you reach the first target, save some money and then change your stop-loss order to an entry order.
For inquiries, please leave a comment.
Thank you.
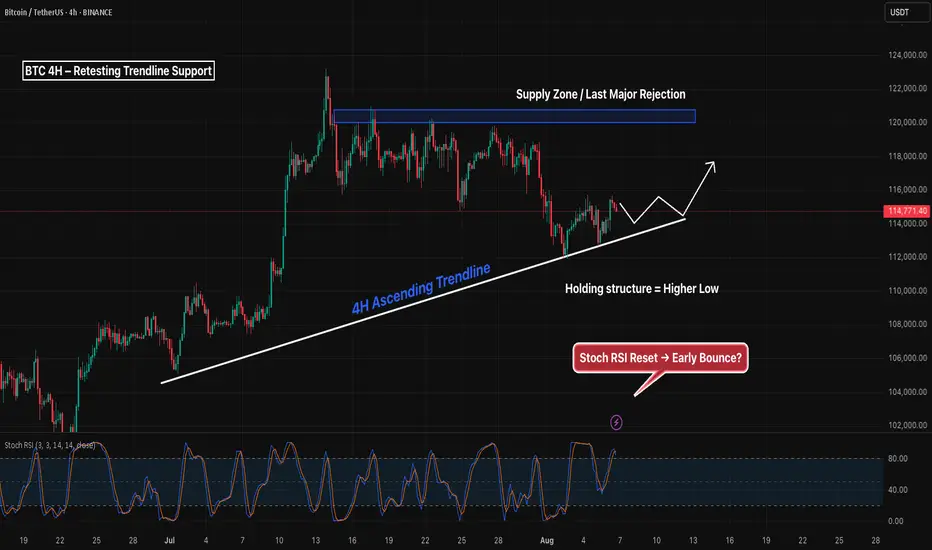
BTC 4H – Retesting Trendline Support, Will Supply Reject Again?Bitcoin is retesting a clean 4H ascending trendline after forming a local higher low — with Stoch RSI starting to turn upward from the bottom. This trendline has acted as reliable support since early July.
If price continues to hold and flip the mid-range ($116K), the next major test comes at the overhead supply zone ($119K–$121K), where price was previously rejected multiple times.
Key levels to watch:
– Trendline support (currently holding)
– Mid-range reclaim (~116K)
– Supply zone rejection or breakout (119K–121K)
– Stoch RSI bounce = potential early signal
Bullish continuation hinges on strength through supply — otherwise, this may form another lower high. Watching for confirmation from price action + momentum.
BEATRONXbtronx is the best btonx i hope she paldos oh my god i am jusy filling up thr word limit that it is requiring before i can publish ehheehe
BTCUSDT: Touch 124000$Hello everyone we see the second wave of 5th wave and start to uptrend and touch the 124k price. Good luck.

BTC(20250806) market analysis and operationAugust 6th BTC Contract Technical Analysis:
Today, the large-scale daily chart closed with a small bullish candlestick pattern, with consecutive bullish candlesticks. However, the price remains consolidating at a high level, with no signs of an upward breakout. The accompanying indicator forms a death cross. Therefore, based on the current trend, the price is still within the range, with rising and falling prices unlikely to continue or break out of the range. Therefore, trading should be considered within the range. The short-term hourly chart showed yesterday's intraday gains, followed by pressure and declines in the European session, with the US session continuing its correction. Prices rebounded after finding support in the Asian morning. The current candlestick pattern shows consecutive bullish candlesticks, with the accompanying indicator forming a golden cross. Therefore, an intraday rise is highly likely, but the overall trend is stuck in a range-bound market, so a one-sided trend should not be considered.
Today's BTC Short-Term Contract Trading Strategy:
Buy on a pullback to the 113,700 area, with a stop-loss at 113,200 and a target of 115,000. Sell on a touchdown to the 115,200 area, with a stop-loss at 115,700 and a target of 114,000. Focus on the short-term range.

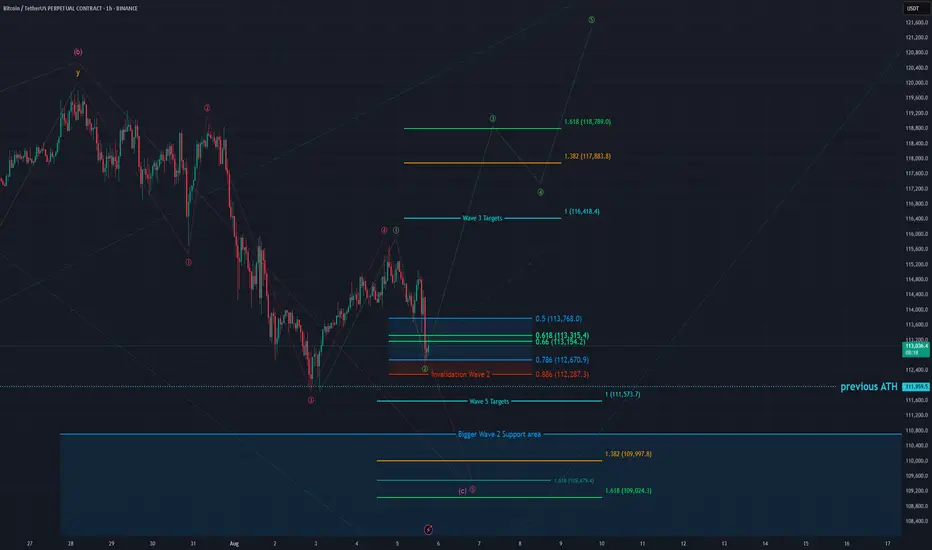
BTC - 1H Elliott Wave Analysis - 05.08.25Greetings, this is an update of our Elliott Wave Count for Bitcoin.
Today we are going to look at the bullish and bearish scenarios so everybody is well prepared for the upcoming price action.
We have seen a pullback since yesterday's update.
The pullback entered and is currently in our Wave 2 support area which is between the 0.5 FIB at 113'640 USD and the 0.786 FIB at 112'616 USD. The bulls would like to see a bounce now in green Wave 3 of which the targets are the 1 to 1 FIB at 116'418 USD, the 1.382 FIB at 117'883 USD and the 1.618 FIB at 118'789 USD which is also the optimal target for a Wave 3.
Due not invalidating the red Wave 4 we could form the red Wave 5.
Be aware that on the lower timeframes we did touch the 0.886 FIB of a smaller Wave 2 support area which does indicate weakness and usually is followed by another low. If we touch the 0.886 FIB of the Wave 2 support area at 112'287 USD it is also an invalidation of the green bullish count.
Red Wave 5 targets are the 1 to 1 FIB at 111'573 USD which is additionally right below the last low and the last all time high which could function as further support. Further targets would be the 1.382 FIB at 109'997 USD and the 1.618 FIB at 109'024 USD as well as another 1.618 FIB at 109'479 USD.
Be aware that the bigger Wave 2 support area goes down to 103'000 USD.
We think another low is more probable meaning the red count has the higher probability.
Yet we think the green count is a good opportunity as we have a clear set up and invalidation point.
Thanks for reading.
We would appreciate a follow and boost if you like the analysis! :)
NO FINANCIAL ADVICE.
btc usd short term down 50 to 70 pips btc usd short term down 50 to 70 pips
fell free contrect me if you have any question

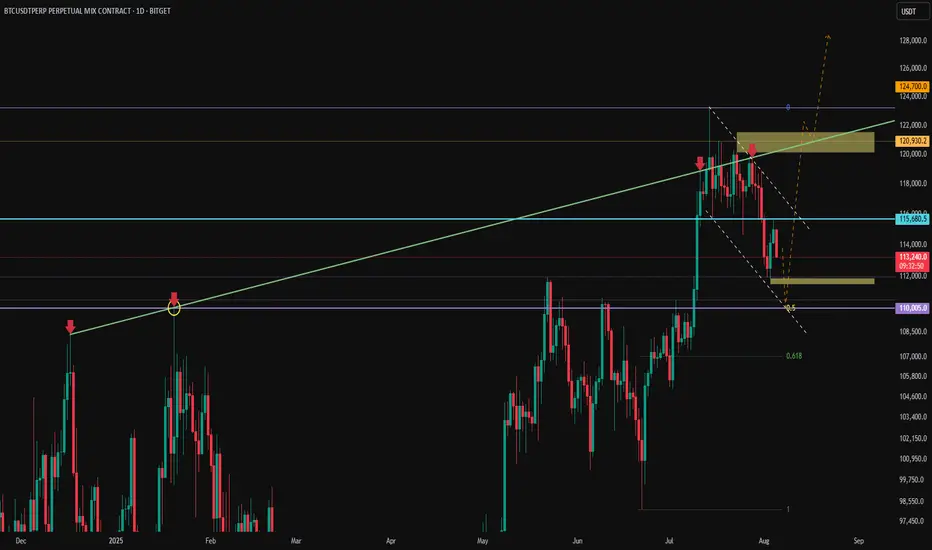
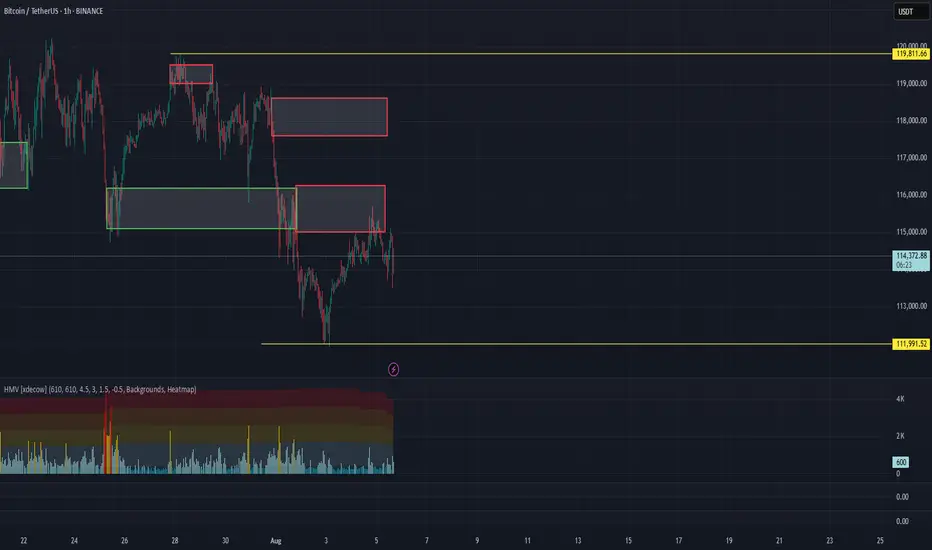
BTC - trend lines and liquidity zonesHere is a summary of what I'm looking at:
Price currently struggling to surpass the Weekly low @ 115,650 (Blue line)
The green line is acting as resistance, with a brief break-through mid-July.
Huge liquidity zone 120-121.5K which will be inevitably grabbed (Yellow box)
Liquidity sitting below @ 111K (Yellow box)
0.5 fib currently at @ 110K (which also acted as the Weekly high in Jan 25)
A descending channel formation
Analysis:
I believe that Bitcoin with visit the 110K - 111.5K zone which also coincide with the bottom of the channel, the Weekly high @ 110K and 0.5 fib (ish) and grab what liquidity is currently sat below.
Once done, move up to the higher liquidity zone, which would break once again above the Green line which would hopefully flip into support, and send BTC parabolic with a peak Nov-Dec.
Robert Kiyosaki said WHAT about BTC?According to Cointelegraph Robert Kiyosaki welcomes a BTC dip below $90K... We talked about it before even BTC broke ATH (check related publications), what do you think?
#crypto #cryptomarket #bitcoin #btc #trading #analysis
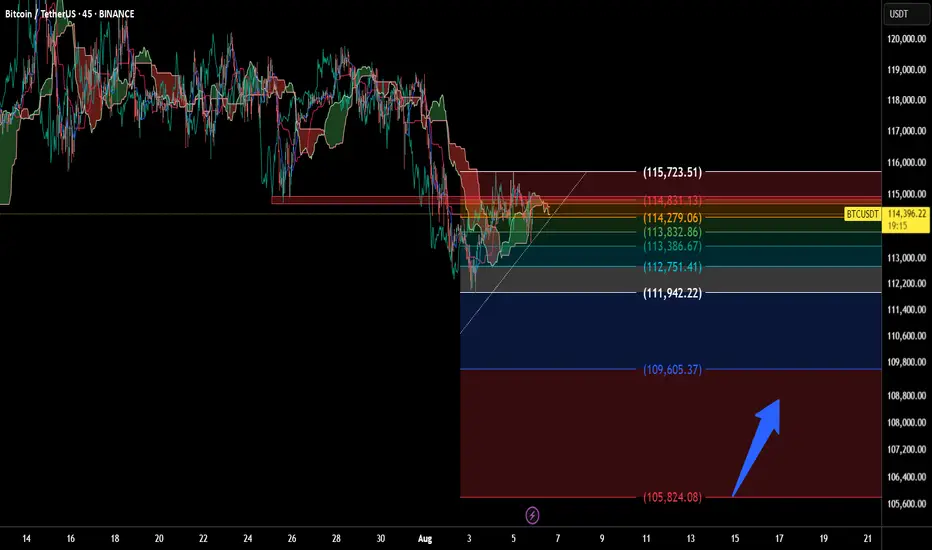
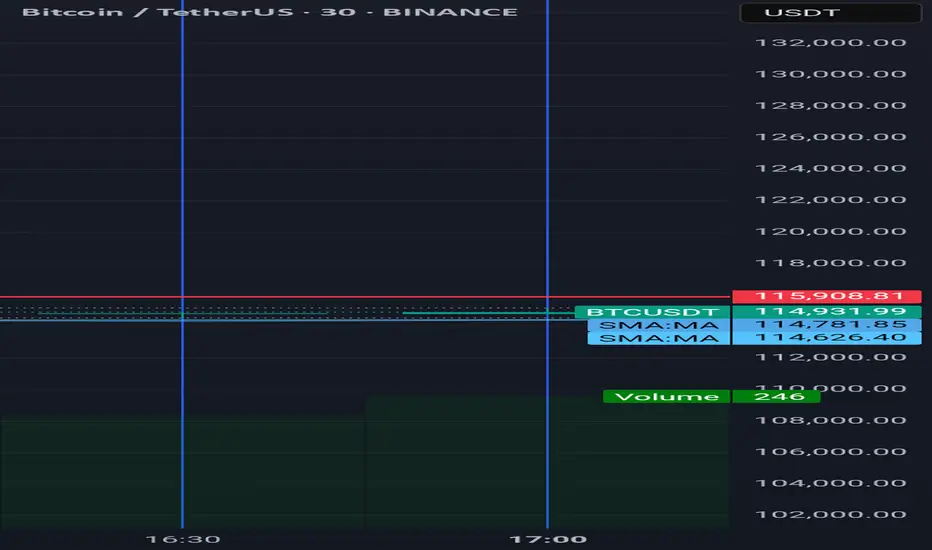
Will BTC Hold the Line? Support Levels TestedBitcoin is currently trading at 114,420 USDT on the 45-minute timeframe. This setup highlights a structured technical analysis using Ichimoku Cloud, Fibonacci retracement, and clearly defined support/resistance levels.
Key price zones:
- Resistance: 115,723.51 / 114,831.13
- Mid-range: 114,279.06 / 113,832.86
- Support: 113,386.67 down to 109,605.37
A downward arrow suggests a potential revisit to lower support zones, possibly around 105,824.08 USDT, indicating a watchlist area for accumulation or bounce confirmation.
💬 “Monitoring BTC’s reaction around key Fibonacci levels. Potential support zone in sight.”
BTC/USDT Analysis – Reached Resistance
Hello everyone! This is the daily analysis from the CryptoRobotics trading analyst.
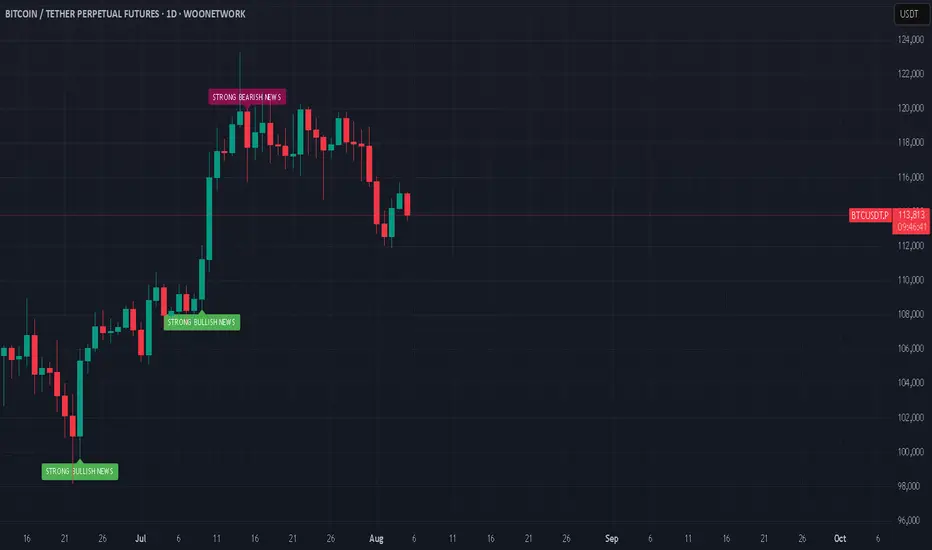
Yesterday, Bitcoin reached the resistance zone at $115,000–$116,300 (a mirror volume zone), and we are already seeing a reaction from sellers.
Our primary expectations remain unchanged since yesterday — we anticipate a move back down toward the local low. If there’s no reaction at that level, we could see a further decline toward the next support zone at $110,000–$107,000 (accumulated volume). A shift to a bullish scenario is only possible if strong market buying appears, which would be reflected in a sharp spike in volume and upward positioning.
Buy Zones:
$110,000–$107,000 (accumulated volume)
Sell Zones:
$115,000–$116,300 (mirror volume zone)
$117,600–$118,600 (accumulated volume)
This publication is not financial advice.
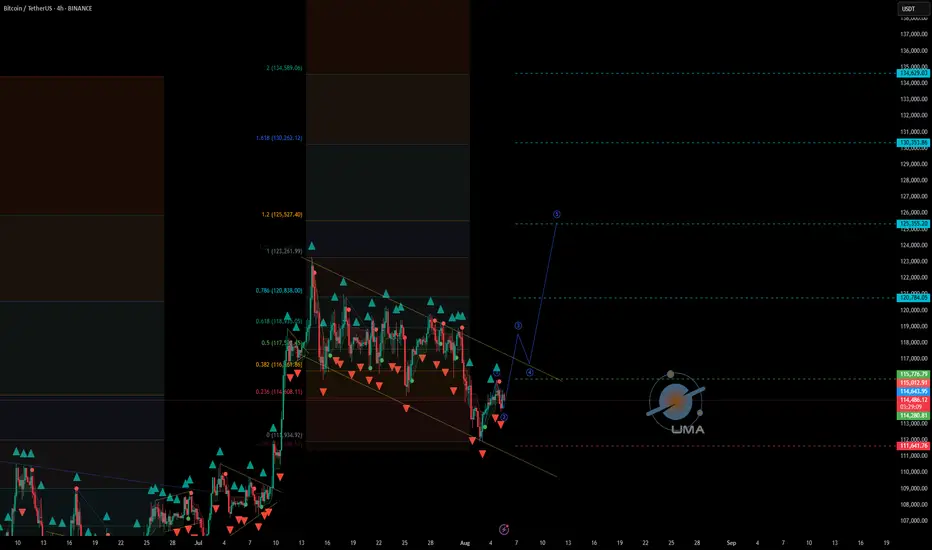
BTCUSDT - UniverseMetta - Signal#BTCUSDT - UniverseMetta - Signal
H4 - Formation of the 3rd wave from the lower border of the channel. Stop behind the minimum of the 1st wave.
Entry: 115776.79
TP: 120784.05 - 125355.20 - 130353.86 - 134629.03
Stop: 111641.76
127000 USD on BTC? Analysis of the Bitcoin (BTC/USD) chart on the TradingView platform reveals several key observations. The current price is hovering around $114,249.14, suggesting a short-term decline following a previous significant rise, evident as a high peak on the chart. The two moving average lines—green (shorter period) and red (longer period)—indicate an upward trend, as the green line is above the red, signaling bullish strength in the broader perspective. However, recent red candles point to selling pressure, with the price approaching a support zone around $113,000–$114,000, which could serve as an area of consolidation or a potential rebound.
In the lower part of the chart, the oscillator (e.g., RSI or another momentum indicator) remains in a neutral zone, suggesting no significant overbought conditions but also a lack of strong momentum for further declines. It’s worth noting that the price is currently testing a critical support level, and a break below this could lead to further downside, while a bounce could target higher levels. Based on the current trend and historical price action, a suggested target price of $127,000 USD appears achievable if the support holds and bullish momentum resumes, potentially driven by a breakout above the recent high.
Potential TP: 127 000 $

BTC retracement planDon’t chase breakouts above $115K without confirmation—false signals are common in volatile crypto conditions.
Watch for volume spikes at key levels like $115K or near $117,800 for validation.
Use tight stop-losses given intraday volatility—it’s easy for sharp 1–2% swings in crypto.
Note that technical sentiment (RSI, MACD) remains neutral to slightly bearish across intraday and daily indicators .
Weekly trading plan for BitcoinBINANCE:BTCUSDT Price has shown recovery over the past 24 hours, but now faces a critical test at the weekly reversal level ($115,300). The inability to establish sustained footing above this level may trigger a deeper correction
Key Scenarios:
Bullish: Hold above $108K maintains ATH potential
Bearish: Failure to consolidate above $115.3K opens downside risk to 110k
Let the market confirm its direction first


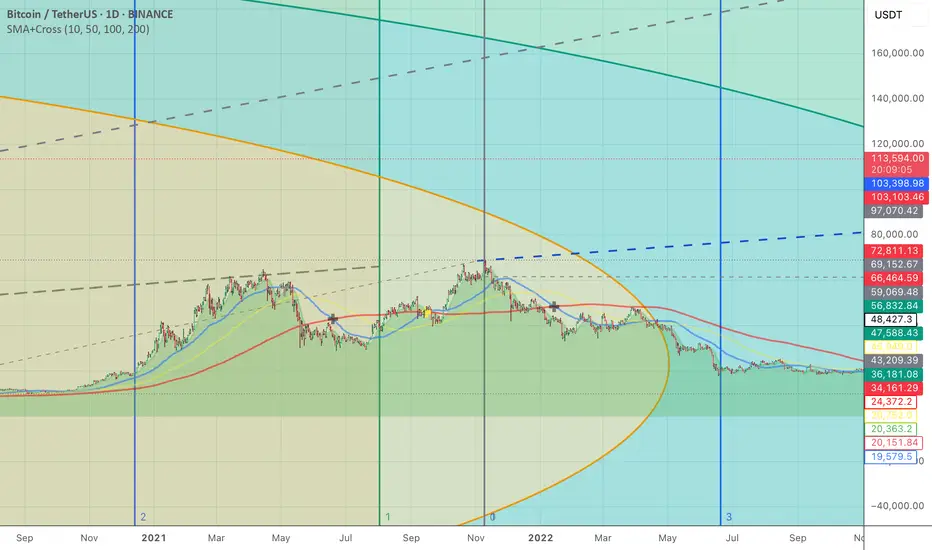
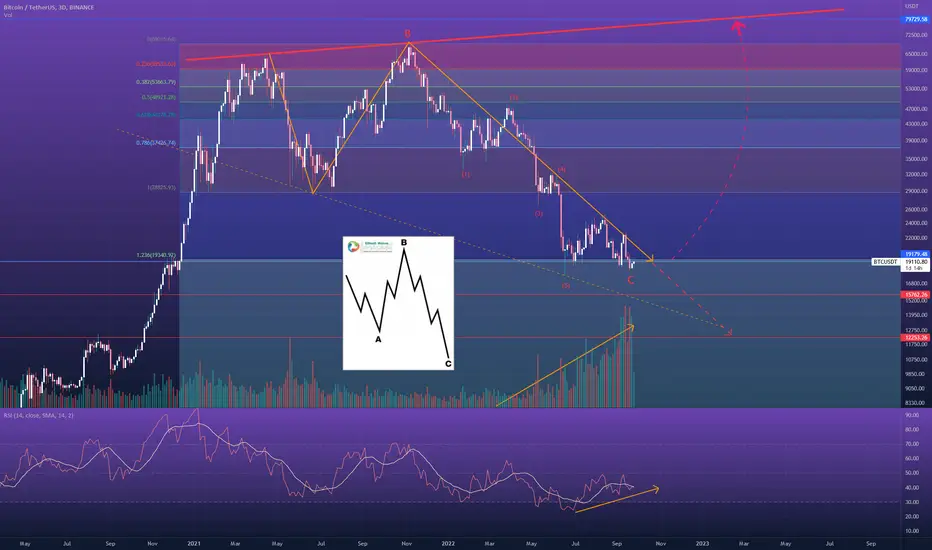
BTCUSDT Expanded Flat Correction may be overBear with me (pun intended). I know I'll probably get some slack from the 5 wave correction counting of wave C. Most people would place the 3rd wave in June instead of May, but a few things suggest me that the 3rd wave down was actually in May:
This C wave lies at the 123.6% extension of wave A which is a common area for the Expanded Flat correction.
Volume and RSI printing a divergence
2M RSI just broke out of its falling wedge
BTCUSDT resiliance at the 19k level, in contrast with the current equity price action & general sentiment, which goes against the previous sell offs of April and June
All of the above considered, there's still something missing : that the C wave should hold RSI divergence between wave 3 and 5 at completion, which did not happen with this counting. Also BTC would not only have be above the 19.3k resistance of the 123.6% extension of wave A (which is being rejected @ the moment) as it would also need to break & retest that yellow trendline (hands tied with the faster EMA's) that is holding its price down. But where is the fun in posting ideas when all of the cards are on the table? =D
All I'm saying is that this correction is closer to its ending than the other way around, and what I'm suggesting is that I wouldn't be surprised if it would be already over.
DYOR. Not advice
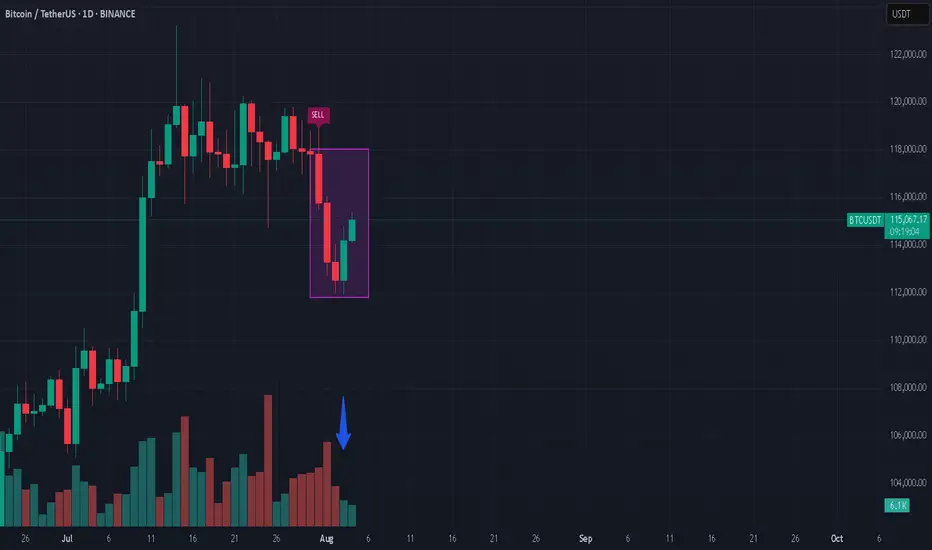
Shorting Bitcoin??Bitcoin had a huge drop, and suddenly shows strength? Well, in my opinion, if you look at the volume, there’s not much strength. I believe it’s going even lower in the short run.
*not investment advice
#bitcoin #crypto #trading
$BINANCE:BTCUSDT Needs a Clean Break Above $117,000The BINANCE:BTCUSDT pair has shown a mild bounce over the past 24 hours, now trading around $114,000. But zoom out, and the weekly performance still shows a nearly 4% dip, raising the question of whether this bounce has real legs or is just noise.
From a long-term holder perspective, on-chain selling pressure has been easing. Data from spent output bands shows that older wallets, particularly those holding BTC for 7–10 years, were active between July 23 and August 1.
However, the extent of selling was notably lower compared to the earlier July 10–19 stretch, when BINANCE:BTCUSDT dropped from $ 123,000 to $ 117,000. Even during this recent distribution phase, BTC managed to hold above $113,000, indicating strong market absorption and reduced overhead pressure.
Valuation-wise, the MVRV (Market Value to Realized Value) ratio currently sits at 2.19. Historically, this zone has acted as a reliable launchpad for Bitcoin rallies. Back in June, a similar reading of 2.16 preceded a move from $101,000 to $110,000. And in April, a 2.12 print led to a surge toward $119000. Right now, BINANCE:BTCUSDT sits in the same zone, supported by a quiet shift in trader sentiment. The long/short ratio flipped from a bearish 0.89 to 1.02, indicating more traders are finally betting on the upside.
From a price action standpoint, BINANCE:BTCUSDT needs to make a decisive move. It is currently holding above the 0.382 Fibonacci retracement level at $113,600. This level is derived from the June low of $ 98,000 to the all-time high of $ 123,000.
The next visible support levels sit at $111,900 and $110,000, while $107,000 remains the invalidation zone for any bullish thesis. However, the true pivot remains $ 117,000; a level marked by historical significance, volume clusters, and failed breakouts. Unless BINANCE:BTCUSDT clears and holds above $117,000, the broader uptrend remains vulnerable to yet another failed rally attempt.

