Bitcoin Weekly Structure: Repeating Rhythms and What’s Next
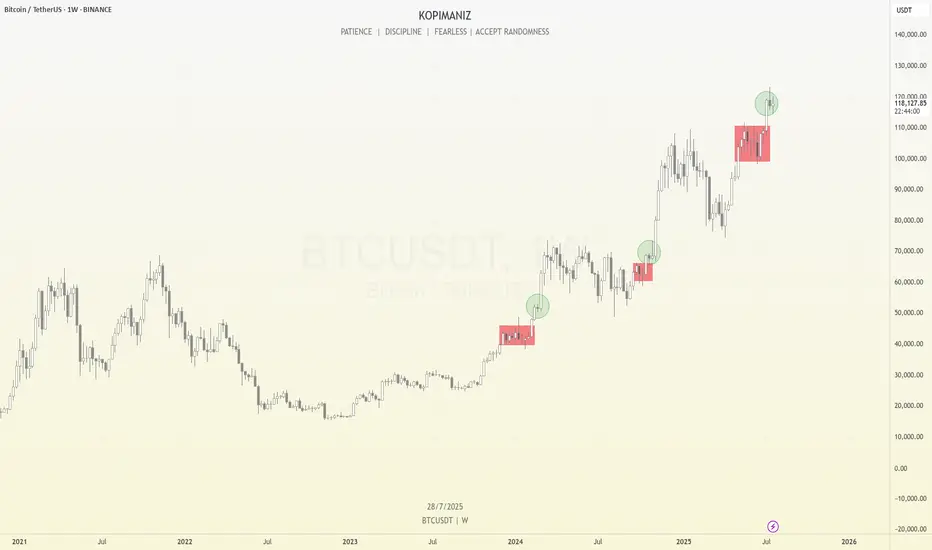
Bitcoin continues to follow a consistent structural rhythm on the weekly timeframe. We can observe that before every major breakout, price enters a multi-week consolidation phase, which I’ve marked using red boxes on the chart. These red box zones represent long periods of sideways movement, typically acting as reaccumulation phases. Once price breaks above these levels, it often results in a strong impulsive move, confirming that these areas serve as foundational support for trend continuation.
After each of these longer consolidations, Bitcoin tends to enter a brief 1–2 week consolidation right after the breakout, which I’ve marked with green circles. These short pauses are signs of healthy bullish momentum, often acting as flags or continuation patterns before the next leg up. What’s notable is that each of these green circle phases occurs after a clean breakout from a red box, and they consistently lead to further price appreciation.
Currently, Bitcoin has just broken out of another red box zone between ~$100k and ~$110k. Over the past two weeks, it has formed a small range near $118k, resembling the same green circle structures we’ve seen earlier in the trend. Given this recurring pattern, there’s a high probability that we are once again in the early stages of a bullish continuation. If the pattern plays out as it has in the past, the next move could be another strong weekly candle pushing toward new highs.
However, I’m paying close attention to the $125k–$126k level. This psychological zone may act as a major turning point. It could lead to either a prolonged consolidation phase that lasts for months, or potentially trigger a significant correction if the market faces strong resistance. This level marks a critical area where momentum may shift, so it deserves extra caution as we approach it.
This type of structural repetition helps me stay grounded in my analysis—focusing not just on price, but also on how long and where Bitcoin consolidates. So far, the rhythm has been clean and reliable.
Let’s see if Bitcoin respects the rhythm once again.
BTCUST trade ideas
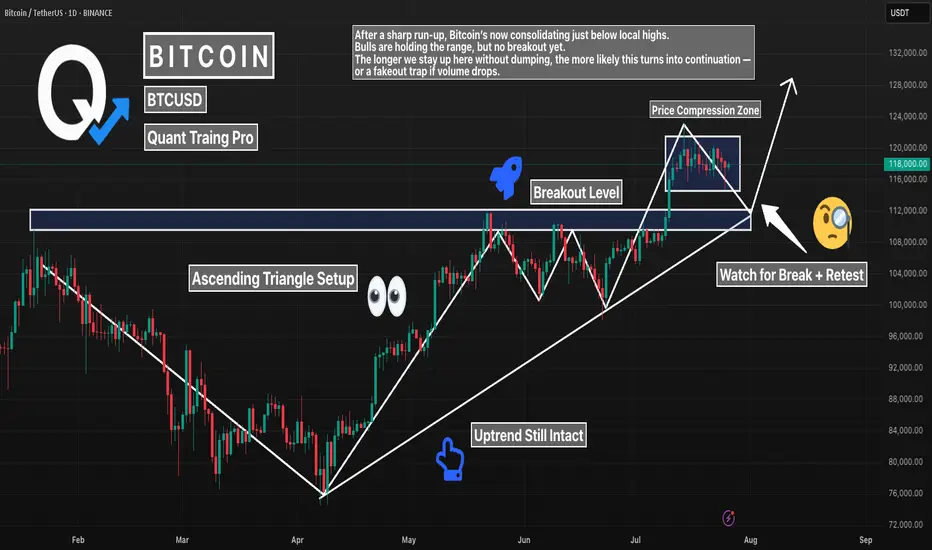
BTC 1D – Major Break of Structure. Now What?Bitcoin just broke major structure — flipping a key resistance level into support. After months of building higher lows, we finally saw price close above the previous swing high, confirming a bullish break of structure (BOS).
Now, BTC is coiling above that zone, forming an ascending triangle and refusing to give up ground. That’s a strong sign — but confirmation still matters.
What to watch:
– Break + retest of current range for continuation
– Or false breakout if volume fades and price sweeps below the level
Structure has shifted bullish. Now it’s all about follow-through.
#BTC #Bitcoin #BreakOfStructure #BOS #CryptoTrading #PriceAction #TechnicalAnalysis #QuantTradingPro
BTC SELL SHORT IDEA H1quick momentum short,to create weekly low manipulation for any masjor move, right now focus is on the sell move, following sub struture ltf trend pull back

Bitcoin - August 25This technical analysis is for informational and educational purposes only. It does not constitute financial advice. Remember to always research and consult with a professional before making investment decisions. Good luck! 📈💼🚀
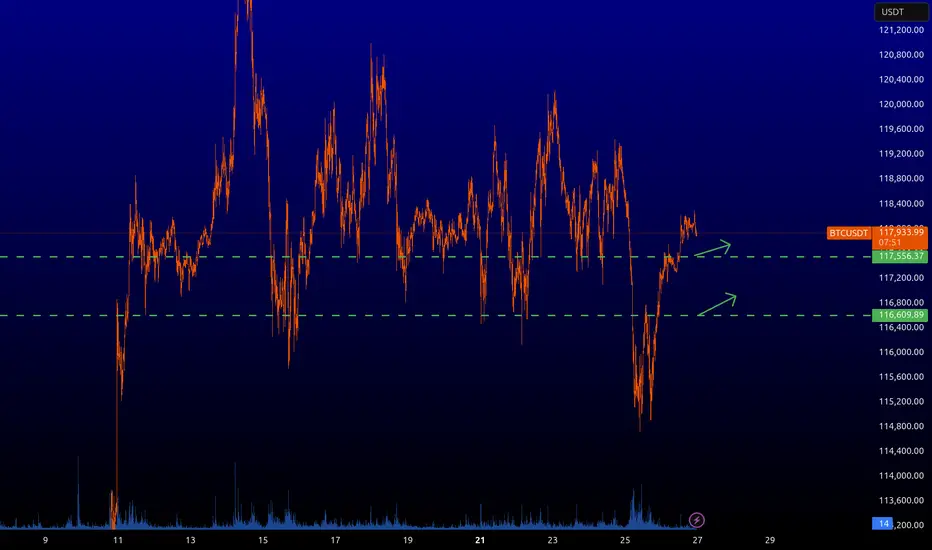
BTCUSD LONGIt's a long time to write and explain everything, just buy the level with the limit that is at ~117.550. You can count on a short-term rebound.
The one below the touchdown is not worth taking. I'll let you know if it works or not later.
BTC - Prediction for the Final TOP AND the next BOTTOMAfter several analyses that I published on Trading View, I want to share my opinion on the Final Top and the next Bottom for Bitcoin!
The final Top will be between 160,000 and 174,000.
The next Bottom will be between 31,000 and 40,000. (Simply under 40,000).
This is not guaranteed, and it's just an analysis; it can happen or not, so be careful.

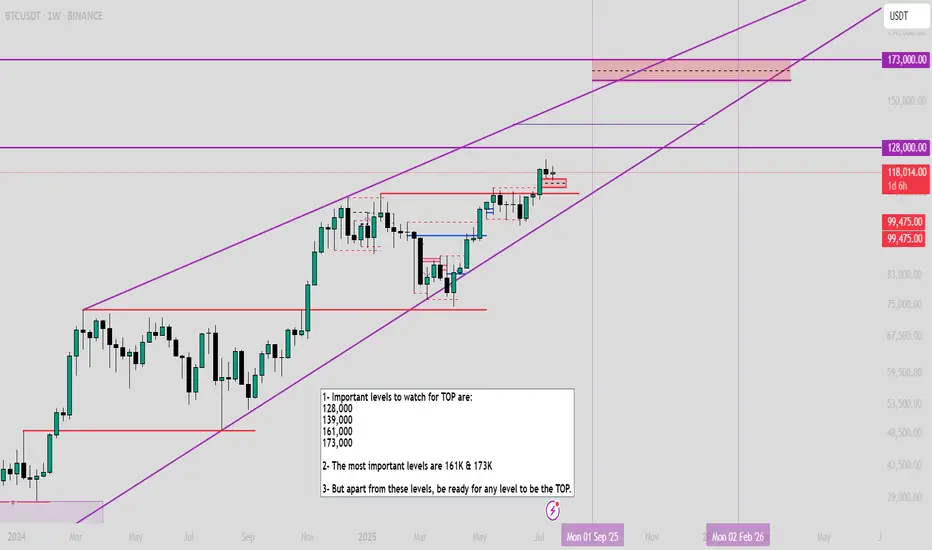
$BTC Important levels to watch1- Important levels to watch for TOP are:
128,000
139,000
161,000
173,000
2- The most important levels are 161K & 173K
3- But apart from these levels, be ready for any level to be the TOP.
(and again, Bull market is not over, watch my previous analysis BTC/XAG on the last post)
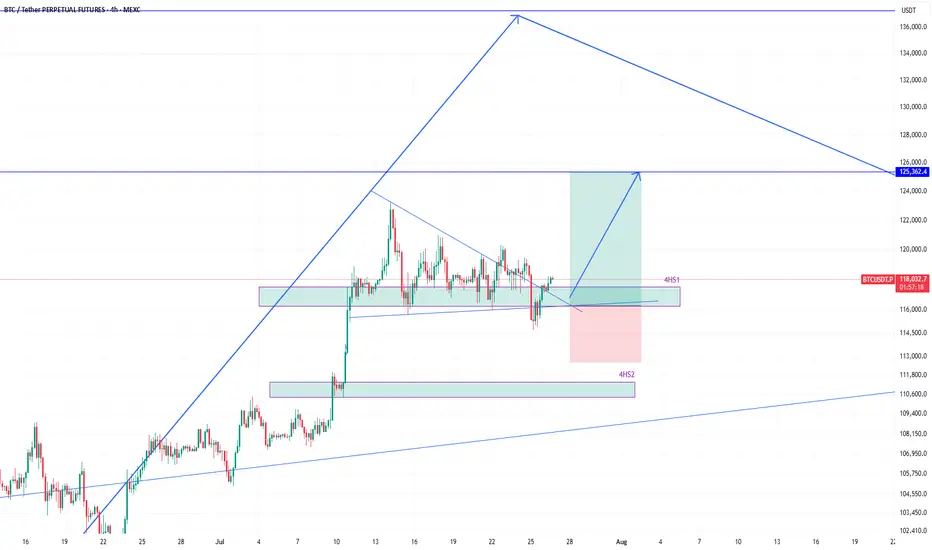
BTCUSDT eyeing 125k next after bounce from 116k zoneEarlier I shared the high time frame view of #BTCUSDT. We know that its heading higher and that helps in holding spot positions.
However, the move to the high frame target will not happen in a straight line, instead with various push to the upside and then subsequent corrections to the down side.
Therefore, as a trader, we must profit from those movements as we see some good high probability setups.
And there is one right now which is a long position.
The price broke 4h support 4HS1, but quickly reclaimed it. That is a sign of demand and strength required to move higher.
Therefore, this presents a long opportunity where the target of this long position should be 125k.
As the price enters into 4HS1 zone, I will scale into long position.
It is quite likely that the price will bounce hard once it taps into 4HS1 zone.
I am talking this long position targeting 125k. What about you? Share with me what you think.
BTC NEXT MOVE UPWARS OR BREAKDOWN?We can see btc hovering over bullish ob
We can expect a pump from here
If breakdown both bullish ob we can look for shorts
Indicator used tuffycalls smc orderblock

SellRejection Level
Daily Volume
Market Structure Shift
London US Session
Trend Line Break
Untapped Order Point
Teach me to fish, don’t hand me the catch.
---
🎯 **“Teach me to fish, don’t hand me the catch.”**
That’s the mantra behind what we do.
We’re not here to hand you quick wins—we’re here to equip you with the tools, mindset, and precision to master the art of **technical analysis**.
📚 **Follow Us** as we unlock proven strategies, crafted through years of experience and sharpened by real market conditions.
💼 **What You'll Get:**
- High-performance analysis techniques
- Visual case studies from our **actual trades**
- Clear examples from the insurance sector and beyond
- A blueprint to recognize and seize winning setups with confidence
💥 Whether you're new or seasoned, this isn't textbook theory.
This is **applied strategy**, built for clarity and verified by results.
---
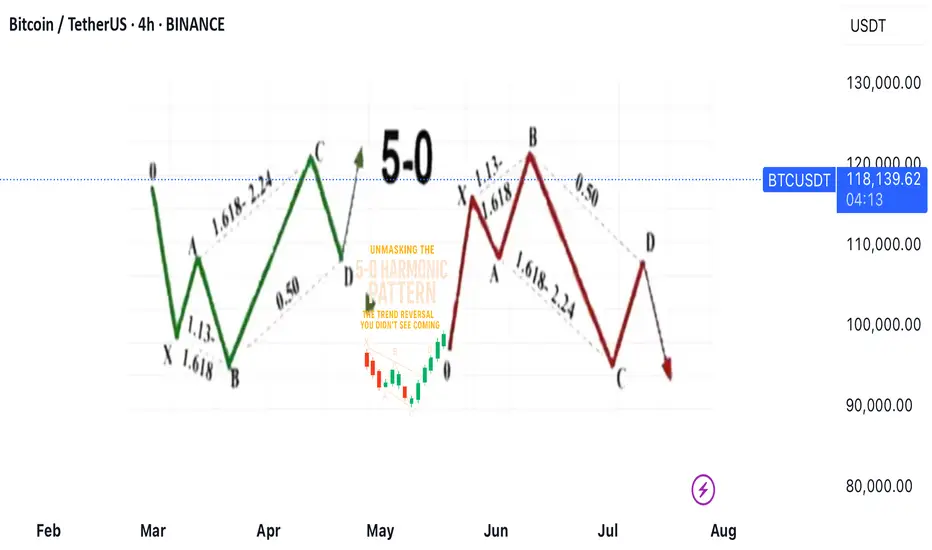
Unmasking the 5-0 Harmonic Pattern
---
🎯 **Unmasking the 5-0 Harmonic Pattern: The Trend Reversal You Didn't See Coming**
Discovered by the visionary Scott Carney and unveiled in _Harmonic Trading, Volume Two_, the **5-0 pattern** isn't just another blip on a trader’s radar—it’s a siren of market reversal.
📈 **Why It Stands Out**
- Unlike the familiar Bat or Gartley structures, the 5-0 pattern is fueled by **precise Fibonacci ratios**, making its reversal zone deadly accurate.
- Centered around the pivotal **Point B**, this model doesn’t just hint at change—it defines it.
🌀 **The Anatomy of a Flip**
- Often marking the **first true pullback in a major trend reversal**, the 5-0 isn’t a lagging indicator—it’s your early warning system.
- The **AB leg?** That’s no ordinary wave—it’s usually the final gasp of a fading trend, setting the stage for powerful new momentum.
💥 **Bottom Line**
This isn’t just technical analysis—it’s strategic foresight. The 5-0 pattern reveals where the market **hesitates... and where you strike**.
---
_"To truly learn, we must see it in action.
So let’s pull back the curtain and share a powerful example from our **past insurance market trades**—a deal that blended precision, timing, and strategy.
In comments
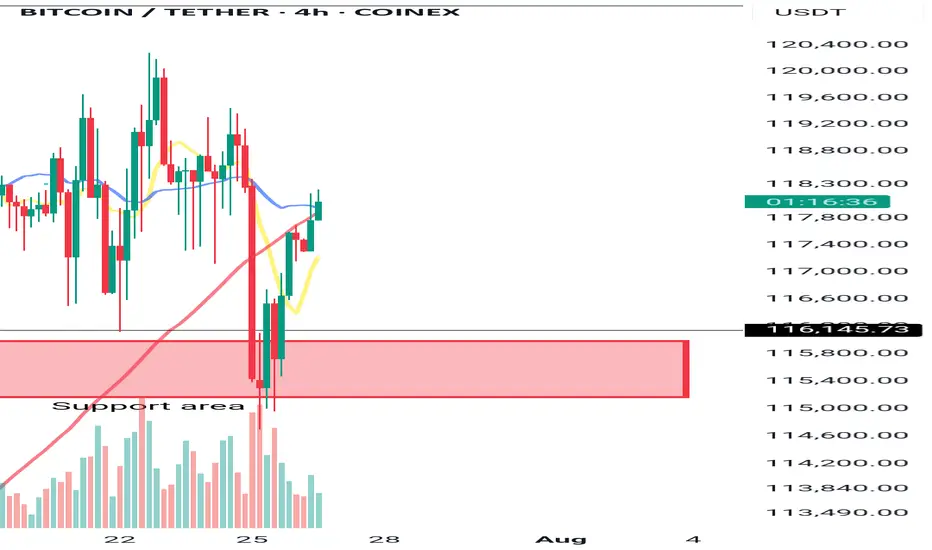
Bitcoin’s Battle at Resistance Watch These Critical Levels.Bitcoin is currently forming an AMD (Accumulation–Manipulation–Distribution) pattern.
The market recently dipped due to manipulation, only to push back up and break through a key resistance level, moving toward the inversion zone. However, it now faces additional resistance from a descending trendline.
If the market decisively breaks above this trendline and successfully retests it, there is potential for further upward movement.
Keep a close watch on these critical levels for confirmation.
Do Your Own Research (DYOR)

BTCUSDT #056 ( Is it clear Road map ? )Hello dear traders.
Good days . First of all thanks for your comment and support.
-----------------------------------------------------------------------------------------------
On long term Gann Square, BTCUSDT stuck below 0.382 Gann Box price level.
With refer to all Daily bullish Gann Square ( Blue Square) of bitcoin, it is expected to fill up at least 0.75 Daily Gann Square up to 97 percent which will be 135-150 k for this bullish cycle .
Safe trades and good luck.

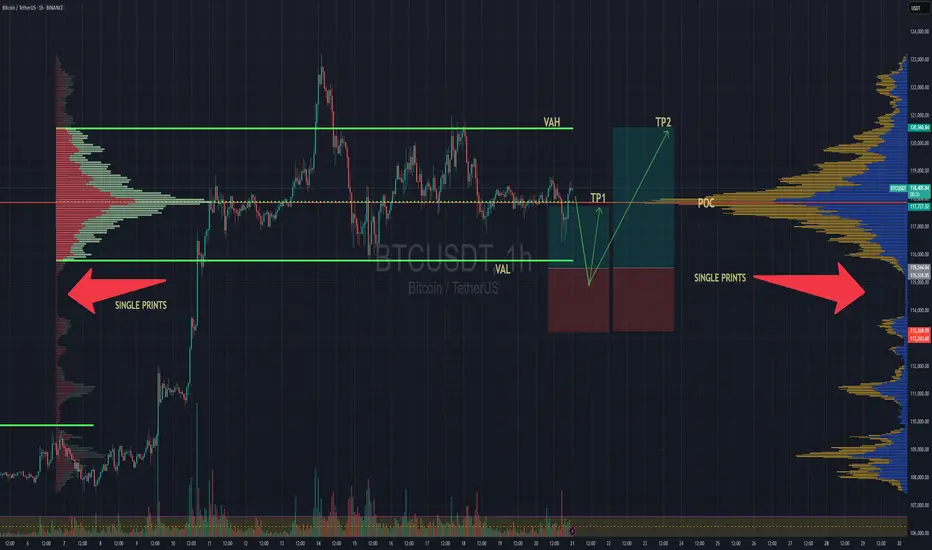
BTC Balanced Volume Profile BTC is now trading in a textbook D-Shape Volume Profile. In english - Buyers & Sellers are happy to transact here and will stay inside the value area & consolidating sideways until further notice.
Consolidation at POC is a signature of this profile, and one of the easiest and least stressful trade setups because now, your mission, should you chose to accept. Is to fade the Highs (VAH) and Lows (VAL) and avoid the middle unless you love donating money to the market.
I'll have buy limit orders waiting right below the VAL where we have the single prints. It doesn't get any easier than this.
Doesn't mean price cant rip through, but this is always the best entry with less risk, especially when the single prints have not been tested yet..
BINANCE:BTCUSD CME:MBT1!
Structural and Technical Analysis of Crypto + BTC + Altcoins + TStructural and Technical Analysis of Crypto + BTC + Altcoins + Totals + Dominance
🔔 Follow me & smash that rocket 🚀 if you find this useful! Let's ride the next wave together!
🕒 Timeframe: 4H
🧠 Strategy: Customized Dow Theory + Structural
---
🟡 A critical moment for the market:
Many coins, including top 10 alts, are currently sitting on major key levels. Yes, you can go long — but only IF volume supports the move.
📈 That means we must keep an eye on:
TOTAL, TOTAL2, TOTAL3
BTC.D, USDT.D
---
💎 Bullish Trigger Conditions:
✅ BTC.D must show strong red candles (dominance falling)
✅ USDT.D must break below 4.22-4.23 (money flowing out of stablecoins)
✅ TOTAL must break 3.85T
✅ TOTAL2 must break 1.48T
✅ TOTAL3 must break 1.05T
🔴 If all these confirm, it could be a great trigger to enter alt positions.
---
🔍 BTC Outlook
As previously mentioned:
🟥 If sellers want BTC below $115K, they need to break it fast and sharp — slow breakdowns won’t work due to buyer activity.
🟨 Bullish trend requires a break above $120K.
📊 Most likely scenario? Ranging between $115K - $120K
⚠️ BTC Dominance plays a key role here. If dominance drops while BTC ranges, alts could explode.
---
💸 USDT.D Critical Level:
A clean breakdown of 4.23 on USDT.D = 🚀 Funds rotating into alts
---
✅ Coins To Watch (Long Setup Only IF Above Conditions Hold):
♦️BNB
enter:741.00
Sl: 786.13
♦️ETH
enter:3750
Sl: 3480
♦️SUI
enter:4.10
Sl:3.40
♦️XRP
enter:3.25
Sl:2.92
♦️LINK
enter: 18.60
Sl: 17.4
♦️AAVE
enter:295
Sl:276
♦️ADA
enter:0.8405
Sl: 0.7628
♦️SOL
enter: 192.40
Sl:177
♦️DOGE
enter:0.249
Sl:0.220
🔁 Note: First SUI trigger was 3.80 — next key level is 4.10.
---
⚠️ Important Notes:
Today is Saturday, expect low volume
Manage risk ⚠️ and avoid aggressive Martingale strategies
High chance of fake breakouts
Levels being tested might just be lower highs in a bearish structure
❗️Even for bearish continuation, volume increase is key
---
🟢 If you liked this post, don’t forget to Follow & Hit the 🚀 Rocket to stay updated on live setups and strategic insights!
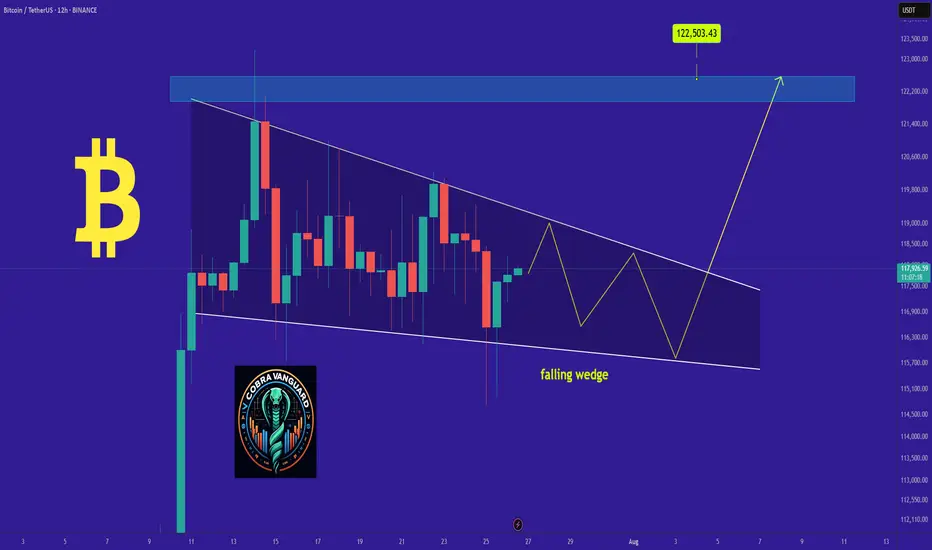
BITCOIN's Situation (12h) !!!So if you pay attention to the TON chart you can see that the price has formed a Ascending wedge which means it is expected to price move as equal as the measured price movement.( AB=CD )
NOTE: wait for break of the WEDGE .
Best regards CobraVanguard.💚
TradeCityPro | Bitcoin Daily Analysis #137👋 Welcome to TradeCity Pro!
Let’s go over the Bitcoin analysis. I’m making a change to how I analyze Bitcoin — I will no longer include indicators like dominance charts.
🔍 From now on, I’ll be analyzing Bitcoin in daily, 4-hour, and 1-hour timeframes only.
📅 Daily Timeframe
On the daily timeframe, Bitcoin is in a strong uptrend that started from the 78,397 level and in two bullish legs has reached the 122,733 zone.
✅ This level, along with the 0.618 Fibonacci Extension, has created a strong resistance zone. Although price has attempted multiple times to break into or above this area, it has not yet succeeded in closing a candle above or inside the range.
🎲 We also have a curved trendline from higher timeframes, which the price is reacting to even on the daily chart. Currently, the price is near this trendline. There is a possibility that price consolidates over time until it reaches this trendline and then begins its next bullish leg.
📊 If that happens, breaking 122,733 or 120,140 would be triggers for opening a long position on the daily timeframe.
I do not recommend buying Bitcoin on spot right now, because I believe we’re close to the top of this bullish cycle, and this current leg might be the last one.
⭐ A breakout of 76.50 on the RSI would be a strong confirmation of bullish momentum, and would mark the continuation of the uptrend.
🔑 If we get a pullback, the price could correct to dynamic zones like SMA25 or SMA99. Important static support levels are at 110,183 and 100,763.
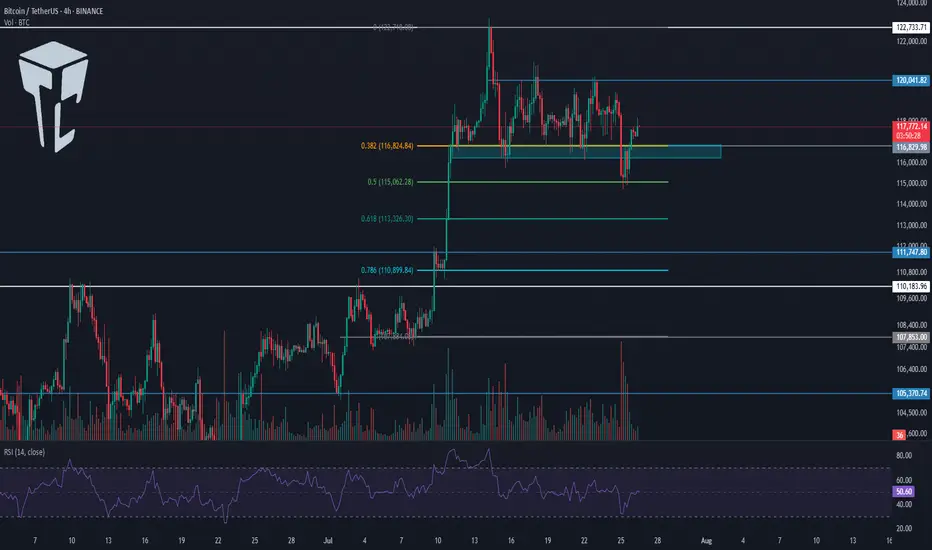
⏳ 4-Hour Timeframe
In the 4-hour chart, we can see more details of the bullish leg. After the sharp move to 122,733, a correction phase began, forming a range box.
💥 The bottom of the box is around 116,829, which I’ve marked as a zone. It also overlaps with the 0.382 Fibonacci, making it a very important PRZ (Potential Reversal Zone).
The top of the range is at 120,041.
🧩 Yesterday, price made a fakeout to the downside. As you can see, it dumped hard with heavy selling volume and hit the 0.5 Fibonacci level, but couldn’t hold there and quickly bounced back above 116,829.
🧲 Today, I think it's better not to go below the 4-hour timeframe and avoid getting caught up in small market noise.
A break above 120,041 can trigger a long entry.
Another breakdown from the box might trigger a deeper correction.
❌ Disclaimer ❌
Trading futures is highly risky and dangerous. If you're not an expert, these triggers may not be suitable for you. You should first learn risk and capital management. You can also use the educational content from this channel.
Finally, these triggers reflect my personal opinions on price action, and the market may move completely against this analysis. So, do your own research before opening any position.
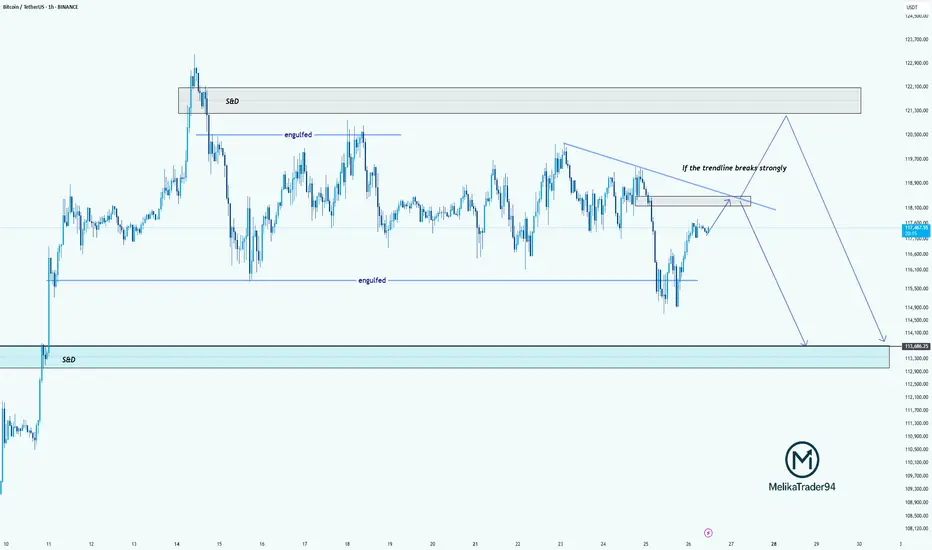
TC Analysis – Watching That Trendline Closely!Hello guys!
Bitcoin is currently approaching a key decision point. As highlighted on the chart, we’ve got a descending trendline acting as strong resistance. If this trendline breaks with strength, we may see price push up into the supply & demand zone around 121,000–122,000 before potentially reversing.
However, if the trendline holds, this current move could be a retest, setting up for another drop. The engulfed level at 114,000 has already been tested once, and if we break below that again, the price could slide down into the S&D demand zone around 113,000–112,000.
summry:
Trendline resistance is critical right now
Watch for a strong breakout or a fakeout & rejection
Possible bearish continuation if we fail to reclaim above 118,500
Let’s see how BTC reacts around this zone.
Fake Breakout at $116,522 Could Signal BTC Bull Continuation📈 Fake Breakout at $116,522 Could Signal BTC Bull Continuation — Watch Altcoin Triggers
After a fake breakdown below $116,522, Bitcoin is showing signs of resuming its uptrend.
A key bullish signal was yesterday's daily candle closing above this level — maintaining structure and giving bulls hope.
🔍 Current Strategy:
For BTC, I suggest watching $119,151 as a long trigger, only if BTC Dominance is rising.
If BTC.D isn’t rising, then it’s better to focus on altcoin long setups.
I’m still not opening any short positions — structure remains bullish, and risks of fake breakdowns remain high.
---
💬 Altseason loading? Drop your favorite alt setups in the comments!

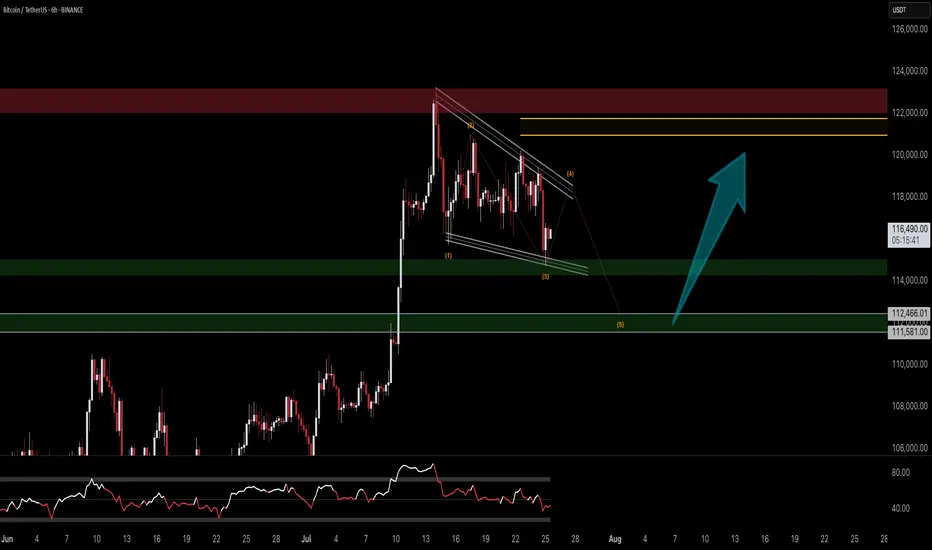
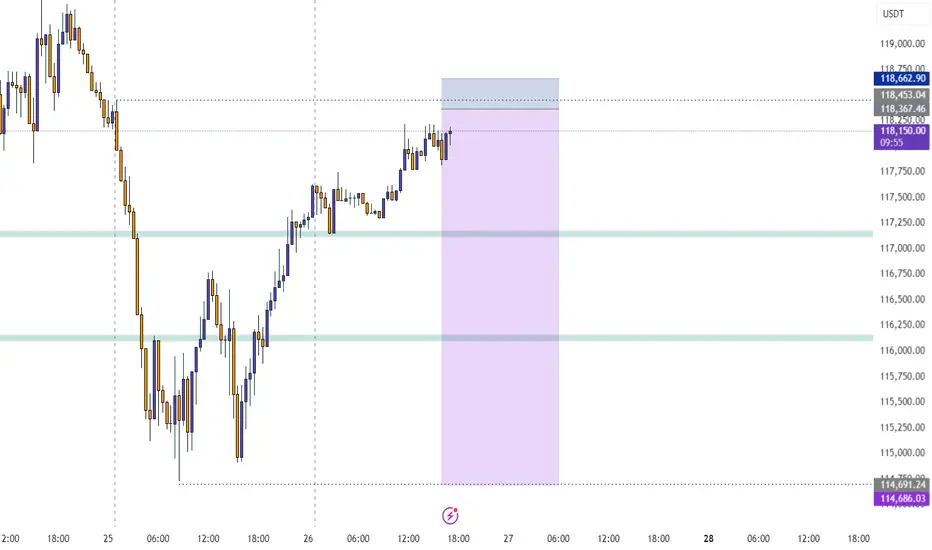
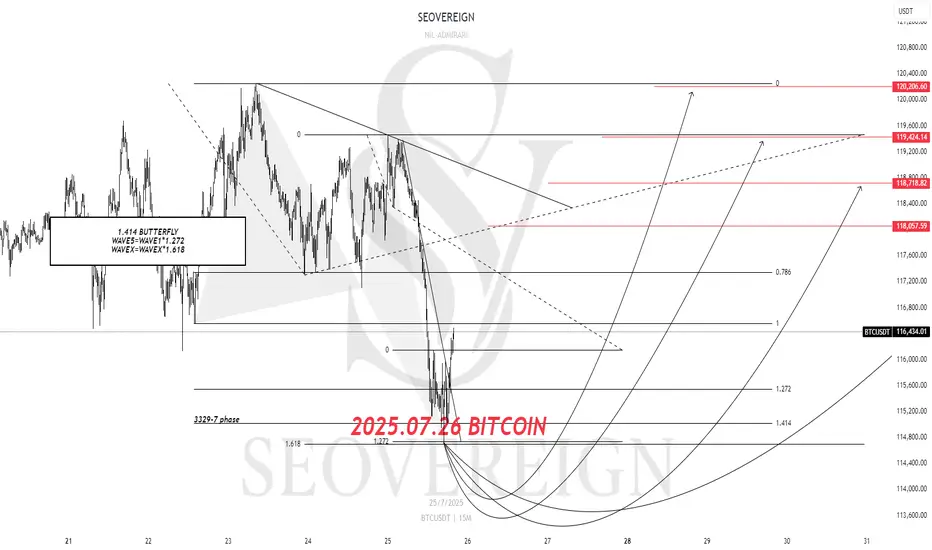
[SeoVereign] BITCOIN BULLISH Outlook – July 26, 2025The previous idea did touch the average TP price, but showed a rather disappointing rebound, so I will once again attempt to capture the starting point of the rebound. It is still considered that one more upward wave remains.
Accordingly, the TP is suggested at 118,057 USDT.
As always, I will carefully observe how the chart develops over time and update this idea with further explanations by organically integrating its specific interpretations and underlying rationale.
Thank you.
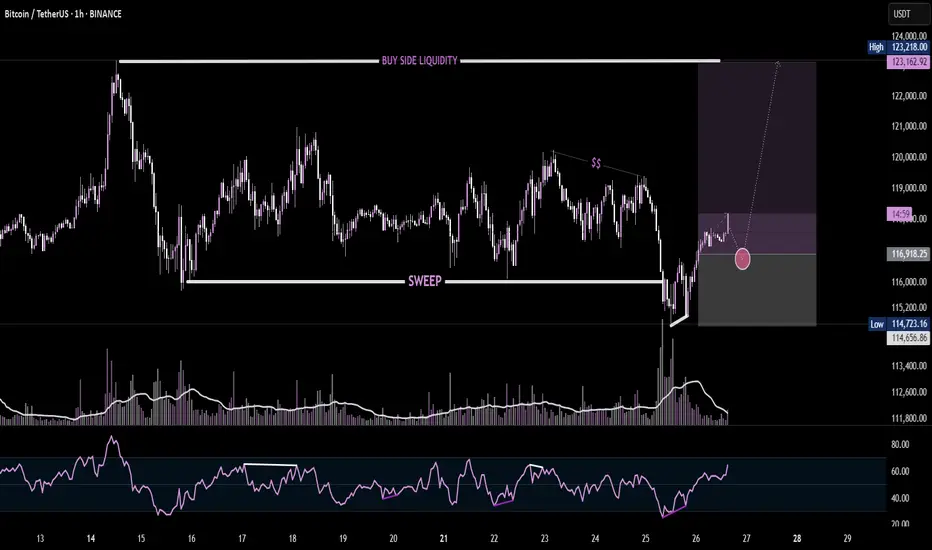
BTC Liquidity Grab + BounceBitcoin just completed a liquidity sweep below the recent low, grabbing stop-losses before reversing sharply. This move often signals smart money accumulation, as shown by the strong bullish reaction off the demand zone. Aiming for the Buy-Side Liquidity (BSL) above $123K. Volume spike and RSI divergence further validate the bullish narrative.
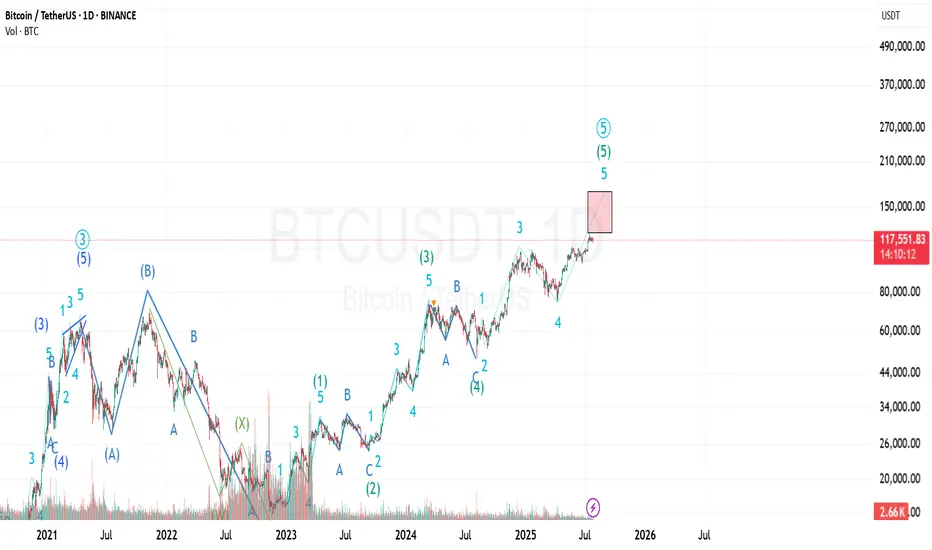
Bitcoin Prediction UpdateI've just modified the wave count and still the previous analysis is valid...
I'm not sure about the target of the last wave (the 5th of 5th wave) because it can be an extended wave...
The shown box is where I'll investigate to find any ending pattern...