BTCUST trade ideas

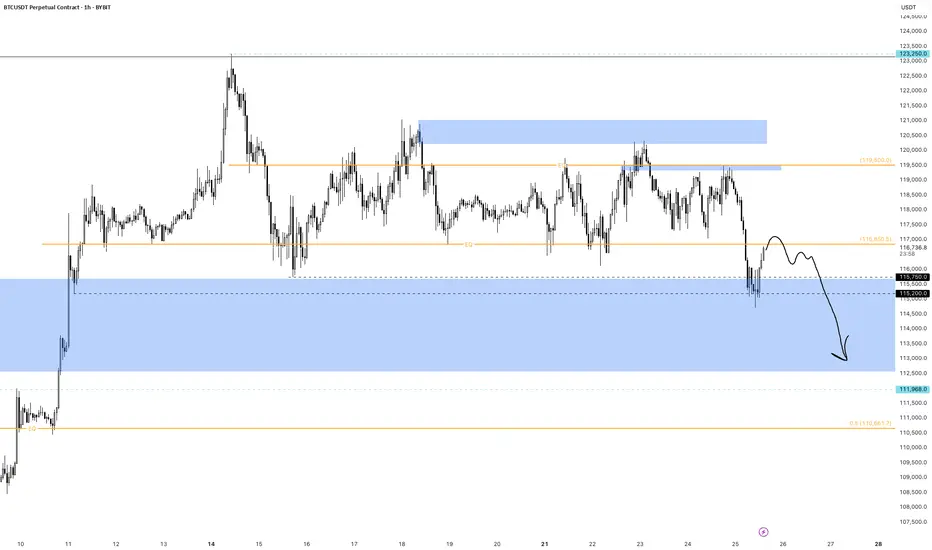
Bearish retest or deviation for Bitcoin117000 is key. it’ll decide whether this is a bearish retest or just a deviation. i believe it’s a bearish retest and we’re setting up for 110-114 next.
last drop came when price kept failing to hold above EQ. now we’re below the EQ of the ath/previous ath range. if price can’t reclaim that either, a deeper drop is likely. a 12h close above EQ could open the path toward 120-121k, but that’s the less probable case in my view.
why? nasdaq and spx are in premium zones (fib extensions), and holidays are near for big players. as profit taking hits there, pressure will echo here. simple cause, predictable effect.
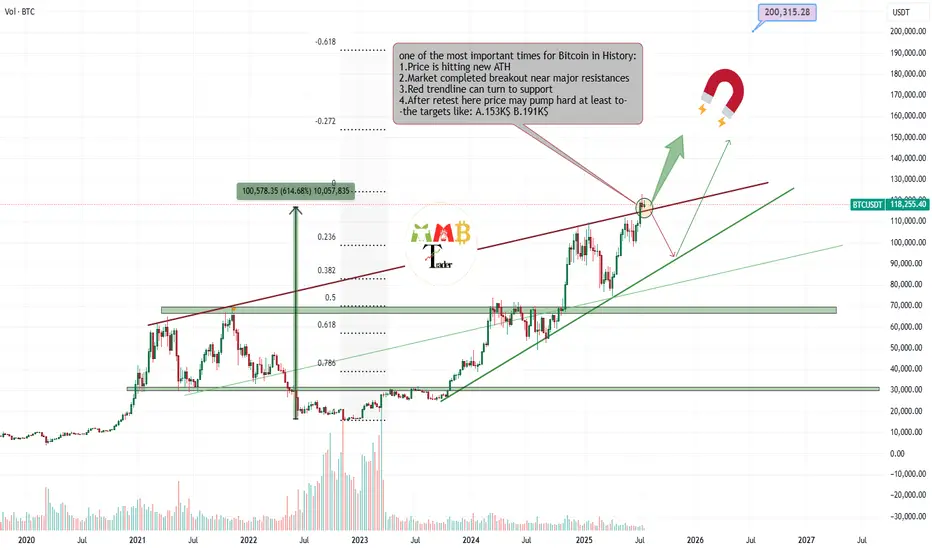
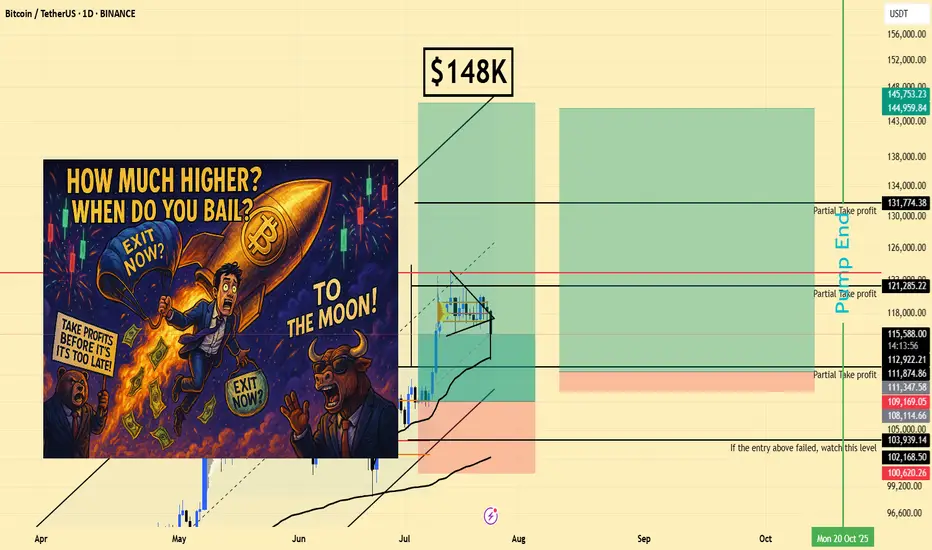
Bitcoin is retesting Critical zone for targeting almost 200K$Most traders around world now don't know what to do with their own trades or spot holdings, because some are in profit and how doubt of more pump and are still holding and some others miss this massive pump and think it can rest and fall now and it is not a good time to enter long.
And many other questions and thoughts At this time is simply check the chart and do these simple steps which are some mentioned and some not due to huge content.
Delete all of my previous drawings and start new Charting the price and see new trendlines or supports and resistances formed.
Then technically check the volume and breakouts and ... once again and here for Bitcoin i still find out chart looks extremely bullish to me and at this orange zone which is price is getting a little slow some important things may happen.
30% is expecting price fall below red trendline again and see short-term fall.
70% is expecting price complete retest of breakout here or pump more ASAP and then hitting targes like 150K$ and more for $BTCUSDT.
DISCLAIMER: ((trade based on your own decision))
<<press like👍 if you enjoy💚
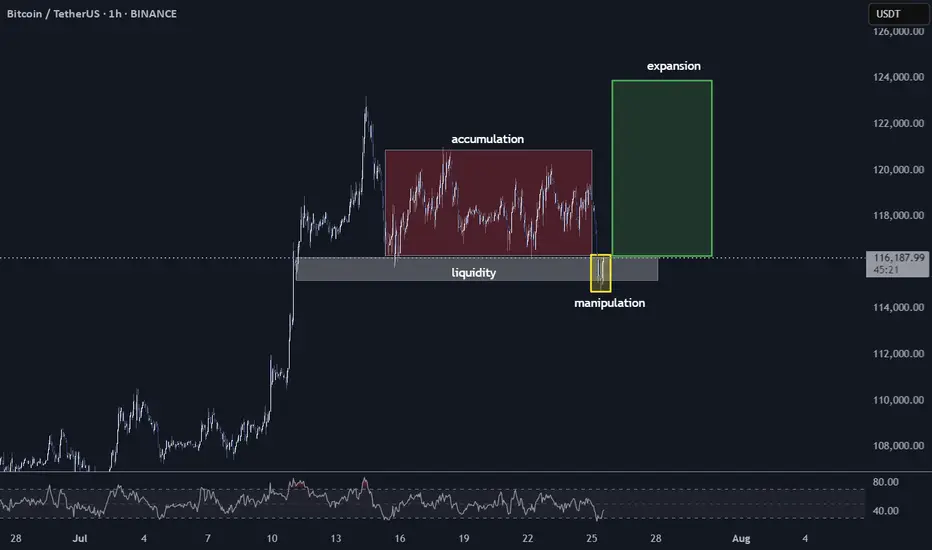
Bitcoin New ATH? A Classic Setup for ExpansionWe've just witnessed a textbook price action sequence unfold. After a period of what I've marked as 'accumulation' (that red box), where price consolidated, we saw exactly what we were looking for: the 'liquidity' below that range (the grey box) has been swept. That yellow bar clearly indicates the 'manipulation' phase, pushing below the perceived support to trap early longs and trigger stop-losses. This move has successfully taken out the easily accessible liquidity.
Now, with that essential 'clean-up' complete and the order books likely reset, the path of least resistance appears to be upwards. Furthermore, if you look down at the RSI, it's currently sitting in a relatively oversold or at least low position, providing additional confluence for a potential bullish move.
My current thesis is that we are now primed for an 'expansion' phase (the green box). The target here, based on this setup, is a retest of the All-Time Highs (ATH) and potentially beyond. We've seen this pattern play out before: accumulation, a liquidity grab/manipulation phase, and then a strong push higher. As always, manage your risk, but the charts are certainly hinting at significant upside potential from here.
BTC key zones for continueBTC needs to hold this zones for continue and there is some liquidity. Because dominance get breakout we want to see much higher prices for altcoin but maybe we will see sharp correction and continue up.
Feel free to ask for some altcoin analysis.

BTC 4H Chart Uptrend
➡️ My wave count considers we're now in blue wave 4, and this corrections should finish soon.
➡️ The 125k round number is an interesting target for green wave III.
➡️ This scenario is valid as long as we stay above blue 1 top (at 110.529).

Bitcoin Btc usdt Daily analysis
Time frame daily
If btc can't break the green uptrend line strongly I guess it drops to 87$
But if btc can continue it's sharp way , my target is 170 $

BTCUSD | Long | Volume Confirmation (Jul 25, 2025)BTCUSD | Long | Breakout Momentum & Volume Confirmation (Jul 25, 2025)
1️⃣ Quick Insight:
Bitcoin is showing strong bullish momentum after breaking out of its triangle pattern with volume. The move looks set to continue, and we may see higher levels if momentum holds.
2️⃣ Trade Parameters:
Bias: Long
Stop Loss: $109k (risk-adjusted "invisible" stop)
TP1: $121k (partial take profit)
TP2: $131k (final target if momentum extends)
3️⃣ Key Notes:
Short-term, price could test $96k before reaching higher targets.
Longer-term outlook points to potential upside between $112k–$120k if structure holds.
Watching reaction closely around the $109k area as it will determine if the uptrend stays intact.
I expect the pump phase to potentially wrap up around October 20, 2025.
S&P 500 is also at key levels, and its direction could influence Bitcoin’s momentum.
💬 What are your targets for Bitcoin? 140k? 180k? 240k? Drop your thoughts below!
"Please LIKE 👍, FOLLOW ✅, SHARE 🙌 and COMMENT ✍ if you enjoy this idea! Also share your ideas and charts in the comments section below! This is best way to keep it relevant, support us, keep the content here free and allow the idea to reach as many people as possible."
Disclaimer: This is not financial advice. Always do your own research. This content may include enhancements made using AI.
Understanding ROI in Crypto: More Than Just a NumberHello, Traders! 👏
Return on Investment (ROI) is often the first metric new investors focus on when evaluating an asset, a strategy, or even their trading performance. It’s easy to see why. It's simple, intuitive, and widely used across both traditional finance and the cryptocurrency sector. One formula, and suddenly you have a "score" for your investment. Green is good. Red is bad. Right?
Well…Not quite.
In the crypto market, where price swings can be extreme, timelines are compressed, and risk profiles differ significantly from those in traditional markets, a simplistic ROI figure can be dangerously misleading.
A 50% ROI on a meme coin might look great, until you realize the token is illiquid, unbacked, and you're the last one holding the bag. Conversely, a 10% ROI on a blue-chip crypto asset with strong fundamentals might be significantly more meaningful in risk-adjusted terms.
In this article, we'll delve beyond the basic formula and break down what ROI really tells you, how to use it correctly, and where it falls short. Let's go!
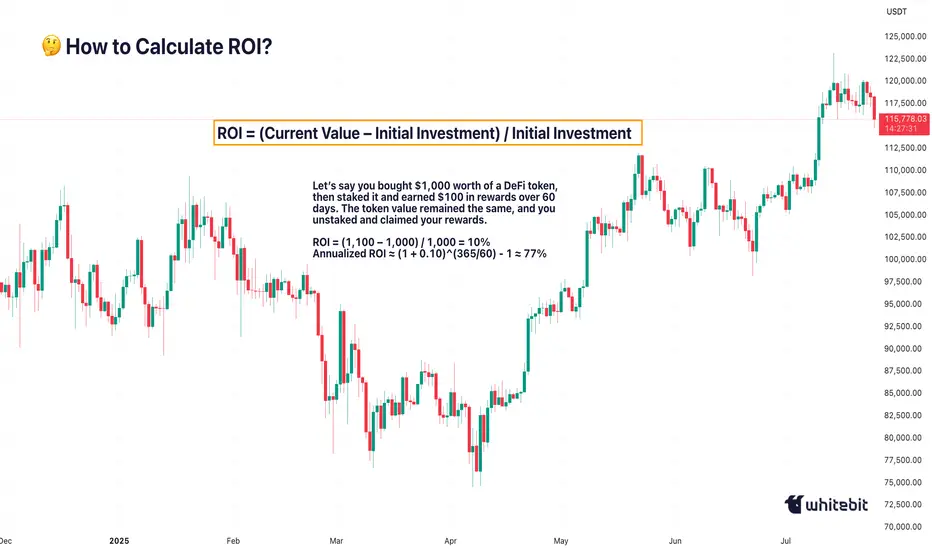
What Is ROI and How Do You Calculate It?
The Basic Formula for Return on Investment Is: ROI = (Current Value – Initial Investment) / Initial Investment.
Let’s say you bought ETH at $2,000 and sold it at $2,600: ROI = (2,600 – 2,000) / 2,000 = 0.3 → 30%. Seems straightforward. You made 30% profit. However, crypto is rarely straightforward.
What if you held it for 2 years? Or 2 days? What if gas fees, staking rewards, or exchange commissions altered your real costs or returns? Did you include opportunity cost and the profits missed by not holding another asset? ROI as a raw percentage is just the beginning. It’s a snapshot. However, in trading, we need motion pictures, full narratives that unfold over time and within context.
Why Time Matters (And ROI Ignores It)
One of the most dangerous omissions in ROI is time.
Imagine two trades: Trade A returns 20% in 6 months. Trade B returns 20% in 6 days.
Same ROI, very different implications. Time is capital. In crypto, it’s compressed capital — markets move fast, and holding a position longer often increases exposure to systemic or market risks.
That’s why serious traders consider Annualized ROI or utilize metrics like CAGR (Compound Annual Growth Rate) when comparing multi-asset strategies or evaluating long-term performance.
Example: Buying a Token, Earning a Yield
Let’s say you bought $1,000 worth of a DeFi token, then staked it and earned $100 in rewards over 60 days. The token value remained the same, and you unstaked and claimed your rewards.
ROI = (1,100 – 1,000) / 1,000 = 10%
Annualized ROI ≈ (1 + 0.10)^(365/60) - 1 ≈ 77%
Now that 10% looks very different when annualized. But is it sustainable? That brings us to the next point…
ROI Without Risk Analysis Is Useless
ROI is often treated like a performance badge. But without risk-adjusted context, it tells you nothing about how safe or smart the investment was. Would you rather: Gain 15% ROI on a stablecoin vault with low volatility, or Gain 30% ROI on a microcap meme token that could drop 90% tomorrow?
Traders use metrics such as the Sharpe Ratio (which measures returns versus volatility), Maximum Drawdown (the Peak-to-Trough Loss During a Trade), and Sortino Ratio (which measures returns versus downside risk). These offer a more complete picture of whether the return was worth the risk. ⚠️ High ROI isn’t impressive if your capital was at risk of total wipeout.
The Cost Side of the Equation
Beginners often ignore costs in their ROI math. But crypto isn’t free: Gas fees on Ethereum, trading commissions, slippage on low-liquidity assets, impermanent loss in LP tokens, maybe even tax obligations. Let’s say you made a 20% ROI on a trade, but you paid 3% in fees, 5% in taxes, and lost 2% in slippage. Your actual return is likely to be closer to 10% or less. Always subtract total costs from your gains before celebrating that ROI screenshot on X.
Final Thoughts: ROI Is a Tool, Not a Compass
ROI is beneficial, but not omniscient. It’s a speedometer, not a GPS. You can use it to reflect on past trades, model future ones, and communicate performance to others, but don’t treat it like gospel.
The real ROI of any strategy must also factor in time, risk, capital efficiency, emotional stability, and your long-term goals. Without those, you’re not investing. You’re gambling with better math. What do you think? 🤓
Bitcoin (BTC): OrderBook is Hinting To $115K Bounce | Thoughts?Bitcoin has recently broken the $116K local neckline zone and reached the $115K area, which has been at our attention due to huge orders sitting there.
What we are thinking is that this zone will be a good bounce area, which should lower the price to $120K.
Either way, this zone is important, so keep an eye on it!
Swallow Academy

$BTC Bullish falling wedge pattern (Daily TF)Bitcoin forms a falling wedge pattern on the daily time frame. This pattern is a continuation pattern with the target around $128,000.
$128K SOON

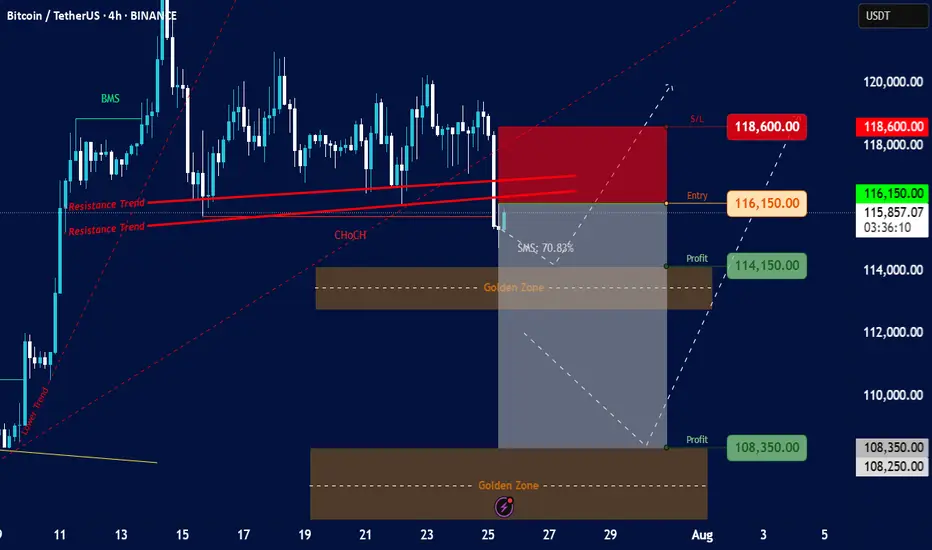
Bitcoin/TetherUS (BTC/USDT) on a 4-hour timeframeOverall Trend & Price Action:
Prior Uptrend: The chart shows a clear uptrend leading up to around July 15th, marked by an "Order Trend" line (dashed green).
Break of Market Structure (BMS): A "BMS" (Break of Market Structure) label is visible, suggesting a significant shift in market dynamics, likely indicating the end of the previous uptrend or a strong pullback.
Consolidation/Distribution: After the initial uptrend, the price appears to have entered a period of consolidation or potential distribution between approximately $115,000 and $120,000.
Resistance Trends: Several "Resistance Trend" lines (red) are drawn, indicating areas where the price has faced selling pressure. A recent breakdown below these resistance lines is evident.
Change of Character (ChoCH): A "ChoCH" label is present, which often signifies a change in the prevailing market sentiment or trend, confirming the shift away from the strong bullish momentum.
Current Price & Trading Setup:
Current Price: The current price is around $115,849.44.
Proposed Entry: The chart suggests an "Entry" point at $116,150.00. This is positioned just above the current price and within a potential retest zone of the broken resistance.
Stop Loss (S/L): The "S/L" is set at $118,600.00, indicating a risk management level if the trade goes against the intended direction.
Profit Targets (Profit):
First Profit Target: $114,150.00, located just above the first "Golden Zone."
Second Profit Target: $108,350.00, situated within the second "Golden Zone."
Golden Zones: Two "Golden Zones" (brown shaded areas) are identified, which are typically areas of significant support/demand or Fibonacci retracement levels where price is expected to react. The current setup seems to target these zones for profit-taking.
SMS: 70.83%: This "SMS" value (likely referring to "Smart Money Score" or a similar metric) of 70.83% suggests a strong bearish bias or conviction in the current setup.
Interpretation & Potential Strategy:
The analysis suggests a bearish trading setup for BTC/USDT.
The presence of BMS, ChoCH, and the breakdown below resistance trends indicate a potential shift from bullish to bearish sentiment or a significant correction.
The proposed short entry at $116,150.00 aims to capitalize on further downward movement.
The profit targets align with identified "Golden Zones," suggesting that these are anticipated areas of support where the bearish momentum might temporarily stall or reverse.
The significant "SMS" value reinforces the bearish outlook.
Risks & Considerations:
Reversal from Golden Zones: While profit targets are set at Golden Zones, these are also potential areas for price reversals if strong buying interest emerges.
False Breakout/Breakdown: The market can always surprise, and a re-entry above the stop-loss level would invalidate the current bearish setup.
Market Volatility: Cryptocurrency markets are highly volatile, and rapid price movements can occur.
News Events: Unforeseen news or macroeconomic events could significantly impact price action.
BTC Symmetrical Triangle – Decision Time Soon
BTCUSDT Idea (2H Chart)
BTC is consolidating inside a symmetrical triangle, creating pressure for a breakout. Price is currently ranging between 116K–120K, with volatility compressing.
Patience is key here — don’t rush entries.
A confirmed breakout or breakdown will give the real direction.
Break above the triangle = bullish continuation
Break below = further correction ahead
Wait for 2H close outside the pattern with volume
Watch levels:
* Upside: 120K → 124K → 128K
* Downside: 116K → 112K → 108K
Setup is maturing — breakout is just a matter of time. Let the chart lead, not emotions.

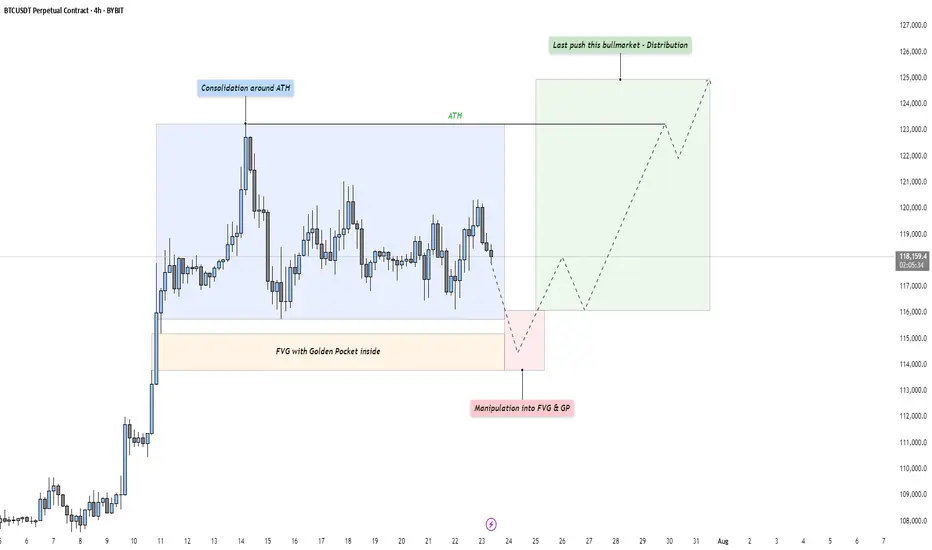
BTC - Last Push: Consolidation, Manipulation & DistributionMarket Context
After a strong upward impulse, Bitcoin has entered a mid-term consolidation phase just below its all-time high. This kind of price action is typical as the market digests recent gains and larger participants prepare for the next move. These pauses in momentum often precede either trend continuation or a reversal — and the structure here suggests we might be witnessing the former, but not without a final shakeout.
Phase 1: Consolidation Around the All-Time High
The first phase is defined by a tight range just beneath the all-time high, where price moves sideways in a balanced struggle between buyers and sellers. This is often where retail participants become overly bullish, anticipating a breakout. However, the lack of a sustained move higher indicates that smart money may be waiting for better entries — or preparing to engineer liquidity to fuel the next move.
Phase 2: Manipulation Into the Fair Value Gap and Golden Pocket
Directly below the range lies a clean Fair Value Gap, with a Golden Pocket retracement nestled inside it. This zone represents a strong area of interest. A sharp move into this area would likely sweep late long positions and trigger stop-losses from range traders — a classic manipulation pattern. This phase serves two purposes: collect liquidity and offer favorable pricing for larger players looking to position themselves before expansion. Watch for signs of absorption or reversal as price enters this zone.
Phase 3: Expansion – The Last Push of the Bull Market?
Following the liquidity sweep and reaction from the Fair Value Gap and Golden Pocket zone, we could see a renewed expansion toward higher highs. This is the phase where volume returns, sentiment shifts, and price accelerates. If this plays out, it could mark the final leg of this bull cycle — potentially driving Bitcoin to new all-time highs with strength.
Execution Thoughts
If you're looking to participate, it's wise to wait for a confirmation signal on a lower timeframe — like the 5-minute or 15-minute chart — once price enters the Fair Value Gap and Golden Pocket zone. Watch for a strong bullish reaction, break of structure, or shift in order flow to signal that buyers are stepping back in.
Final Thoughts
Let the market come to your level and don’t chase moves without context. These three phases — consolidation, manipulation, and expansion — are timeless patterns seen across all markets. Stay patient, stay objective, and react with clarity.
If this breakdown helped you see the setup more clearly, a like would mean a lot — and I’d love to hear your thoughts in the comments! Are you watching the same zone, or do you see something different?
Cutting-edge Tech, Outperforming Traditional Tools Until now my AI has been defying market odds
The forecasts work on all timeframes, short, medium or long range
My AI is outperforming traditional tools, in real time, thats right...with real time validation
The question is, will the crown remain intact or be dethroned??

bitcoin, Stay heavy on positionsbitcoin, Stay heavy on positions
Short-term overbought is noise. Focus on the bigger picture. Keeping my position heavy—no plans to reduce yet

Bitcoin’s Epic Run from 80K to 120K: What’s Next for BTC?Yo traders, it’s Skeptic from Skeptic Lab! 🩵 Diving into Bitcoin’s wild ride from 80K to 120K—breaking down the key supports, resistances, and what’s next for BTC.
From the $76k bounce to smashing $110K, we’re eyeing the $120K PRZ. Will it correct or keep soaring? Check the video for the full scoop! Drop your thoughts or coin requests in the comments, boost if it vibes & Let’s grow together!

BTC Unfolds in Complex Way After Hitting 123KBTC Unfolds in Complex Way After Hitting 123K
Bitcoin recently reached a historic all-time high near 123,200, marking a strong bullish run. Over the past two weeks, BTC has been consolidating, showing signs of a potential upward movement.
However, today's price action disrupted that bullish setup and introduced bearish momentum.
At this moment, two scenarios are possible:
1️⃣ Continued Bullish Momentum: The prevailing trend remains strongly bullish. Selling BTC now is risky, as there's a high chance it could resume its aggressive rise again.
False Bearish Breakout: The recent bearish signal may be misleading. BTC may be forming a broader accumulation structure, paving the way for another upward move.
2️⃣ Profit-Taking Phase: This bearish shift might be valid, suggesting that Bitcoin is entering a profit-taking cycle after an extended rally. If this scenario unfolds, a deeper correction may follow, aligning with the current technical pattern.
You may find more details in the chart!
Thank you and Good Luck!
PS: Please support with a like or comment if you find this analysis useful for your trading day

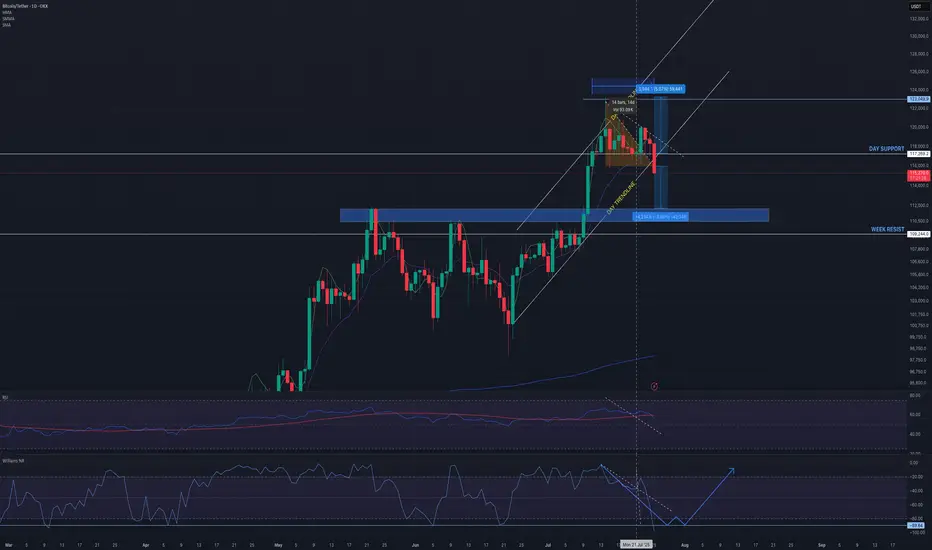
BTC is in a macro-uptrend but undergoing a healthy correction
Structure: BTC recently broke out from a local ascending wedge and is now pulling back toward support.
Current Price: ~$115,250 (at time of chart).
Day Support: ~117,000 (currently lost).
Next Key Support: ~109,244 (marked as WEEK RESIST, now potentially flipping to support).
Upside Target: 123,000 zone remains a key resistance, and aligns with projected measured move from wedge.
RSI: Just broke downward from overbought (divergence present). Currently ~59. A bearish signal in short-term momentum.
Williams %R: Deep in oversold, suggesting short-term bounce potential, but may be early.
200 SMA (blue): Holding well below current price — long-term uptrend remains intact.
Forecast Scenarios:
Base Case: BTC pulls back to 111K–109K, forms support, and continues the uptrend toward 123K.
Bullish Alt : If macro surprises (e.g., ETH ETF approval or FOMC dovish pivot), BTC reclaims 117K swiftly and rallies straight to 131K.
Bearish Risk: Break below 109K support, leading to retest of 98K (200 SMA area).
BTC USDT ANALYSIS CRYPTOCAP:BTC is currently correcting after a long bull ride and knowing your entry level as a trader is very important. Look at this chart and make informed decision

Volatility Period: July 24-26
Hello, traders.
If you "Follow", you can always get the latest information quickly.
Have a nice day today.
-------------------------------------
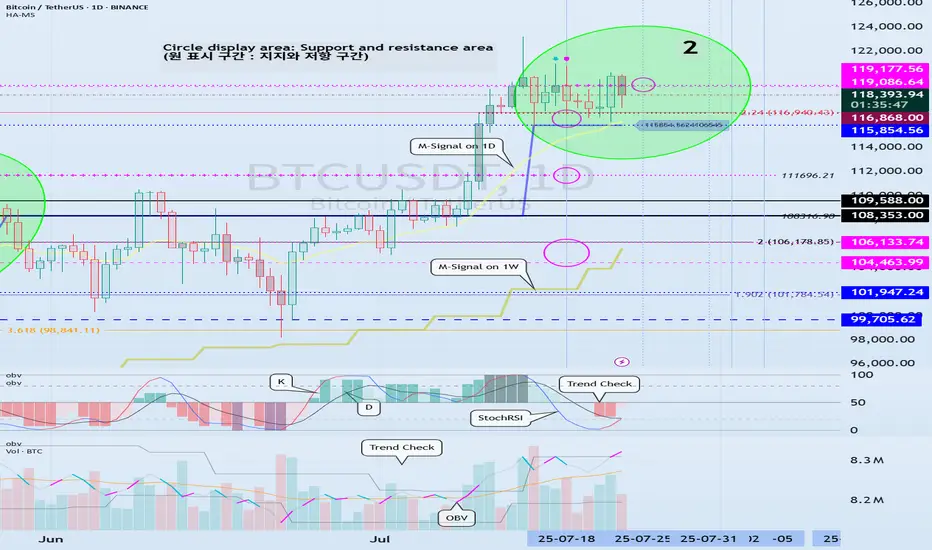
(BTCUSDT 1D chart)
BTC is in a step up trend.
Looking at the bigger picture, it can be seen that it is in the second step up trend.
The important volatility period in this step-up is expected to be around August 2-5 (up to August 1-6).
Therefore, we need to look at what kind of movement it makes as it passes through the previous volatility period of around July 25 (July 24-26) and around July 31 (July 30-August 1).
In other words, we need to check which section is supported and which section is resisted, and see if it breaks through that section.
What we can see now is that it is checking whether there is support in the 115854.56-119086.64 section, that is, the HA-High ~ DOM (60) section.
Since the M-Signal indicator on the 1D chart has risen to the 115854.56 point, the key is whether it can receive support at the 115854.56 point and rise.
If it falls below the M-Signal indicator of the 1D chart and shows resistance, it is likely to meet the M-Signal indicator of the 1W chart.
This flow is an interpretation of the separation learned when studying the price moving average.
Therefore, we can see that the maximum decline point is when it meets the M-Signal indicator of the 1M chart.
-
Industries (coins, tokens) that are renewing the ATH are actually outside the predictable range.
Therefore, we should think of it as a situation where it is not strange whether it falls or rises at any time and think of a response plan.
Since it is currently within the predictable range, we can create a response strategy by checking whether there is support in the 115854.56-119086.64 section.
However, as I mentioned earlier, the volatility period is about to begin, so caution is required when making new transactions.
That is, you need to check whether it breaks out of the 115854.56-119086.64 range during the volatility period that continues until July 26.
And if it breaks out, you need to check whether it is supported or resisted in that area and respond accordingly.
-
The OBV indicator of the Low Line ~ High Line channel is showing a pattern of rising above the High Line.
Accordingly, if the OBV indicator is maintained above the High Line, it is expected to show an additional rise.
In accordance with this, you need to check whether the K of the StochRSI indicator shows a movement to rise in the oversold range and a transition to a state where K > D.
You also need to check whether the TC (Trend Check) indicator continues its upward trend and can rise above the 0 point.
If these conditions are met, it is expected that BTC will rise above 119086.64 or show a pattern of rising.
-
This decline created a low trend line, creating a perfect rising channel.
Therefore, we need to see how far we can go up along the rising channel created this time.
In that sense, we should pay close attention to the movement during the volatility period around July 25th (July 24-26).
-
Thank you for reading to the end.
I hope you have a successful trade.
--------------------------------------------------
- This is an explanation of the big picture.
(3-year bull market, 1-year bear market pattern)
I will explain more details when the bear market starts.
------------------------------------------------------
Btc 4hr time frame forward test3 possible scenarios,
Scenario 1 (Red): If it bounces at 1.272 and fails to break the previous high, a more bearish move is possible.
Scenario 2 (Green): This scenario involves a bounce at 1.272 and consolidation above the previous high.
Scenario 3 (Orange): This is a continuation of the bearish breakdown.
General Notes: All bounce points (indicated by the "yellow line") show a gap-up move (SMC entry area). TP3 is a good entry area, considering all confluences.

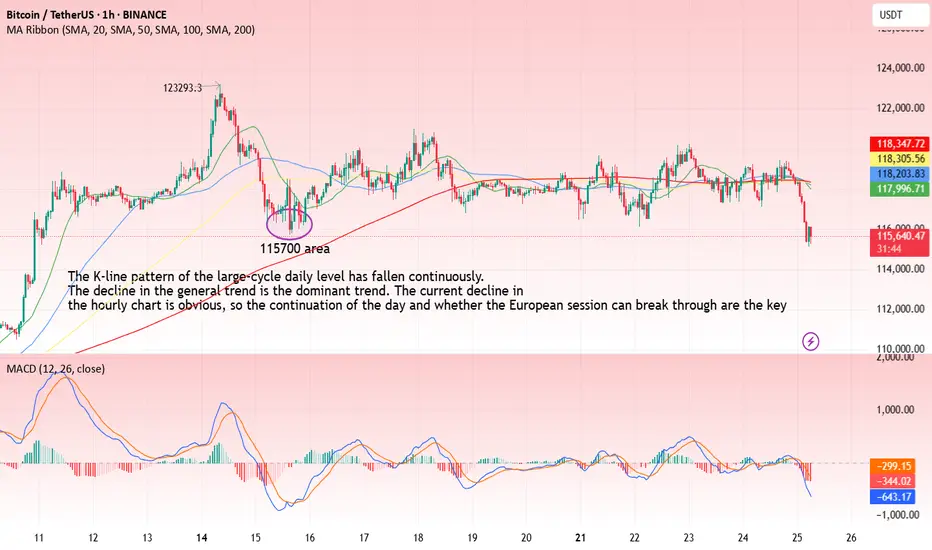
BTC-----Sell around 118000, target 116500 areaTechnical analysis of BTC contract on July 25:
Today, the large-cycle daily level closed with a small negative line yesterday, and the K-line pattern continued to fall. Although the price is at a high level, the attached indicator is dead cross. The current big trend is falling. From the overall trend and the trend law, the pullback is not strong. Instead of breaking the high, the decline is strong and continuous. Then the trend is also slowly changing. The key support position below is 115700 area, which is the position to pay attention to today and next week; the short-cycle hourly chart currently has a continuous negative K-line pattern, the price is below the moving average, and the attached indicator is dead cross. The continuation of the intraday decline is a high probability trend, and whether the European session can continue to break the previous low is the key. The current short-term resistance position is in the 118000 area.
Today's BTC short-term contract trading strategy:
Sell at the 118000 area of the pullback, stop loss at the 1118500 area, and target the 116500 area;