Tariffs incoming...July 23: Markets are booming.
August 1st: Tariffs.
I'm just saying, it might be a nice discount...
#market #finance #tariff #trump #crypto #forex #stocks #economy #trading
BTCUST trade ideas
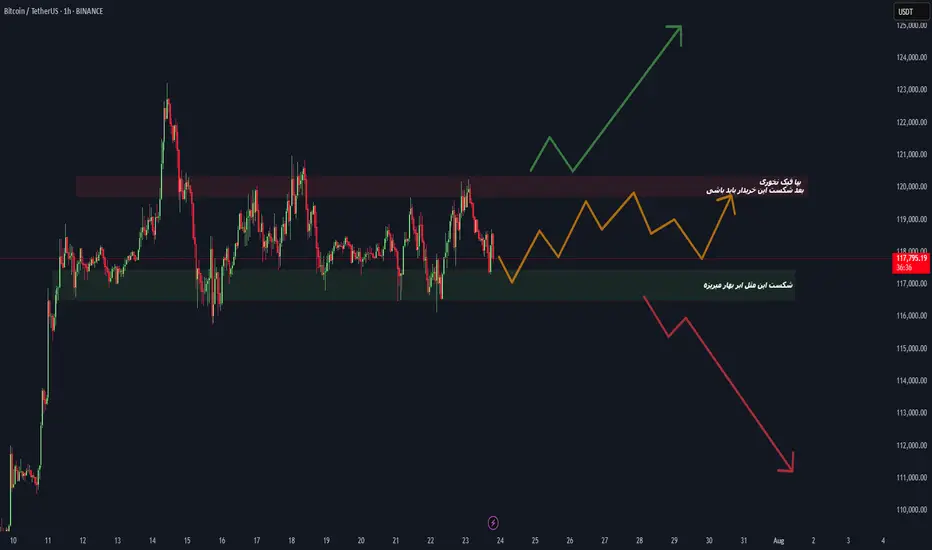
BTC at Make-or-Break Level! Which Side Are You On?#Bitcoin #BTCUSDT #CryptoTrading #TradeWithMky
📉 Scenario 1 – Bearish Breakdown
If BTC loses the green zone (~117K), expect a heavy drop toward 113K and beyond. This is a key demand zone — break it, and bears dominate.
📈 Scenario 2 – Bullish Reversal
Watch for accumulation between the green & red zones. A breakout above the red supply zone (~119K) will signal buyers are back in charge.
🗣️ As the chart says: "بیا فیک نزن، بعد شکست این محدوده باید بخری!"
🚀 Whether you're a breakout trader or a range player — this is the zone to watch.
📊 Chart by TradeWithMky — Where Altcoins Speak Louder than Bitcoin!
👇 Share your thoughts and setups below! Let's ride this move together.
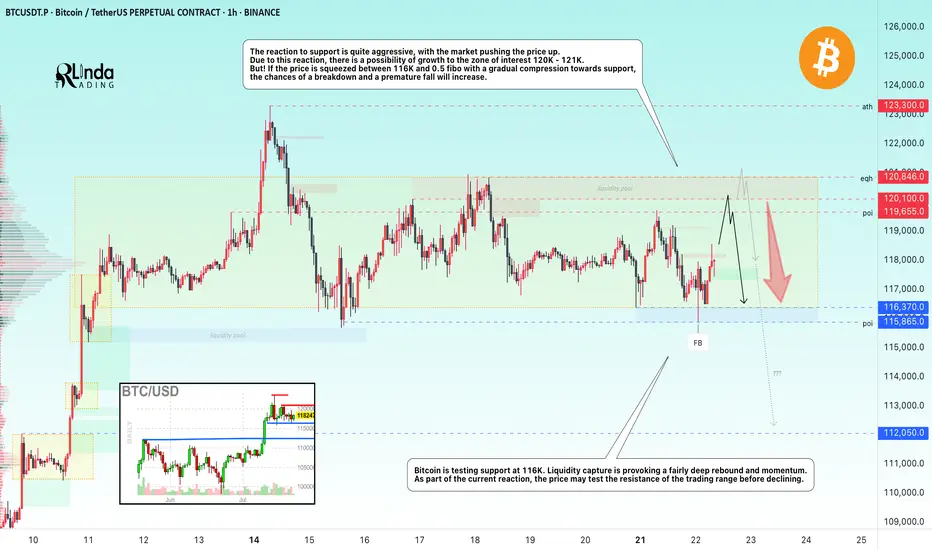
BITCOIN → Consolidation and compression to 116K. Correction?BINANCE:BTCUSDT.P continues to consolidate, with the price testing support at 116K, leaving behind the zone of interest at 120K-121K. Are there any chances for further growth?
(Alternative scenario (if growth to 120K does not occur))
Fundamentally, there is nothing particularly new, and the hype surrounding Bitcoin is stagnating. Technically, on D1, consolidation is underway with pressure from bears against the backdrop of an outflow of funds into altcoins. However, the dominance index is starting to rise, which could trigger some correction in the market. The price on the working timeframe, without updating local highs, is testing lows, and the latest retest of the liquidity zone is provoking a fairly aggressive reaction that could bring the price to retest the zone of interest at 120K-121K.
But! If the price is squeezed between 116K and 0.5 Fib with a gradual squeeze towards support, the chances of a breakdown and a premature fall will increase.
Support levels: 116370, 115860
Resistance levels: 119650, 120100
Technically, the market needs a breather or correction, which is generally a sign of health. The nuance with Bitcoin is that below 115860 there is no support until 112K, and if the market breaks the current consolidation boundary, the further correction could be quite deep. In the current situation, I do not yet see any drivers or reasons for another rally.
Best regards, R. Linda!
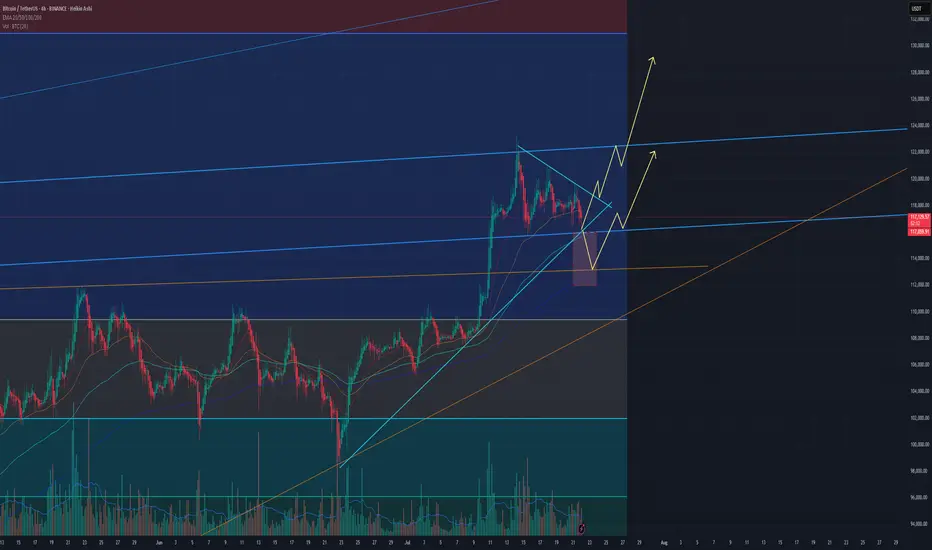
Wave Analysis: "Peak Breeds Peak, Trough Breeds Trough".This chart presents a custom technical model relying on only two points to generate a series of expected price levels, integrating multiple factors for high-precision time and price forecasting.
Unlike the traditional ABCD pattern, this method provides both timing and pricing predictions and is designed to detect potential explosive moves (“pumps”) early on.
The analysis is applied to Bitcoin, highlighting key support zones, targets, and stop levels derived from a neural network approach.

BTC/USDT Analysis: Inside the Range
Hello everyone! This is a daily analysis from a trader-analyst at CryptoRobotics.
Yesterday, Bitcoin continued moving toward the upper boundary of the sideways range. Strong market buying emerged near that level, but unfortunately, it was absorbed by sellers.
At the moment, we are testing the POC (Point of Control) of the current trading range. Buyer activity is already appearing at this level. If bulls regain initiative, we can expect a move back to the upper boundary. However, if the price drops below the current level, there is a high probability of stop-loss hunting and a liquidity grab near $115,000.
Buy Zones:
~$115,000 (zone of initiating/pushing volumes)
$110,000–$107,000 (accumulated volumes)
This publication is not financial advice.

TradeCityPro | Bitcoin Daily Analysis #135👋 Welcome to TradeCity Pro!
Let’s move on to the analysis of Bitcoin and major crypto indices. In this analysis, as usual, I’m going to review the futures triggers for the New York session.
⏳ 1-Hour Timeframe
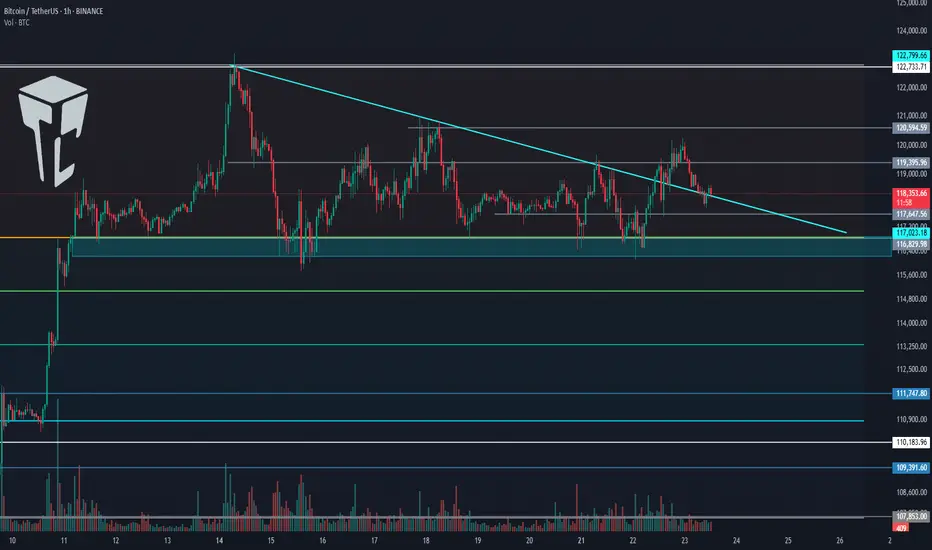
Yesterday, Bitcoin broke the 119,395 level but couldn’t hold above it and has now returned below this level, currently sitting on its previous trendline.
✔️ Today, the market will probably try to form more structure, and I think Bitcoin will range.
⭐ However, if it wants to move, we can enter a long position with the trigger at 120,594.
🔽 For a short position, we can enter if the 116,000 support area breaks.
👑 BTC.D Analysis
Let’s move on to Bitcoin Dominance. Yesterday, dominance had a bullish move, and finally, a support floor managed to prevent further drop in dominance.
🧩 A retracement to 61.20 has occurred. If this retracement continues, the upper levels are 61.53 and 62.
A break of 60.46 will start the next bearish leg.
📅 Total2 Analysis
Let’s go to Total2. This index has formed a range box between 1.48 and 1.55 and is still oscillating within it.
🎲 If 1.55 breaks, we can open a long position, and on the other hand, if 1.48 breaks, the price could correct to lower support levels.
📅 USDT.D Analysis
Let’s move on to Tether Dominance. This index also has a range box and is still moving inside it.
🔑 Breaking 4.13 is very important for the future market trend and could lead to a drop in dominance.
Accumulate BTC over 115K💎 BTC PLAN UPDATE (July 23rd)
NOTABLE NEWS ABOUT BTC
Bitcoin (BTC) and Ripple (XRP) are approaching their all-time highs, while Ethereum (ETH) continues to grow steadily toward the important $4,000 mark. These top three cryptocurrencies by market capitalization are showing signs of a new bullish momentum, supported by strong technical structures and increasing investor interest.
TECHNICAL ANALYSIS PERSPECTIVE
1. Main Trend
The overall trend remains bullish, with a clearly rising price channel (black diagonal line).
However, BTC is currently in a short-term correction phase, consolidating sideways after the recent strong surge.
2. Key Price Levels
🔵 Strong Support Zone: 116,000 – 117,000 USDT
This zone includes the 200-day moving average (MA200), horizontal support, and a previous bottom — making it a decisive area for the short-term trend.
If this zone breaks, BTC could fall to a deeper support area around 111,000 USDT.
🔴 Resistance Zone: 122,000 – 123,000 USDT
This is a previous peak and a recently “false breakout” area — a strong psychological resistance.
If broken convincingly, BTC could surge to the 130,000 USDT zone (Fibonacci extension 1.618).
3. Possible Scenarios
✅ Bullish Scenario:
Price retests the 116,000 – 117,000 support zone and then bounces.
If it breaks through the 122K resistance, the next target is 130,000 USDT.
❌ Bearish Scenario:
If price breaks below MA200 and the 116K support zone → it could drop to the deeper zone around 111,000 USDT.
4. Technical Signals
There is a triangle accumulation pattern (with flat tops and bottoms).
The “false breakout” at the resistance zone shows that buyers are not yet strong enough and a retest of support is needed.
Follow the channel for the latest and continuous updates on XAUUSD, CURRENCIES, and BTC.
BTC/USD) Bullish trend analysis Read The captionSMC Trading point update
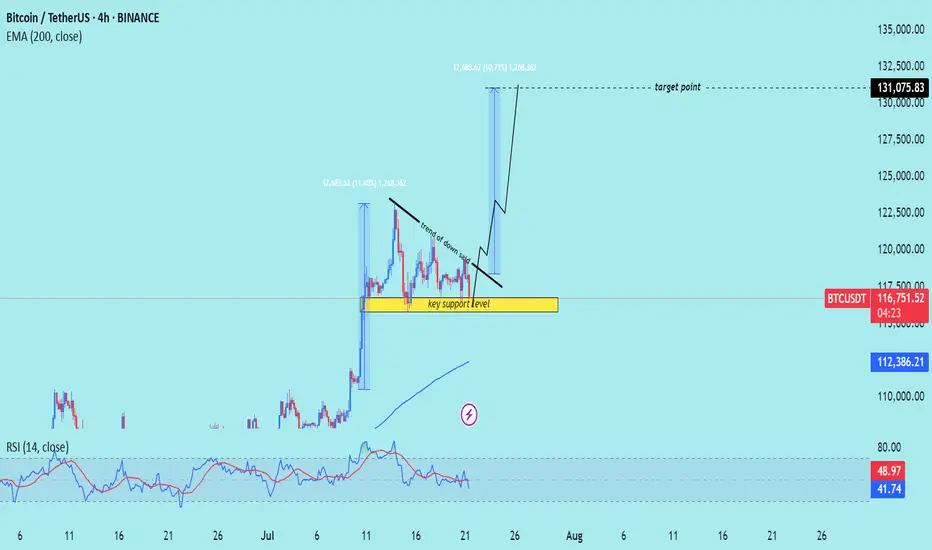
Technical analysis of Bitcoin (BTC/USDT) on the 4-hour timeframe, indicating a potential upward continuation after a period of consolidation above a key support level.
---
Analysis Summary
Pair: BTC/USDT
Timeframe: 4H
Current Price: 116,810.90
Bias: Bullish breakout continuation
---
Key Technical Insights
1. Key Support Zone:
The yellow box marks a strong support level, where price has bounced multiple times.
Acts as a launchpad for the next move higher.
2. Descending Trendline:
A trend of lower highs suggests short-term selling pressure.
Break above this trendline would signal a bullish breakout.
3. Projected Move:
If the breakout occurs, the projected target is around 131,075.83, representing a ~12% gain.
Similar move structure as the previous breakout earlier this month.
4. EMA 200 (Supportive):
Price remains above the 200 EMA at 112,386.80, affirming bullish trend bias.
5. RSI (14):
RSI hovering around 42–49, slightly oversold area, suggesting upside potential remains.
---
Target Point
Target: 131,075.83 USDT
Stop-Loss Suggestion: Below key support zone (~114,000)
---
Trade Idea
Direction Entry Stop-Loss Target
Buy Break above 118,000 Below 114,000 131,000–132,000
Mr SMC Trading point
---
Summary
Bitcoin is consolidating above a strong support zone and under a descending trendline. A confirmed breakout from this pattern could lead to a bullish rally toward 131,000+.
-
Please support boost 🚀 this analysis)
BTC AI Prediction Dashboard - 6h Price Path (23.07.25)
Prediction made using Crypticorn AI Prediction Dashboard
Link in bio
BTCUSDT Forecast:
Crypticorn AI Prediction Dashboard Projects 6h Price Path (Forward-Only)
Forecast timestamp: ~11:15 UTC
Timeframe: 15m
Prediction horizon: 6 hours
Model output:
Central estimate (blue line): -118,153
Represents the AI’s best estimate of BTC’s near-term price direction.
80% confidence band (light blue): 117,892 – 118,573
The light blue zone marks the 80% confidence range — the most likely area for price to close
40% confidence band (dark blue): 117,390 – 119,187
The dark blue zone shows the narrower 40% confidence range, where price is expected to stay with higher concentration
Volume on signal bar: 85.84
This chart shows a short-term Bitcoin price forecast using AI-generated confidence zones.
Candlesticks reflect actual BTC/USDT price action in 15-minute intervals.
This helps visualize expected volatility and potential price zones in the short term.

BTC correction august/septemberBTC has reached overbought territory, there is also bearisch divergence. It also didnt go above 123k anymore. i expect a correction in august/september.
dont chase FOMO, be prepared. Nothing goes in a straight line. there are always corrections.
CRYPTO:BTCUSD BINANCE:BTCUSD CME:BTC1! BINANCE:BTCUSDU2025

Potential head and shoulders pattern appears on Bitcoin’s globalHey everyone!
I've been on TradingView for a while, but this is my first post — so go easy on me 😄
I'll keep it short and straight to the point.
---
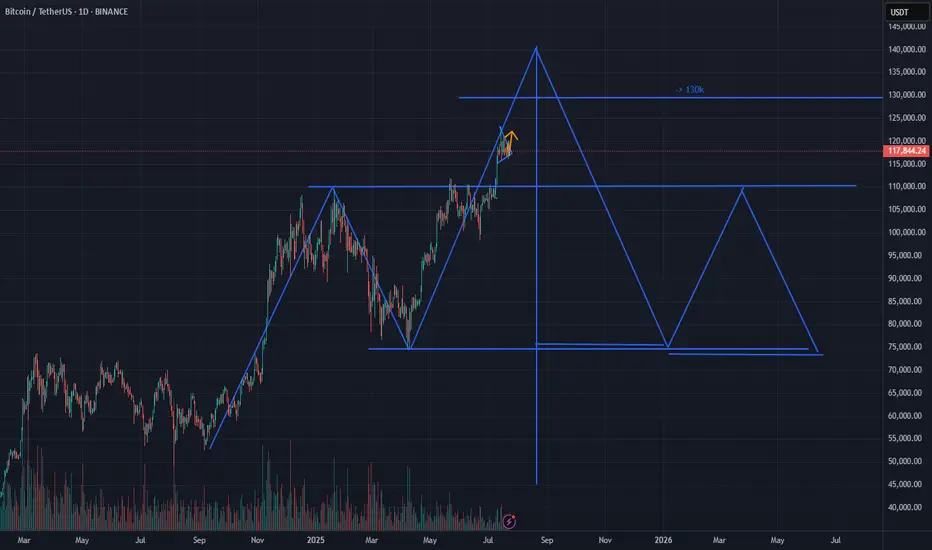
A head and shoulders pattern is forming on the global Bitcoin chart
The pattern is not yet fully formed, and it is difficult to draw any conclusions, but what has already formed may indicate the implementation of this pattern, which we may see in the near future, which means that an upward movement is possible, before the head is formed
Current price: $118k
With this pattern, there is a low probability of a price breakout to $103.4k
The head of the pattern may be at $124k or $129k, provided there is no strong positive news background from the US government regarding Bitcoin
This analysis is based on the technical pattern and also incorporates AI to provide more accurate results.
---
I'd be happy to hear your thoughts, feedback, or any constructive criticism in the comments!
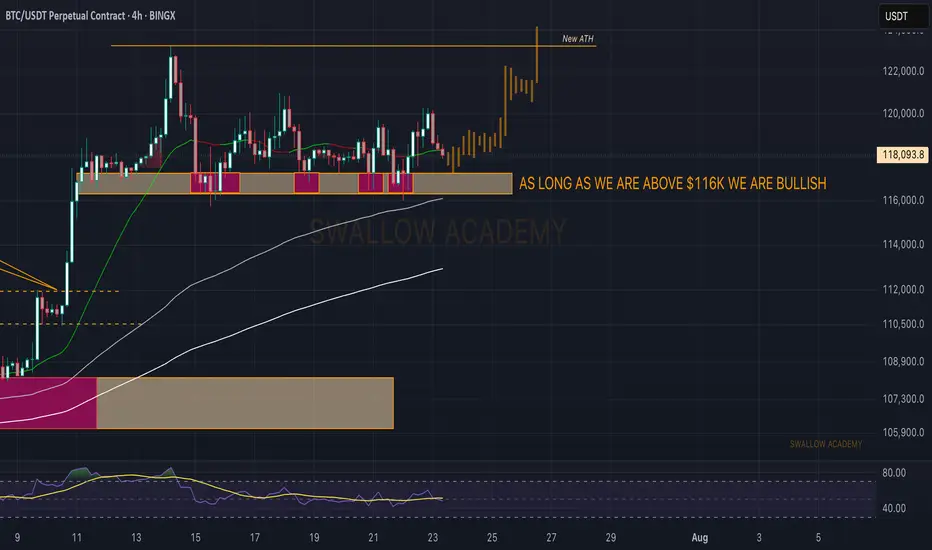
Bitcoin (BTC): as long as we are above $116K we are BULLISH!First things first, we are still above $116K, and since hitting the ATH, we have been forming a perfect zone of accumulation, which is ideal for another retest of the local high and movement to the next ATH.
What we are looking for here is maybe further movement in the sideways channel, which eventually should lead the price to ATH for a breakout attempt!
Swallow Academy
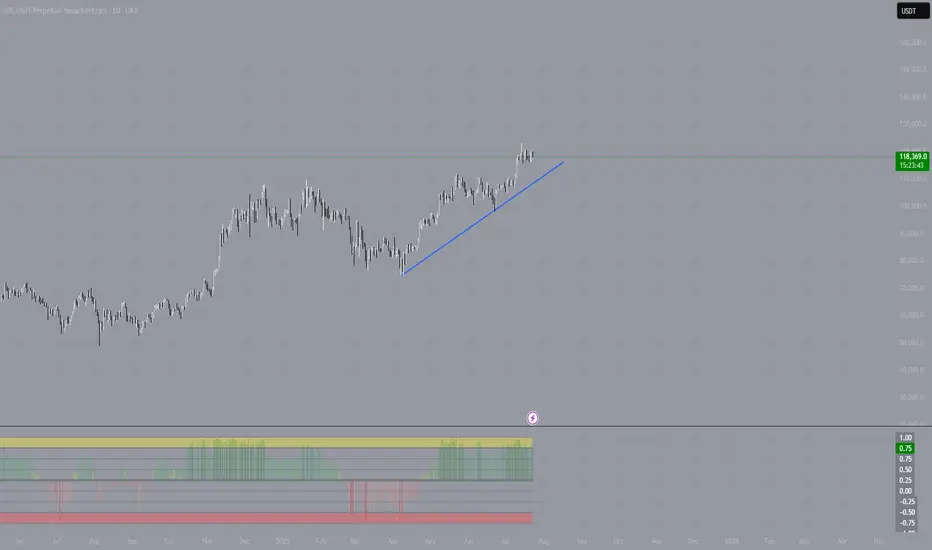
Bitcoin is OverheatedI’m observing the current situation in the BTC market and want to share a brief reflection. The latest upward impulse doesn’t just look confident—it’s starting to resemble overheating.
The price has detached from its averages, and the movement is accompanied by local euphoria. I see the community piling in “at the highs,” hoping for continuation. But it’s crucial to understand: markets don’t grow forever. Especially when the growth lacks proportional volume and fundamental support.
I use a comprehensive technical approach, and one of my indicators has given a clear signal—the market is overheated. We’re currently seeing a classic state of overbought conditions: the price is moving too far, too fast.
This doesn’t mean you should immediately short or panic. But as a trader, I understand that in such a phase, it’s wiser to:
– Partially take profits,
– Move stops closer to the market,
– And absolutely avoid entering new longs on emotions.
Typically, after such surges, the market either consolidates or corrects by 10–20% to shake off the overheating and provide an opportunity to enter at fairer levels. Personally, I’m waiting for a return to balance and a reset. I don’t rule out a final “explosive” move upward on news, but such breakouts usually end as quickly as they begin.
BTCUSD 16.07.2025 ~+ General gloom over USD (pressure on Powell, tariffs, BB Bill)
* Mostly technical trade
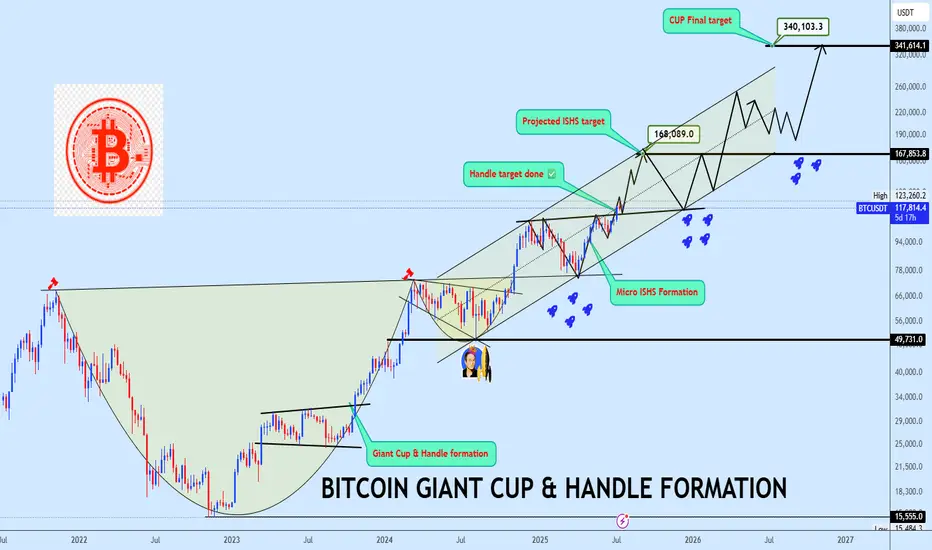
Bitcoin Bottom Three in progress targeting $340kBitcoin continues to defy the doubters, extending its dominance and triggering milestones that once seemed unreachable. A few years ago, we projected a massive rounding bottom with a target near $123K to complete the bottom two of the third halving cycle a bold forecast that has now played out in full:
📌
With bottom two now in the rearview, our focus shifts to bottom three of the fourth halving cycle, projected to mature around October 2025, barring time shifts:
📌
As shown on the chart, price has now split into a giant Cup & Handle formation and successfully broken out from the neckline. BTC is currently coiling inside a rising channel structure with trajectory toward the final projected target at $340K. A micro inverse head and shoulders (ISHS) formation has also emerged, offering a key accumulation zone near the neckline, this will be a crucial region to watch for entries.
Let price action do the talking. Share your view and let’s dissect this historic setup together.
BTC intraday long idea BTCUSDT Intraday Idea | 1H Chart
Price recently pushed into a key supply zone and is now pulling back after a strong impulsive move. The highlighted green box marks a demand block or breakout origin, with confluence from high volume and previous rejection.
🟩 Long Area:
116,725 – 116,300
This area acted as a bullish breaker and low-volume node. Price previously wicked deep into this zone before a strong bullish push, suggesting unfilled orders remain. If price retests this zone, a reaction is likely.
Reason for Entry:
• Strong displacement from demand
• Price forming lower highs into potential mitigation
• Decreasing sell volume on the pullback → signs of absorption
• Clean R/R with tight invalidation
📉 Short-term Sell-off:
This retracement is likely a liquidity grab or order block mitigation, pulling into the long zone to refill institutional orders.
📈 Target Zone:
119,750+ – aligned with recent inefficiency and prior high.

BTC analysis: FOR 23 JULY 2025Bitcoin has broken out of the triangle pattern in an upward direction and is now set for a retest. If the price is able to hold above this level, we could see a continuation of the upward movement. The first resistance level is at $120,000, and a break above this could propel us toward a new all-time high.

Can BTC Reclaim 118,700?1% a day can near 400% my life.
I Spot Longed BTC looking for a 1% up, might take awhile but, BTC is king, I will wait. and when it hits, a couple of memes have retraced on the daily, I will be looking for more riskier memes for a higher %pump.
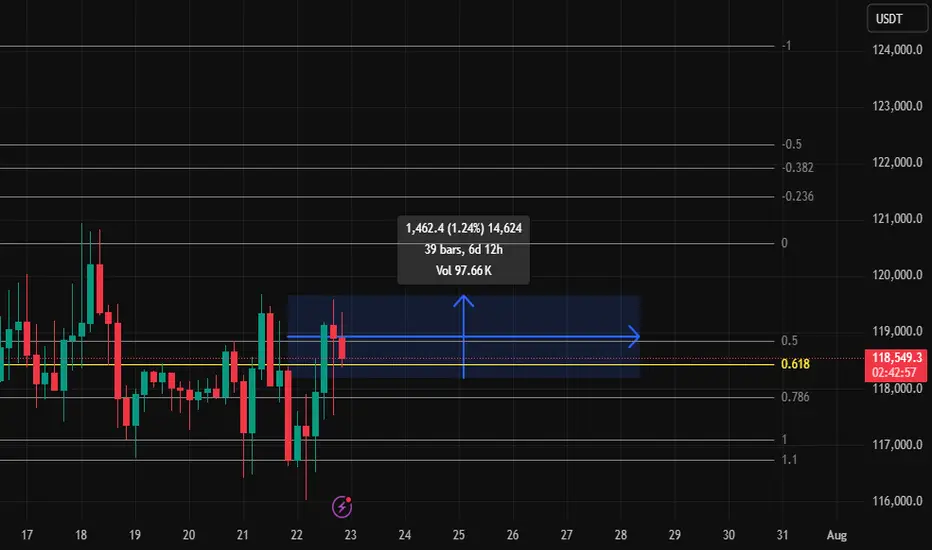
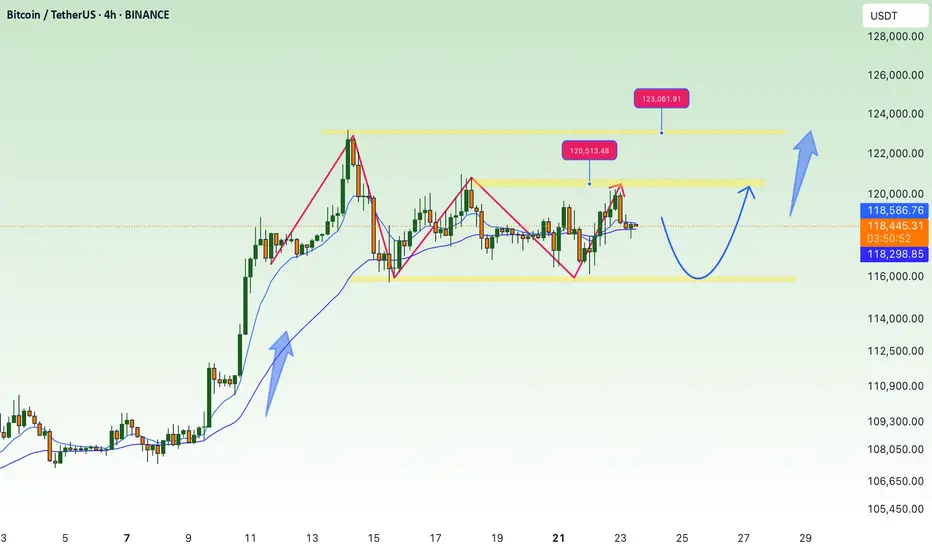
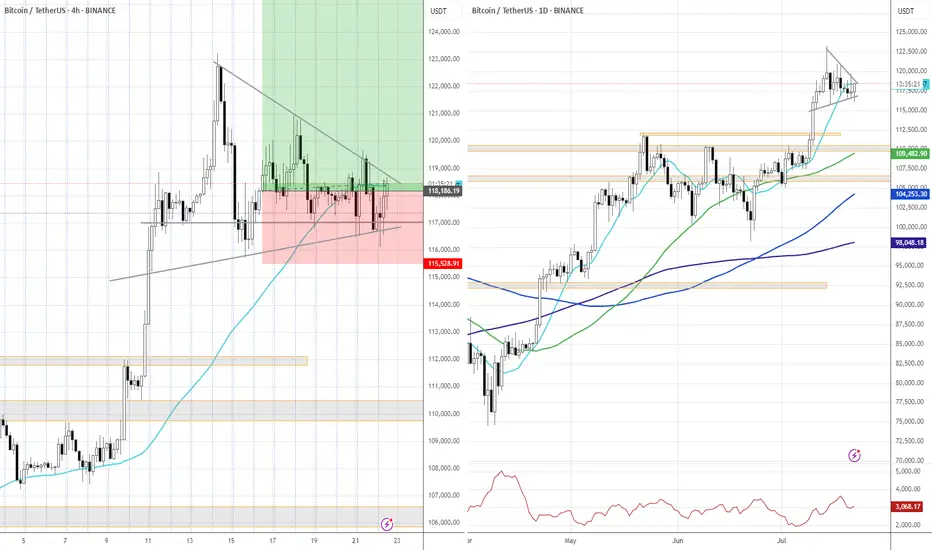
BTC/USDT – Range Formation Before Next Move?Bitcoin is currently consolidating between $117,000 support and $120,000 resistance, forming a tight sideways range after a strong breakout.
🔹 Structure Insight:
Bullish rally stalled at $120K resistance zone.
Range-bound candles with wicks on both ends = indecision.
Strong demand zone near $117K, acting as short-term floor.
🔸 Indicators Flash Neutral Bias:
RSI cooling off below overbought zone (~63) – no strong momentum.
ADX low and flattening – trend weakening.
MACD losing strength – bull momentum fading.
Volume declining during consolidation = awaiting catalyst.
🟢 Bullish Trigger: Break above $120K with strong volume could ignite next leg up → Targets: $122K–$127K
🔴 Bearish Trigger: Breakdown below $117K opens door to $114K–$112K retest.
🧭 Outlook: Sideways range – wait for breakout confirmation before positioning aggressively.
Power Law GrowthWhat you’re seeing is a Power‑Law Growth Corridor plotted over the weekly BTC/USDT price. In essence, it’s a dynamically‑sloped channel built on a power‑law fit of price vs. time, rather than the usual straight‐line

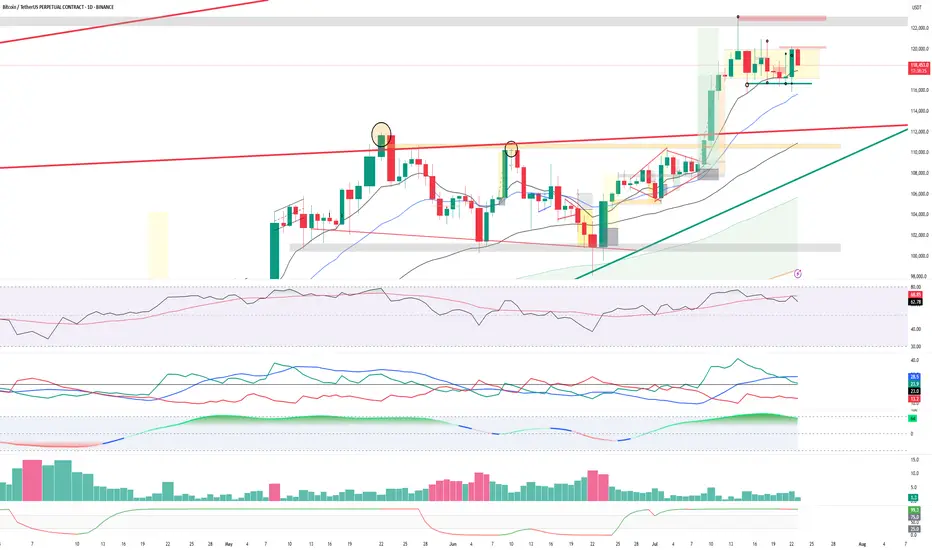
#BTC Ascending Triangle📊#BTC Ascending Triangle✔️
🧠From a structural point of view, we are still in a long-term bullish trend, and the short-term short structure of the small cycle is difficult to change the trend force of the large cycle. And we have been sideways here for a long time, digesting the selling pressure here, and it seems difficult to pull back. And the 15m level has built a bullish head and shoulders structure, so please be cautious about shorting!
➡️From a morphological point of view, the price is gradually compressed and formed into an ascending triangle. Generally, we will use this model to continue the original trend force.
⚠️Note that if we fall below the inflection point of 115687, it means a short structure at the 4h level. We need to be alert to further pullbacks. At that time, if we want to participate in long transactions, we need to find a lower support level to participate, such as around 112000.
Let's take a look👀
🤜If you like my analysis, please like💖 and share💬 BITGET:BTCUSDT.P

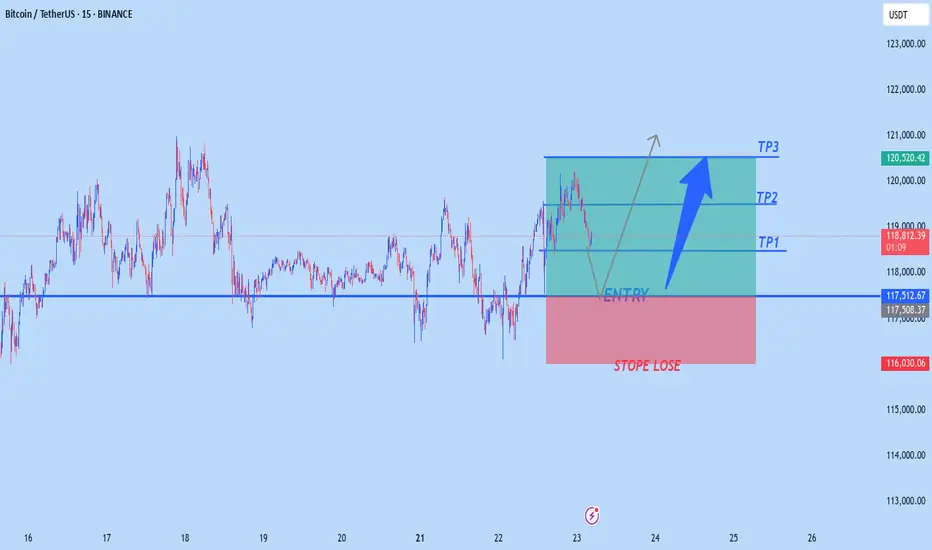
BTCUSD BULISH TRANDE Btuusd buy from 117,500
tp 118,500
tp 119,500
tp 120,590
Stope Lose 116,000
TRADE AT YOUR OWN RISK