BTC/USDT - Liquidity Loading Zone
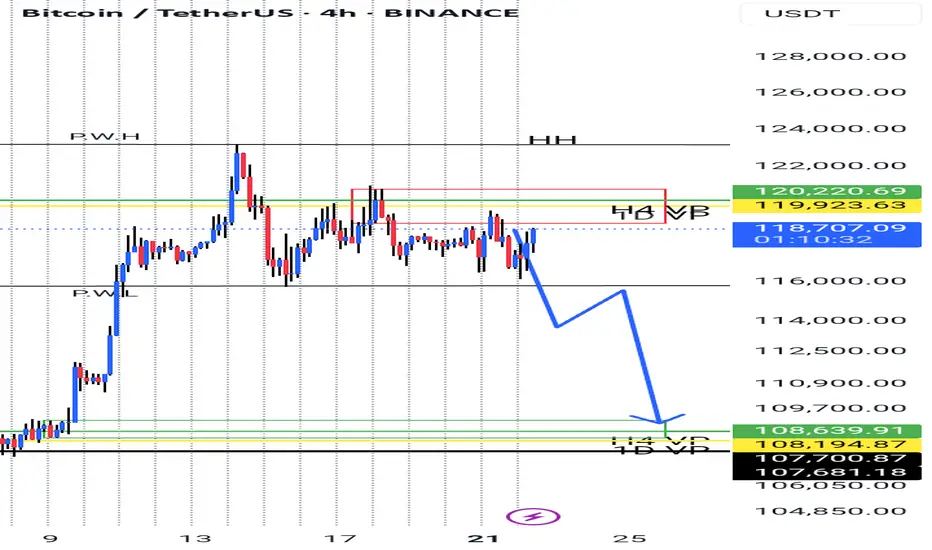
Bitcoin is trading within a well-defined range, building liquidity on both sides. Equal highs near 121K signal buy-side liquidity, while equal lows around 115.7K mark the sell-side liquidity. This setup is a classic smart money trap—engineered to gather orders before a major move. The longer the range holds, the more explosive the breakout is likely to be. Watch for a sweep of either side as a potential trigger for expansion.
Whether it’s a fakeout or breakout, liquidity will decide the next move.
BTCUST trade ideas

BTC Top-Down Analysis (Weekly, Daily, 4H)Weekly, Daily, and overall trend is bullish only 4H internal structure is short-term bearish with price trading inside a 4H demand zone.
From weekly timeframe:
- Inverse head & shoulders is forming showing trend continuation.
- ATH trendline (Nov 2021) has flipped from resistance to support — not retested yet.
- Major supports all align between 113K–109K including:
- CME Gap: 114380–115635
- Trendline: 113798
- Neckline: 112800
- Weekly Bullish OB: 110520
- Harmonic Bat PRZ: 109350
My Thoughts:
This 113K–109K zone is a high-confluence support area I’ll only consider buying BTC within this range.
This analysis remains valid as long as the weekly candle doesn’t close below the Bullish OB (105K) or above the ATH.

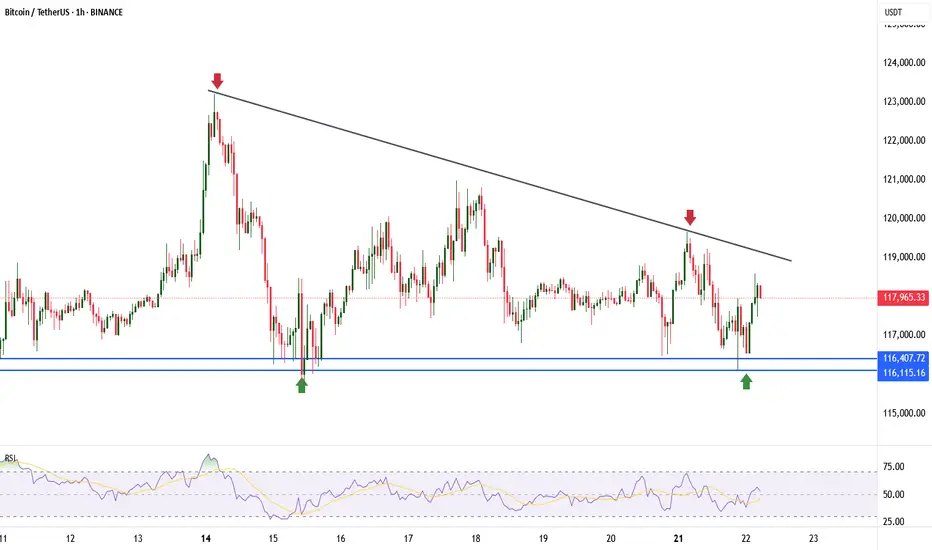
BTC #Bitcoin (BTC/USDT) 1-hour chartThis Bitcoin (BTC/USDT) 1-hour chart shows two clear consolidation phases marked by blue rectangles. Each consolidation lasted 164 bars (~6 days 20 hours). After the first range, Bitcoin broke out upwards, leading to a strong rally. The current price action is again testing the upper boundary of the second consolidation range ($119,200), indicating a possible breakout. The gray zone ($116,500) highlights a key support level. A breakout above the range could signal another bullish continuation.
thanking you

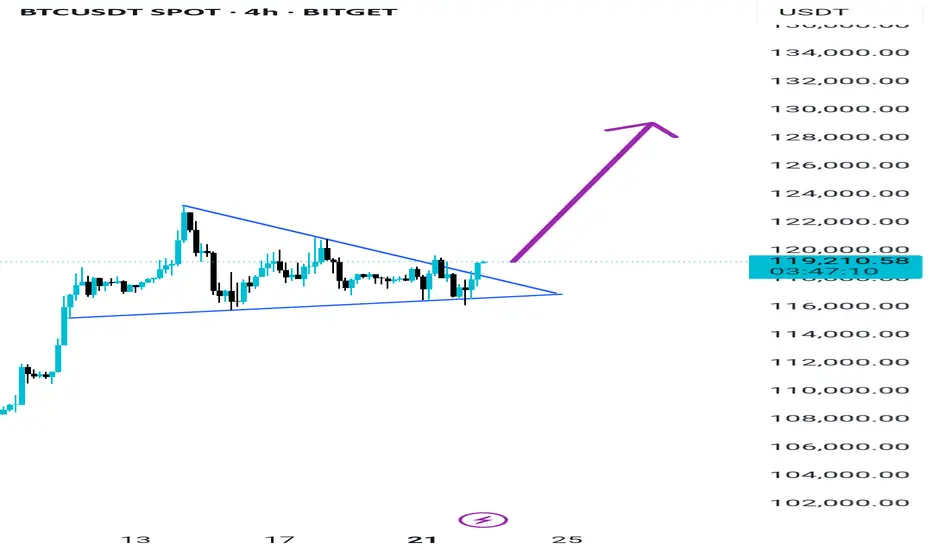
Are you Ready for Next Leg Up BTC Breakout is done on 4H wait for retest and you can take long after confirmation
TP 128K 130K For now
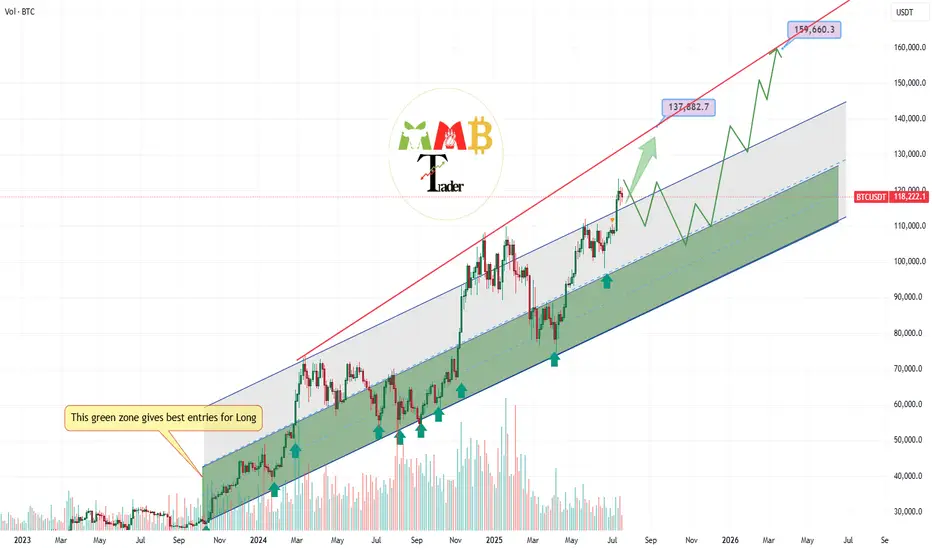
Bitcoin first target and short-term pump at least to 137K$ aheadAs we can see stop and next range zone for price can be near 135K$ to 137K$ and also major support zones now are 115K$ and 105K$ that can pump price once again if they touch.
Red trendline was strong resistance and it usually stop the pump and it is daily high detector now unless it breaks this time.
DISCLAIMER: ((trade based on your own decision))
<<press like👍 if you enjoy💚
BTC #Bitcoin 15-minute BTC/USDT chart (Updated ChartThis 15-minute BTC/USDT chart (Binance) shows Bitcoin rebounding from a demand zone near 116,000–116,750 USDT and forming higher lows along a short-term ascending trendline. Price is currently around 118,446 USDT, aiming toward a marked supply zone near 119,500 USDT, suggesting a potential short-term bullish move. A rejection at this supply zone could signal a pullback, while a breakout may indicate continued upward momentum. Key support and resistance zones are clearly defined.
thanking you

BTC / USDT near to breakout from trendline resistanceBTC is testing its trendline resistance after a steady buildup. A successful breakout could trigger a strong move toward the $122,000–$125,000 range. Worth watching closely in the coming sessions.
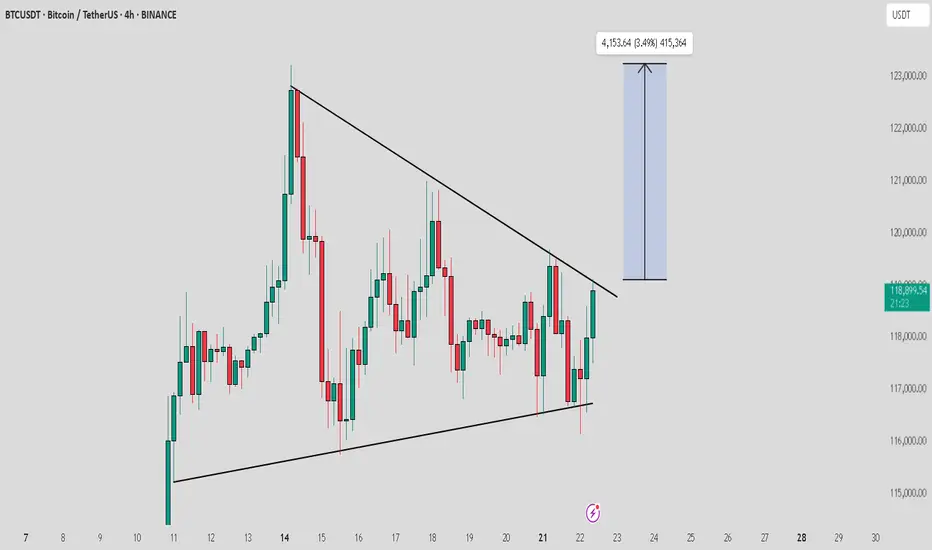
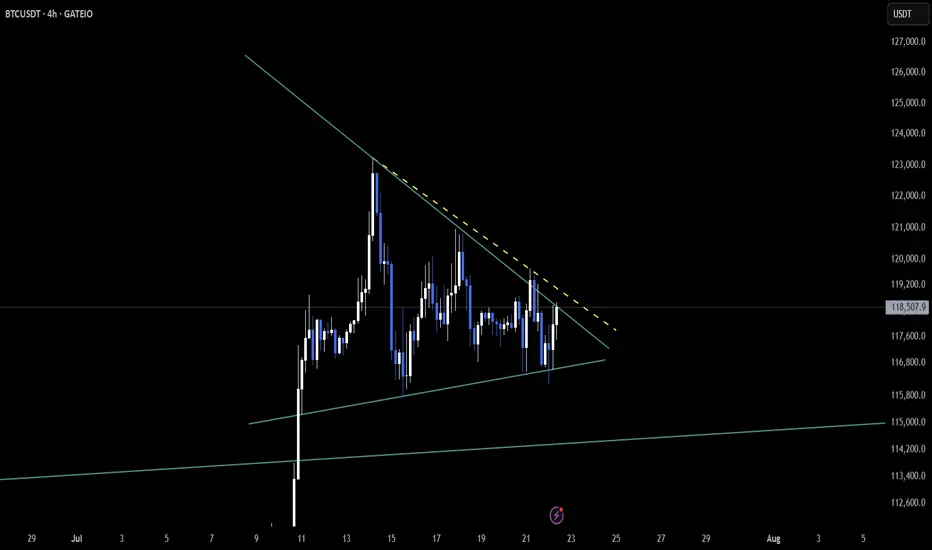
Bitcoin Ready for the Next Leg Higher!Bitcoin is currently consolidating within a symmetrical triangle on the 4-hour timeframe, showing signs of a potential breakout. After a strong rally earlier in July, BTC has entered a compression phase, forming lower highs and higher lows — a classic setup for a volatility breakout.
Price is moving near the apex of the triangle, suggesting that a decisive move is imminent. The 50 EMA and 100 EMA are both acting as dynamic support, helping bulls maintain control of the structure. A breakout above the descending trendline could initiate a sharp move toward the $130K–$133K target zone.
Cheers
Hexa
BINANCE:BTCUSDT

$BTC Breakout Coming?CRYPTOCAP:BTC is coiling up inside a symmetrical triangle on the 2H chart.
A breakout looks close if it clears resistance; we could see a 7.5% move toward the $127K–$128K zone.
Watch for volume confirmation.
DYOR, NFA

BTCUSDTBTCUSDT needs some more correction before we continue the same trend.
Disclosure: We are part of a Trade Nation's influencer program and receive a monthly fee for using their Tradingview charts in our analysis.
BTC BITCOIN THE BTC 135K ZONE ON the ascending trend line will like happen ,as the structure never lies.
at the moment am looking at a retest into 124k and we either get a double top structure to sell on rejection or we keep buying into 135k and sell from the supply roof of the ascending bullish trendline .
trading is 100% probability ,trade with caution.
ANY KEY LEVEL CAN FAIL .

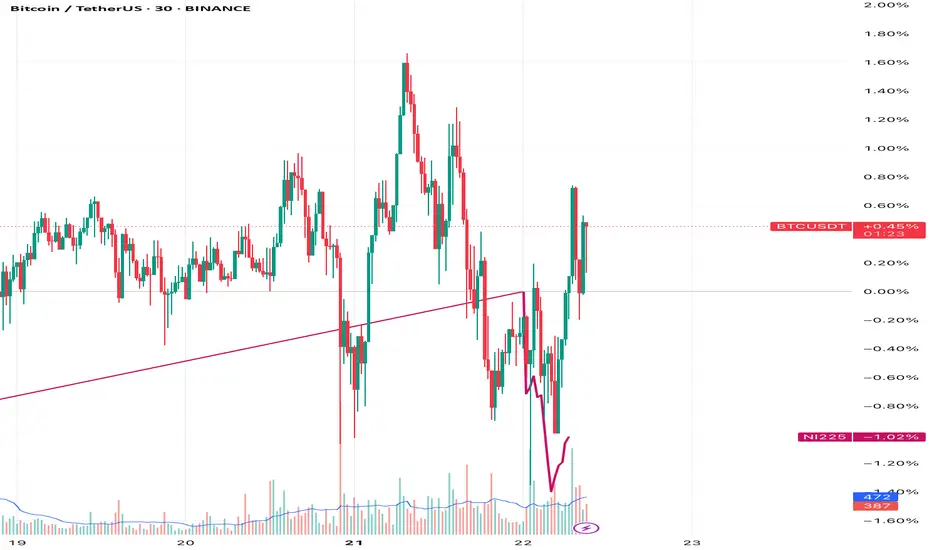
BTC AI Prediction Dashboard - 6h Price Path (22.07.25)
Prediction made using Crypticorn AI Prediction Dashboard
Link in bio
BTCUSDT Forecast:
Crypticorn AI Prediction Dashboard Projects 6h Price Path (Forward-Only)
Forecast timestamp: ~10:15 UTC
Timeframe: 15m
Prediction horizon: 6 hours
Model output:
Central estimate (blue line): -118,624
Represents the AI’s best estimate of BTC’s near-term price direction.
80% confidence band (light blue): 118,260 – 118,867
The light blue zone marks the 80% confidence range — the most likely area for price to close
40% confidence band (dark blue): 117,702 – 119,570
The dark blue zone shows the narrower 40% confidence range, where price is expected to stay with higher concentration
Volume on signal bar: 120.84
This chart shows a short-term Bitcoin price forecast using AI-generated confidence zones.
Candlesticks reflect actual BTC/USDT price action in 15-minute intervals.
This helps visualize expected volatility and potential price zones in the short term.

BTC – Tightening Structure, Big Move Loading?CRYPTOCAP:BTC is currently bouncing off the lower trendline of the symmetrical triangle on the 4-hour chart 📊. The structure remains intact, with neither a breakout nor a breakdown confirmed yet.
This kind of compression often leads to expansion—either a bullish surge or a sharp dip depending on who takes control next ⚡️.
All eyes are on this zone 👀. The next few candles could decide the market’s short-term direction, so stay sharp and watch the reaction closely!
BTC #Bitcoin 15-minute BTC/USDT chart This 15-minute BTC/USDT chart (Binance) shows Bitcoin rebounding from a demand zone near 116,000–116,750 USDT and forming higher lows along a short-term ascending trendline. Price is currently around 118,446 USDT, aiming toward a marked supply zone near 119,500 USDT, suggesting a potential short-term bullish move. A rejection at this supply zone could signal a pullback, while a breakout may indicate continued upward momentum. Key support and resistance zones are clearly defined.

I’m just trying my luck with this and it doesn’t look too great The only only way way I could find find out if they they are are in in a a little little while I was was if if I could get them them in in a a week week and and I I could could find find a couple couple days days in the next month month or two two days days and and I I can can I have have them them out out in a a week and and I have a lot more time
btcIn h1 time frame the price is indecision phase which makes traders more careful to take position in market. Support area is obvious.
BTCUSDT IDEAAlthough Bitcoin is currently in an uptrend, it broke the bottom at 116.684, which caused the new top at 123.200. Therefore, I see that it has formed a bearish consolidation currently. Also, huge liquidity is concentrated at 115.930, so I expect it to fall to 113.849.

Bitcoin (BTC): 90% Of Traders Will Be Wiped Soon | Be Careful!Still bullish on Bitcoin, while we are seeing accumulation movement happening, we are still above the local neckline zone of $116K, which means as long as we are above that zone, we are going to look for buy entries.
We are expecting one more push to happen before we enter a proper correction, which will wipe out 90% of traders!
Swallow Academy

Bitcoin support and resistance areas to observeI've identified some very clear support and resistance areas that could provide some gains on the daily chart.
If it breaks the upward resistance line then the next stop could be all time high resistance.
If it breaks the downward support line then the next stop could be $111,600 area.
One to watch over the next few days to see if it respects those lines.

Crypto Market: What You MUST Know Today!⚠️ Crypto Market: What You MUST Know Today!
📌 Risk Management is 🔑
As we said yesterday, in a market like this, risk management, break-even planning, and timely profit-taking are essential. Every position should come with a clear and structured plan.
📰 Major Fundamental Updates
🔻 Bitcoin has dropped below $117,000 today.
👉 Main reason: Profit-taking after recent gains.
💸 Over $131 million has been withdrawn from Bitcoin ETFs in recent days, adding selling pressure to the market.
🎤 Jerome Powell is scheduled to speak today. The market is nervous he might hint that interest rates will stay high. Investors are on hold.
⚖️ Key crypto regulation bills in the US are facing setbacks. Legal uncertainty is keeping investors cautious.
💰 Capital is rotating from BTC into altcoins. Solana is up 🚀, while Ethereum and Ripple are slightly down.
📉 Technical indicators like RSI and MACD show overbought conditions. The market is correcting now, and the uptrend is weakening.
🏛️ A crypto policy report from the White House is expected today. Many are waiting for clarity before taking big steps.
📊 US inflation remains high → The Fed is unlikely to cut rates soon. Crypto markets need looser monetary policy to thrive.
💥 A large number of leveraged long positions are concentrated around $115,000. If BTC falls further, liquidations may cause additional selling pressure.
♦️ BTC Technical View
The weekly chart shows both buying and selling pressure.
Strong buy wicks indicate active buyers around the $114K–$116K zone.
If price breaks below this level sharply, expect a deeper drop.
If the price approaches this zone slowly, buyers (both takers and makers) may step in to defend it — potentially triggering the next leg up.
⚠️ Important Note
❌ No short positions in our strategy.
Even if price drops, our plan is: “No problem, we missed it 😄”
Our approach = No shorting at these levels. Stay disciplined. 💪
♦️ BTC Dominance (BTC.D)
📉 After a sharp drop, a bounce to 62.15–63.63 is possible.
Once this correction completes, we’ll watch for altcoins that are still ranging and getting ready to break out.
📈 If BTC starts printing green candles with rising volume:
➡️ Focus on altcoins in your watchlist near breakout levels.
📌 Two Main Scenarios:
• ✅ BTC breaks $120K and dominance drops → Early signs of altseason
• ❌ BTC drops and dominance rises → Altcoins likely to drop further
♦️ USDT Dominance (USDT.D)
🔁 Yesterday’s session didn’t break above 4.14 → No bullish confirmation for BTC or alts yet.
📈 If 4.26 breaks upward → Expect more correction across the market.
📉 If 4.14 breaks downward → We may stay in our positions with more confidence.
✅ What to Watch For Today
📊 Jerome Powell’s speech
📰 White House crypto policy report
📉 USDT.D movement at 4.14 / 4.26
🔍 BTC price action near the $114K–$116K zone
🚀 Altcoins approaching breakout levels
🚀 If you found this helpful:
👉 Tap the rocket to support
🔔 Follow for clear, no-hype market updates
💬 Drop your thoughts in the comments!

Bitcoin (BTC) Analysis – July 21, 2025We’ve previously discussed the significance of the $110,000 level — a zone where long-term holders typically take partial profits.
After multiple pullbacks from that region, a new wave of short-term investors stepped in around $97,000, managing to push the price as high as $123,000.
⚠️ I know many traders are tracking Bitcoin dominance and expecting a correction from this zone — and I partly agree.
However, issuing a sell signal here feels premature and potentially risky.
✅ Instead, I’d suggest looking for a re-entry opportunity around $95,000, where market structure and buyer activity may offer a much better risk-reward ratio.

BTCUSDT Aiming LowsHi there,
BTCUSDT looks bearish at the M30 with one price target of 116 658.83 for a bias of 115 930.49.
The bearish price appears to be sustained by the H4 time frame.
Happy trading,
K.
Not trading advice
