Bitcoin Turned Down — It Was Only a Matter of TimeBitcoin Turned Down — It Was Only a Matter of Time
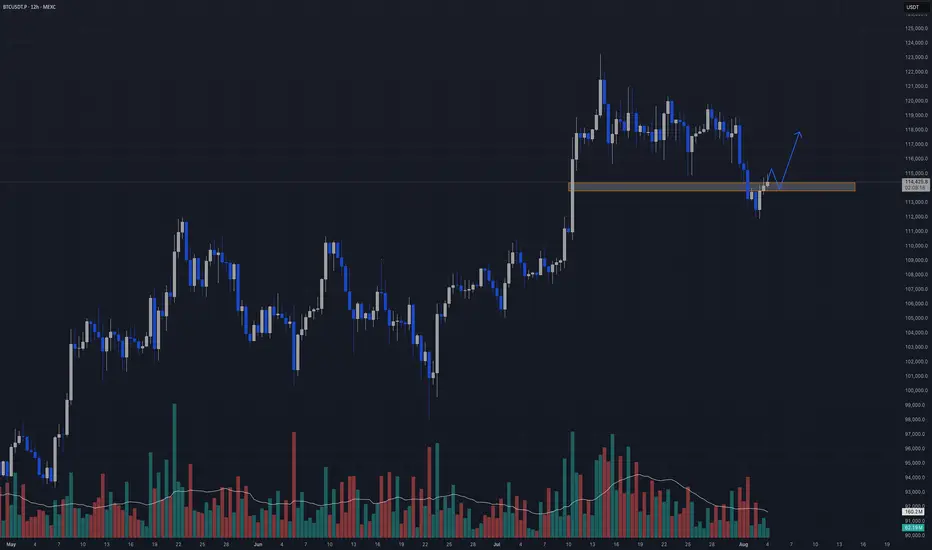
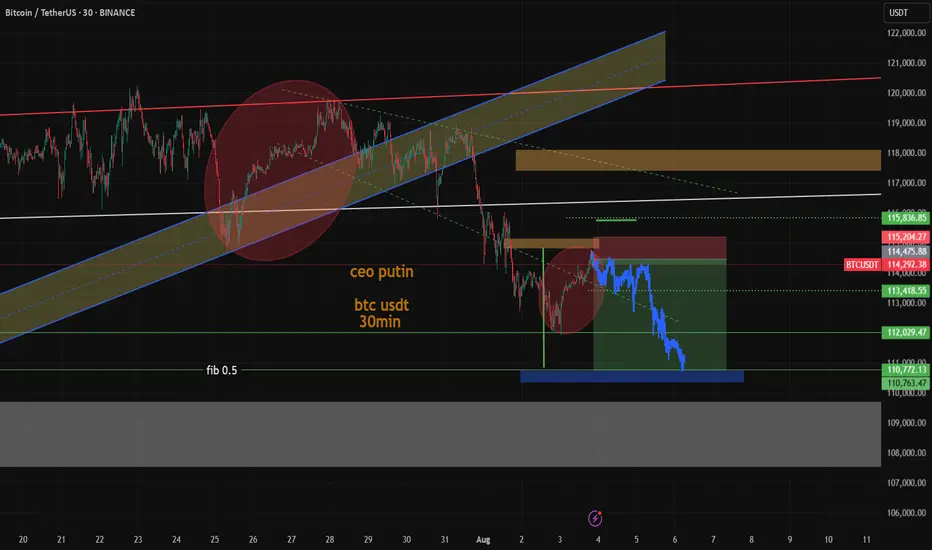
When the price gets stuck at the top and can’t move higher, it’s always a reason to stop and think. BTC got stuck around $118,000, started to form long upper wicks, and the volume started to decline. All of this pointed to a classic case of fading bullish momentum.
At this point, my indicator gave several key signals: weakening buying power, a change in momentum, and the formation of a potential reversal zone. I refrained from opening long positions — and this decision turned out to be the right one. The price went down and is now trading around $114,000.
Next, I will wait for a retest of the imbalance zone and work from the reaction from this zone.
It is important to understand: this correction is not something unusual. This is a technically sound phase after a strong rally. The market gets rid of speculative positions, gets rid of excessive leverage and prepares for either a reset or a deeper correction.
The market has weakened predictably, and that's actually a good thing. When the structure becomes clear, we can trade with a plan rather than just following our gut instinct.
BTCUST trade ideas
$BTC bouncing over crucial support!CRYPTOCAP:BTC is currently pulling back from the $123K resistance area, heading toward a major confluence support zone between $107K–$110K, which aligns with:
✅ Previous breakout zone
✅ 0.5–0.618 Fibonacci retracement
✅ Lower bound of the ascending channel
✅ 200 EMA support
This level is expected to attract buyers and act as a strong base for the next bullish leg.
Price dips into the $107K–$110K support
Look for a bullish reversal (reaction candles or bullish divergence)
Target 1: $128K – retest of resistance
Target 2: $132K – upper boundary of the ascending channel
CRYPTOCAP:BTC remains within a healthy bullish structure.
This pullback is constructive, not bearish.
The $108K–$110K zone is a high-probability long setup — wait for bullish confirmation before entering.
A daily close below $106.8K would invalidate the structure and open up downside risk.

$BTC Head and shoulders forming....elevator to 110kOver the last few days BTC has been in a downward channel and recently got a boost from the not so "free market" Trump's policies to open up highly volatile crypto to people looking to save and retire. One would expect a much bigger spike, but 117k resistance seems to be holding firm and retailers appear to be the exit liquidity for institutions. No crystal ball on where BTC will be, but there will be massive volatility along the way and in the short term 110k (or below) seems to be very much in the realm of possibilities. We're in a recession and all the lagging indicators are showing red flags. Enter BTC at your OWN RISK! If you're up, take your profit. If you're down, check out other strategies (like VIX strategies for downside protection).

BITCOIN LONG Bitcoin is currently trading in a up trend so looking at a continuation trade to the upside. Trendline is strong matched with a strong support level for a good looking entry.

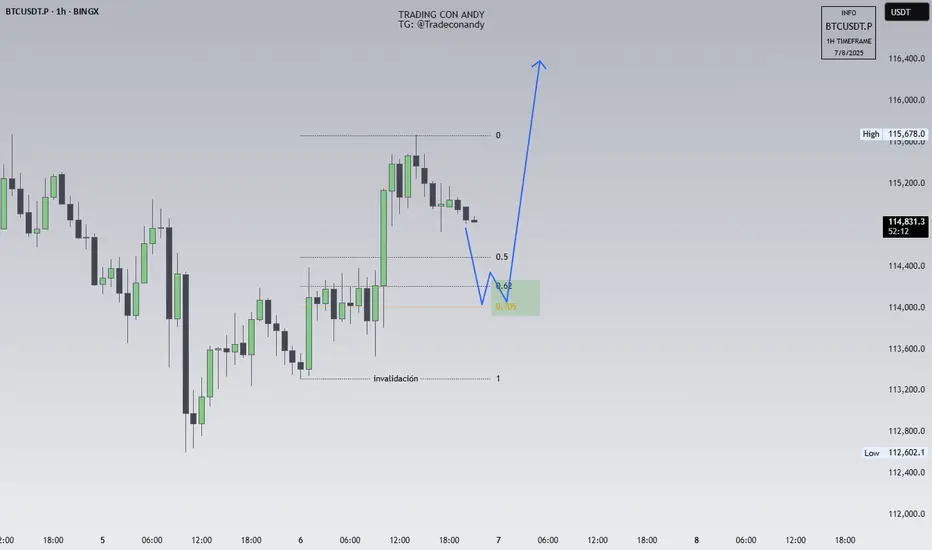
Make or Break. This next move is a big deal for me personallyTo stand behind the AI I have gone all in on this next move
Many things can go wrong, including a wick that liquidates my position, me getting in too soon or perhaps the AI did as well as it could until now, but did not get the next move correct.
Whatever happens, I'm all in. (this is not to say you should do the same, its to say I believe in my craft and am backing it with massive action).
Lets see what the Bitcoin Gods have in stall

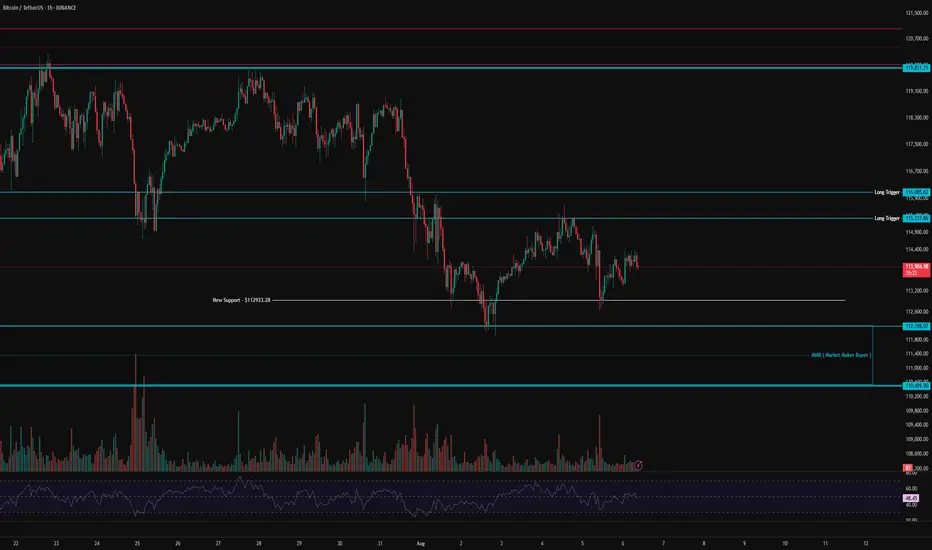
BTC 1H Analysis – Key Triggers Ahead | Day 3💀 Hey , how's it going ? Come over here — Satoshi got something for you !
⏰ We’re analyzing BTC on the 1-hour timeframe .
⏱ We’re analyzing Bitcoin on the 1-hour timeframe.
👀 After bouncing from the current $113,000 area, Bitcoin moved upward, indicating the presence of market maker buyers in this zone. A short-term support has formed at $113,000, and yesterday we saw a strong rejection from this level, which helped prevent further selling pressure.
Bitcoin now faces a resistance zone and a potential long entry trigger between $115,317 and $116,085. If long positions increase and short positions get squeezed, this resistance could be broken, potentially fueling a bullish move.
⚙️ On the RSI, our key level is the 50 range. A confirmed hold above this level could signal a higher low forming relative to the previous bottom at $112,933.
🕯 We’re seeing an increase in trading volume, and as the price moves closer to $110,499, there's a noticeable liquidity pull from long positions—more buyers are stepping in around this area.
📈 Our long position trigger lies within the resistance zone mentioned. A confirmed breakout and hold above this level, alongside RSI entering Overbought across multiple timeframes and volume expansion, would give us a solid entry for a long position.
📉 Our short position trigger is below $112,200. A sharp drop with strong selling pressure and RSI entering Oversold would justify a short entry—though I do not recommend taking this trade.
❤️ Disclaimer : This analysis is purely based on my personal opinion and I only trade if the stated triggers are activated .
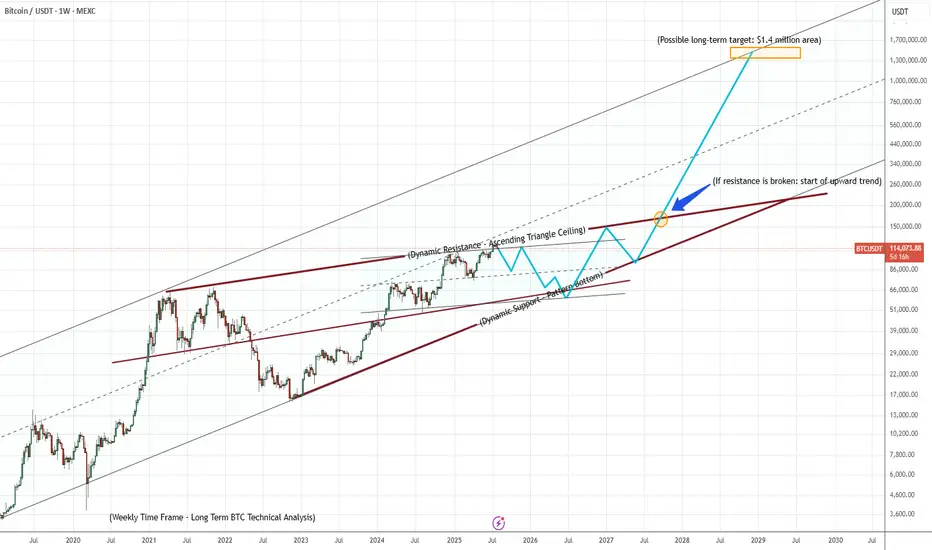
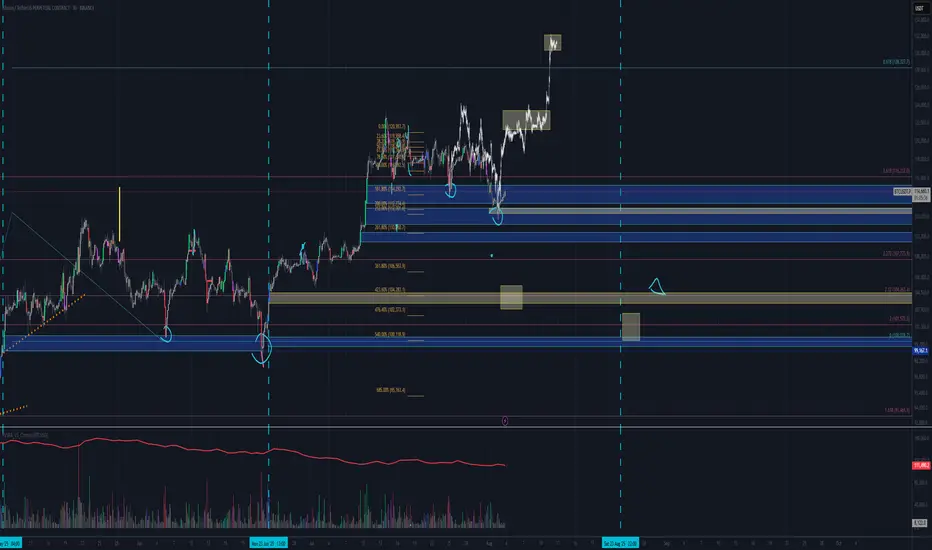
BTCUSDT – Ascending Triangle Completing the Path!📊 Bitcoin is currently forming an ascending triangle, clearly marked in bold red.
This zone is showing high volatility and provides great Buy/Sell opportunities for traders. 🔄
📈 If the price breaks out above the resistance line, we can expect a strong bullish move, following the path highlighted in blue polyline, with potential to reach the long-term target of 🔹 1.4 million USDT. 🚀
📌 If you listen closely, this chart’s basically yelling: “Something’s coming...” 🎧👀
🧭 Next move will define the trend — don’t blink.
BITCOIN TRADING IS 100% PROBABILITY,ANY KEY LEVEL IN THIS CHART CAN FAIL,pls manage your risk and build a strong mindset.
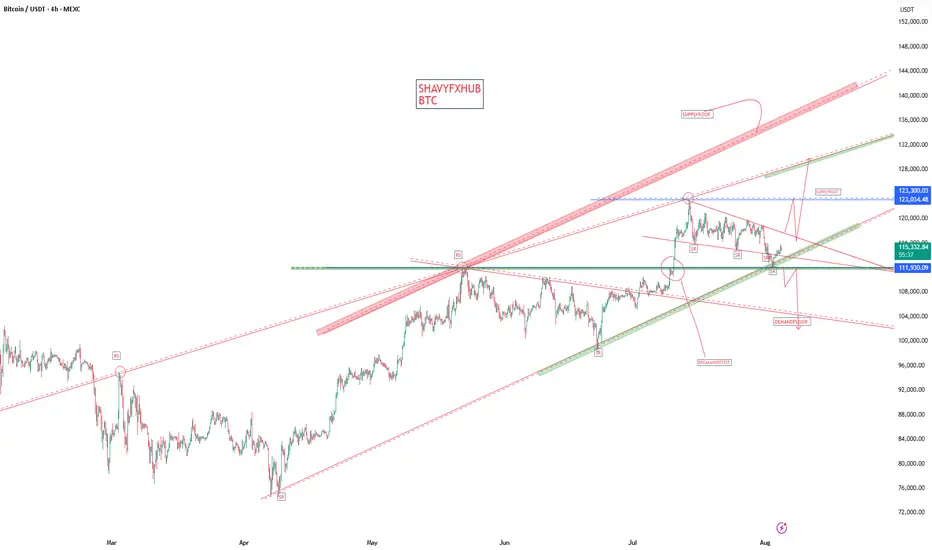
bitcoin is showing a bullish drive. If i retest the 123k level again and gets rejected we are selling down ,the structure has given us a clue on 135k and above possible upswing on sentiment ,this level represents the ascending trendline and a supply roof.
#btc #bitcoin #crypto #eth #sol
Plan $BTC - 08/08/2025Daily timeframe (D)
📍 Price is reacting at the resistance zone.
📌 Triple-top pattern → price has shown a decent recovery, retesting the previous support zone at 117k – 117.5k before reacting.
⚠️ Only consider short positions if the lower timeframes form a clear bearish structure.
✅ Prefer looking for pullbacks to long, as the previous daily candle showed strong buying momentum.
H4 – H1 timeframe
🎯 Long target: 118k (Fibonacci extension 1.618).
📌 Long entry zones:
1️⃣ 116k1xx → H1 base + EMA34 test.
2️⃣ 115k – 115k4xx → Support zone + Fibonacci 0.5 retracement. → Can also long selected altcoins: CRYPTOCAP:XRP , $HEADEL, CRYPTOCAP:AVAX , $APT.

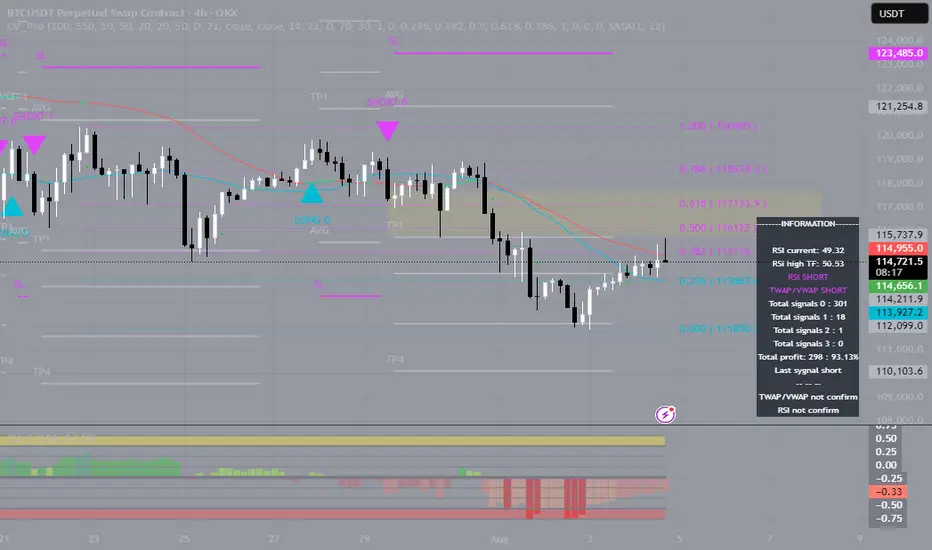
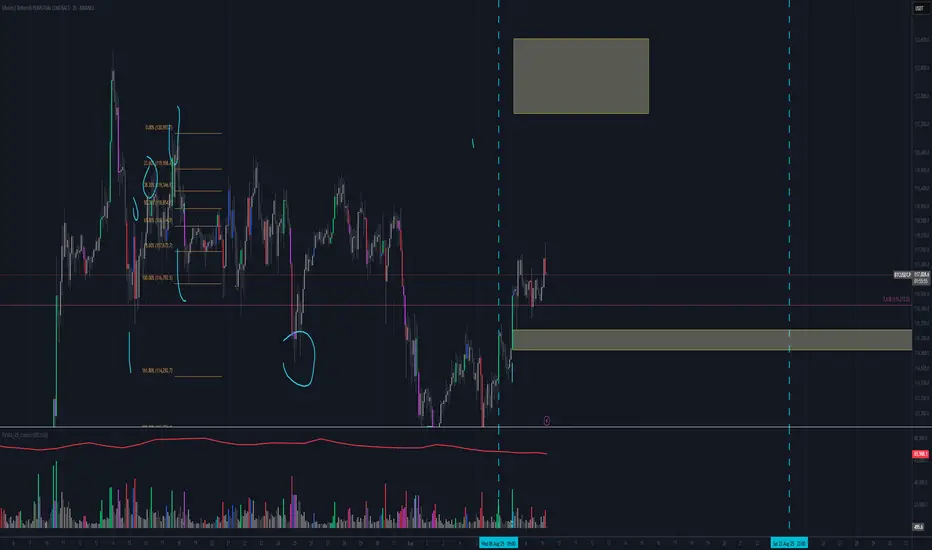
[SeoVereign] BITCOIN BEARISH Outlook – August 10, 2025In the August 10th idea I’m sharing today, I would like to focus on the bearish perspective.
As a swing trader, I am not particularly tied to the major trend, but I believe that this decline is meaningful enough within the short time frame, and I would like to share this perspective with you.
The main bases used in this idea are as follows:
-Harmonic 1.902 Crab Pattern
-Traditional ratio relationships in Elliott Wave Theory (1.618)
-Full Fibonacci 0.618 retracement
Based on this, I have set the average target price at approximately 114,500 USDT.
As time goes by, I plan to add more specific drawings to support this idea so that you can understand it more easily, and if the target price is reached, I will also share the entry price and take-profit price for your reference.
Thank you very much for reading,
and I sincerely wish you an overwhelming amount of strong luck.
Thank you.

A big drop is ahead in the coming weeksBitcoin appears overbought, and in the current global economic climate, cash is king — a dynamic that may prompt investors to lock in profits. I anticipate a pullback to the 0.5 Fibonacci level, which sits around $69,000.

BTC Potential Bullish continuation to a new ATH BTC Looking Bullish after the Pull back .we anticipating a bullish continuation from 114.600 to the high 122k and above. If you trade risk management is a must so you don't get caught up in the volatility of the crypto Market. #Btcusd
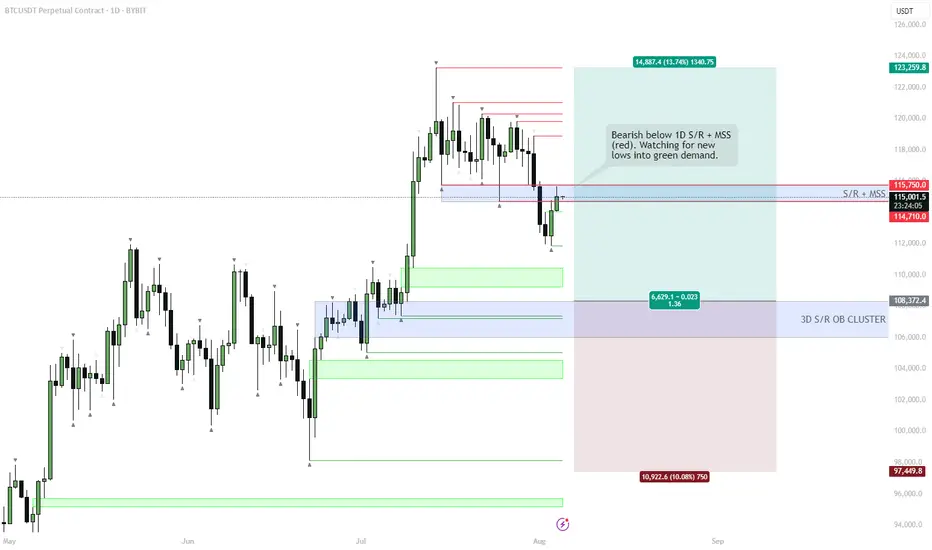
BTC – Still looking heavy below key resistanceDespite a short-term relief bounce after Monday’s drop, BTC remains below the critical 1D MSS + S/R (red box). Structure is weak until this level is reclaimed. Bears remain in control as long as price can’t close above 115.7k.
Plan:
Maintain bearish bias while below the red box — expecting new lows, targeting the green demand/OB cluster around 108.3k.
Flip the red box (close above 115.7k) and the outlook shifts to neutral or bullish.
Btc wants to 124k!Setup is here. Btc.d will be move the price to 124k usdt.
This is not financial advice, DYOR
BTC Long Setup (Post-Liquidation Reclaim)Hey Candle Fam,
The weak hands just got flushed harder than a memecoin rug—perfect. While retail panicked on the dip, smart money was quietly filling bags near $114k. Now it’s our turn to strike with precision.
🔥 BTC Long Setup (Post-Liquidation Reclaim)
🎯 Entry: $114,390–$113,800
🛡️ Stop Loss: $111,900
💰 Targets: $121k / $130k / $140k
📊 Strategy: Liquidity Grab + Weekly Demand Tap
– HTF bias: Still bullish, above key $115k zone
– LTF confluence: Sweep of lows + CHoCH forming on 12H/1H
– Footprint data: Volume absorption + delta flip confirm buyer interest
⚠️ Caution:
Breakdown below $110k would invalidate this setup and likely trigger a strong bearish leg. This is not a “to the moon” YOLO.
Stick to your system, manage risk, and remove emotion.
🧠 Final Note:
We don’t chase dreams—we execute plans.
All the hours we spend studying this game? It’s not for fun. It’s for freedom.
Financial independence is the goal—this is the craft.
Candle Craft | Signal. Structure. Execution.
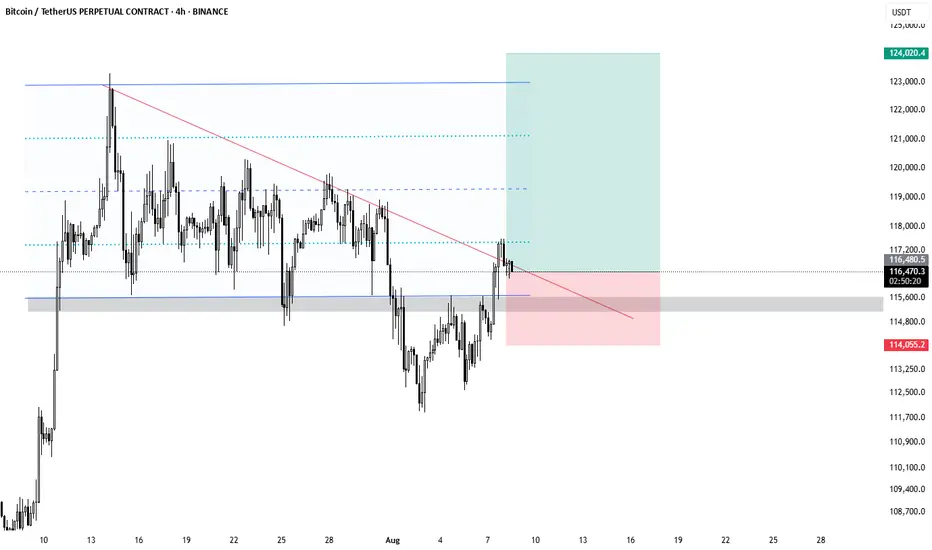
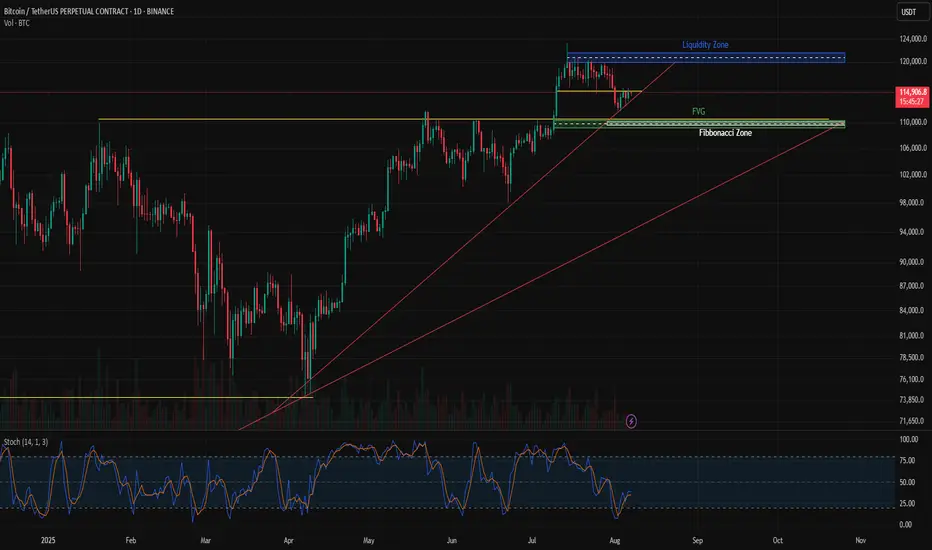
BTC/USDT – Key Zones to Watch: Liquidity Grab or FVG Reclaim?Bitcoin is approaching a critical decision point after consolidating near recent highs. Price has formed a tight range just below a major Liquidity Zone (marked in blue), while sitting on a strong ascending trendline.
🔹 Liquidity Zone (~$121K): This is a key area where stop hunts and fakeouts often occur. If price pushes into this zone without follow-through, expect a possible reversal.
🔹 FVG + Fibonacci Confluence (~$109K–$110K): This green zone is a key demand area. If price retraces, this could act as a magnet for buyers and potentially offer a high R/R long opportunity.
🔹 Ascending Trendline: So far respected well. A break below it could signal weakness and increase the probability of a revisit to the FVG zone.
Scenarios to Watch:
✅ Breakout above Liquidity Zone → Could trigger continuation toward new highs.
🔁 Rejection from Liquidity Zone + break of trendline → Watch for retrace into FVG zone.
📊 Bias: Neutral short term – waiting for breakout or FVG test.
Possible run to 130 in the cardsEasily invalidated.
We are using the patterns from the price action post threshold break (redline in bottom pane)
These breaks are unseen on this time frame
The volume instabilities are between the 15 minute and the 1 hour. I would look for breaks under 15 minutes, too much noise at that level. Go ahead and test it yourself. See my script posted on trading view for details.
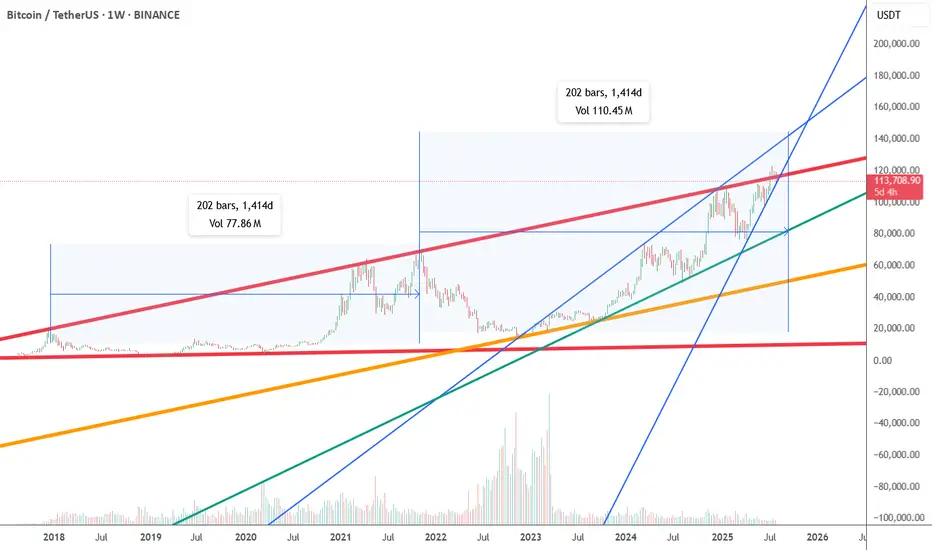
on weekly chart btcusdt long term shortAccording to the weekly chart it would say that btc is near or at the peak and in the next few weeks or months it will start to fall.
As can be seen on the chart, if btc continues to follow the time interval of 202 bars and the fractal structure of the previous period, the next decline should last longer than a year. The lines of resistance in that case would be:
1. green line or about 90k
2. orange line or about 55k
3. red line or about 15k
Disclaimer: This is not financial, investment, trade or other advice. This is my personal opinion which can very easily be wrong.
You trade at your own risk.
its btc short according to mirrior concept A Bitcoin short position based on Fibonacci levels and market sentiment is a trading strategy to profit from a price drop.
It involves:
1. **Technical Analysis:** Using Fibonacci retracement levels (e.g., 61.8%) to identify a potential price reversal point after a bounce.
2. **Sentiment Analysis:** Confirming the reversal signal by checking for "extreme greed" in the market, which suggests overbought conditions and an impending correction.
A trader enters a short trade when both signals align, expecting the price to fall from that key resistance level.
Equal highs sweptBTC has just swept the previous daily relative equal highs whilst re balancing a 4 hour fair value gap.
Expecting a pull back to 115,880 💪

weekend buy zone for bitcoinAs volume trails off due to markets being closed leaves room for manipulation. Which is why we tend to stay away from weekend trading unless we have a set in stone game plan as we do now. We take the variables of longs vs shorts, days of the week, and market maker manipulation to strengthen our pvsra volume threshold trading strategy. See where we got this liquidity below, on the 5m timeframe.
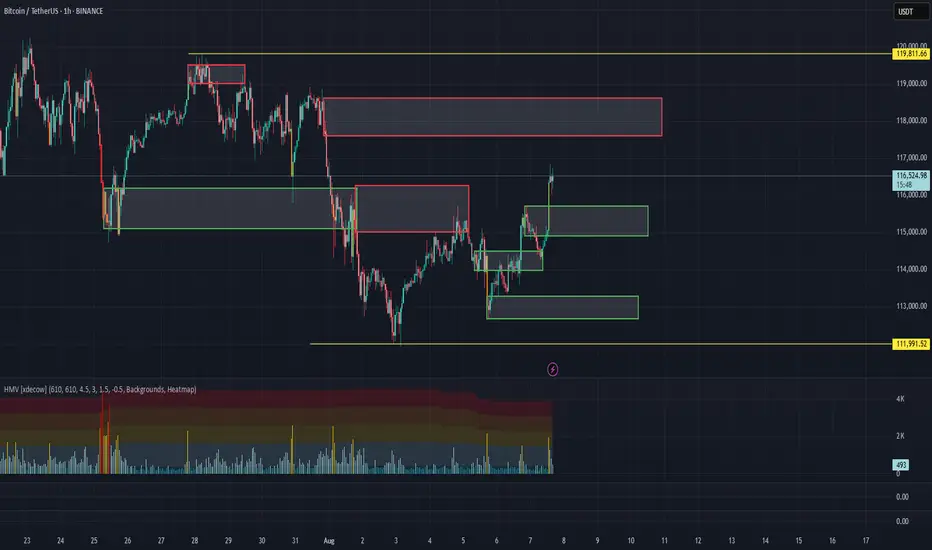
BTC/USDT Analysis – Full Trend Reversal
Hello everyone! This is the daily market update from a CryptoRobotics trader-analyst.
Yesterday, Bitcoin broke the local market structure to the upside and tested the previously highlighted zone at $114,500–$114,000 (a mirror volume area). A strong buying reaction followed immediately, pushing the price to a new local high.
At this point, we are witnessing a full shift in market direction toward an uptrend. Seller activity remains weak, so we expect the price to continue rising — at least toward the next selling zone at $117,600–$118,600 (volume accumulation).
Below, a new volume area has formed between $115,800 and $114,900. We are watching closely for buyer activity there. If confirmed, it could serve as a long entry. Without such confirmation, the current breakout could turn into a false move, in which case the market may return to sideways rotation.
Buy zones:
$115,800–$114,900 (volume cluster)
$113,300–$112,700 (local absorption of selling)
$110,000–$107,000 (accumulated volume)
Sell zone:
$117,600–$118,600 (accumulated volume)
This publication is not financial advice.
Bitcoin subida a corto plazoBINANCE:BTCUSDT About to explode, I expect a strong market rise, it's only a matter of time, don't stay out