Why BTC Remains Bullish and Its Next Potential Move !bitcoin has completed and broken the ascending triangle in the daily timeframe, The price is currently supported well, which can increase the price. I expect the price to rise to around 119k .
Stay Awesome , CobraVanguard
BTCUST trade ideas
Bitcoin Price Outlook 2025–2030 | EMA & MACD SignalsBitcoin trades near $114K in August 2025, sitting just below EMA 9 and EMA 15, while the EMA 200 at $100,870 keeps the long‑term trend bullish. Support at $114K remains crucial, with resistance at $120K–$122K. A close above short‑term EMAs could spark a move toward $127K, while rejection may bring a retest of $110K. Long‑term analysis points toward a potential rise to $300K–$350K by 2030.
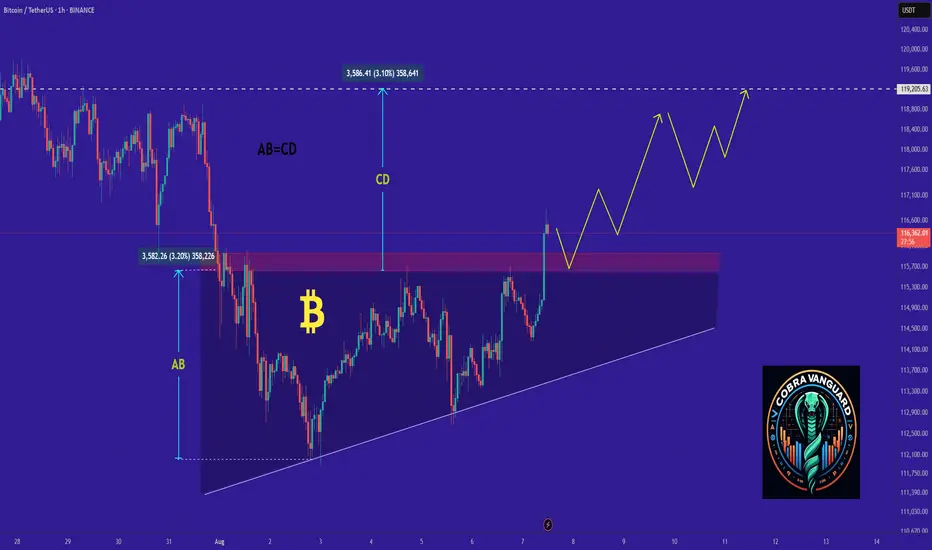
Bitcoin Price Outlook: Bull Flag Pattern Hints at Potential BreaBTC price Outlook: Bull Flag Pattern Hints at Potential Breakout Toward $129K
The local format of the corridor is interrupted by a wide, stronger one, based on which one can conclude about a rebound, and it is quite possible that this will happen tomorrow, during the opening of markets and trading
Also on the local BTC chart, this figure forms an incompletely formed "Bullish Flag" pattern, which also indicates growth
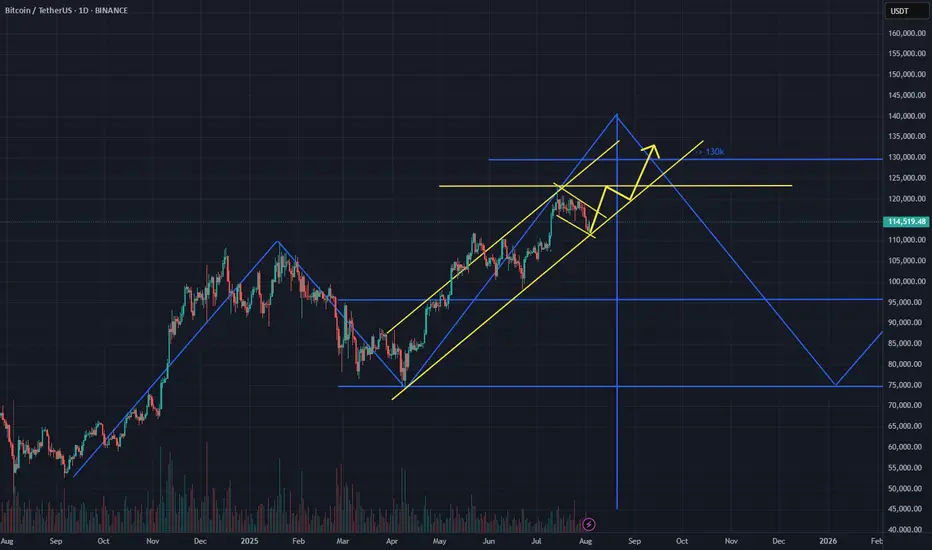
Also, this scenario does not contradict my previous analysis, where a global "Head and Shoulders" pattern is emerging on a 5-year time frame
Current price: $114.227
Expected according to the local scenario $123k and the price according to the global "Head and Shoulders" pattern remains within the same limits of $124k or $129k
Low probability of breaking through the $112k level, since this mark is the bottom of the ascending corridor
This analysis is based on the technical pattern and also incorporates AI to provide more accurate results.
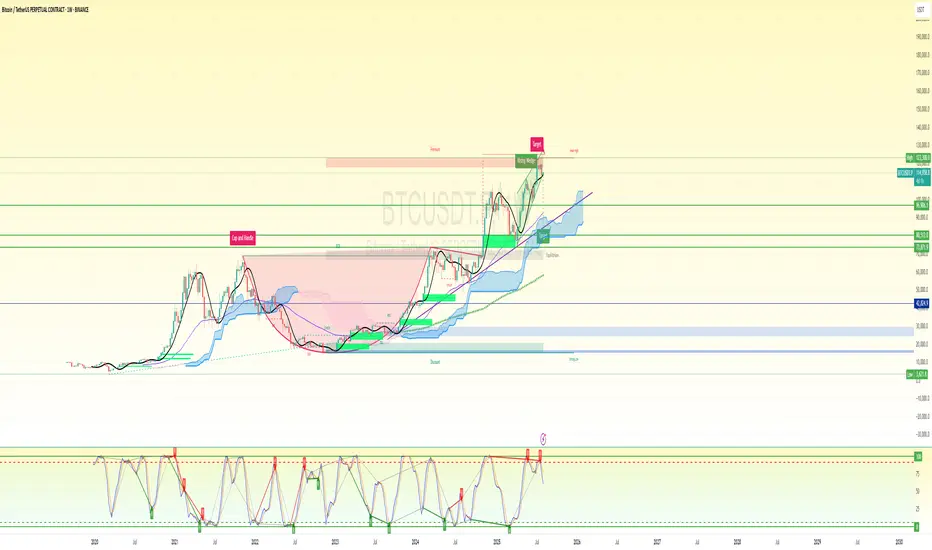
BTC SHORT SET UP (only facts in the chart)📌 Chart Summary
Price: ~$115,000
Pattern: Rising Wedge (Bearish)
Macro Structure: Completed Cup & Handle
Stochastic RSI: Overbought + Bearish cross confirmed
Ichimoku Cloud: Price far above cloud – extended
EMA/MAs: Bullish but overstretched
🧠 Bias-Free Most Probable Setup (Weekly Outlook)
🟥 Bearish Sniper Setup — High Probability
The chart is showing rising wedge exhaustion + Stoch RSI bear cross in extreme overbought = probable correction ahead.
🔽 Short Entry Plan (Sniper Setup)
Entry (Short): $114,200 – $116,000
Ideal sniper zone inside the wedge breakdown area / resistance rejection zone
Stop Loss: $123,000
Above wedge top and key psychological resistance
Take Profit 1 Range: $96,000 – $99,000
Previous major horizontal resistance zone and wedge support retest
Take Profit 2 (final target): $80,500 – $83,000
Major structure zone + Ichimoku cloud top + high-volume node
Risk:Reward: 1:3.5 to 1:5+
📈 Alternate Scenario: Bullish Breakout Setup (Low Probability but noted)
If BTC breaks and closes above $123,000 on weekly, wedge invalidates and opens target:
Breakout Target: $143,000 – $150,000
Based on wedge measured move + Fib extension
⚠️ Additional Confluences Supporting Bearish Bias:
Weekly RSI + Stoch RSI overbought and curling down
Rising wedge near exhaustion
Bearish divergence risk with higher highs in price, lower oscillator momentum
Volume is declining despite price rising – exhaustion signal
🧩 Strategic Notes:
Avoid longing here unless $123K clean break + volume spike
Best play = wait for confirmation of wedge breakdown to enter short
Leverage carefully – this is a macro weekly timeframe setup
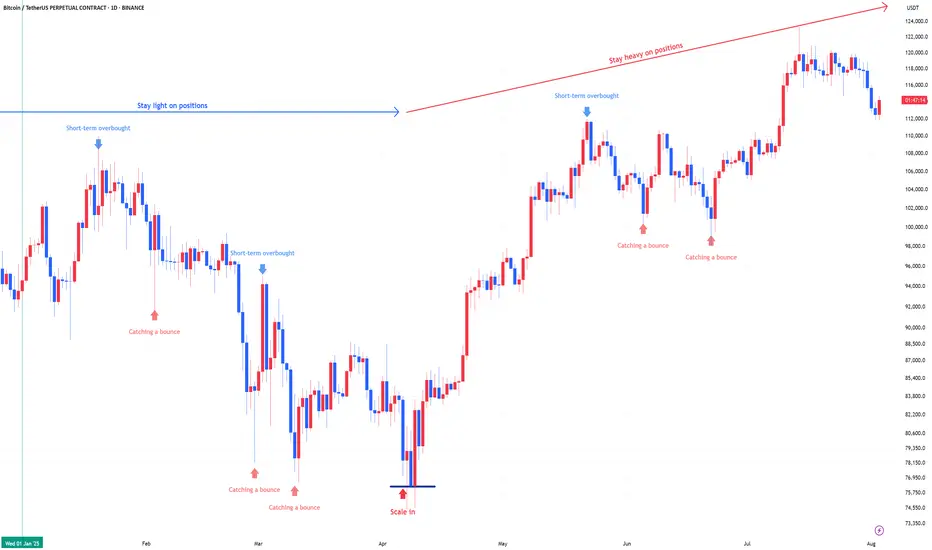
Bitcoin : Stay heavy on positionsBitcoin : Stay heavy on positions (2x)
Short-term overbought is noise. Focus on the bigger picture.
For new Bitcoin entries, now is the time.
If you're using leverage, I’d wait for a scale-in signal before jumping in.
Btc just hit the 1.618 golden fib no analysis keep posted Keep posted if interested, i just cant show it right now i want to have million of confirmation that it is accurate but i plotted it just right it really just hit it in red cherry just like in game of darts keep posted how i unfold it in coming months/years, it is still the same asset we know the only thing thats different is btc just trying hard to mimic the past moves but its clear as day that its shorthanded in terms of market capitalization. 🥏🐝✅✅..
BTC/USDT Analysis – Continued Growth
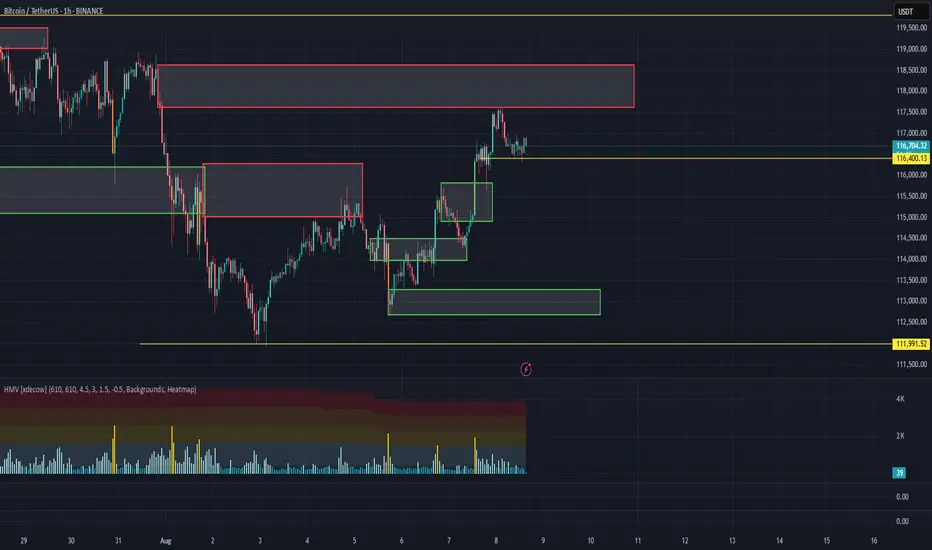
Hello everyone! This is the daily update from a CryptoRobotics trader-analyst.
Yesterday, Bitcoin tested the local volume area at $115,800–$114,900 and then continued its upward movement, reaching the lower boundary of the strong resistance zone at $117,600–$118,600 (accumulated volume), followed by a pullback.
Currently, the price is hovering around the volume support zone near ~$116,400. Selling pressure is relatively weak and is being absorbed by buyers — which is confirmed by delta data. This makes it reasonable to expect another wave of buying and a deeper test of the resistance zone. After that, we’ll watch closely for the seller’s reaction.
Buy zones:
• ~$116,400 (local volume support)
• $113,300–$112,700 (local absorption of selling)
• $110,000–$107,000 (accumulated volume)
Sell zone:
• $117,600–$118,600 (accumulated volume)
This publication is not financial advice.
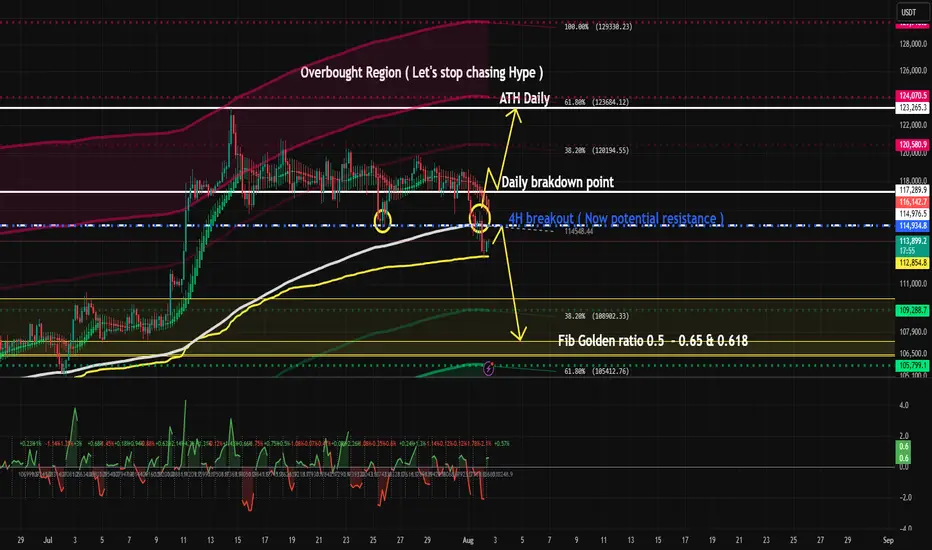
BTC 8H – Fib Support Holds, Will Bulls Defend This Reclaim Zone?Bitcoin is back at a key decision point on the 8H chart — retesting the exact zone it broke out from just two weeks ago. This former resistance has flipped to support, but with momentum cooling off, bulls need to step in fast to avoid a deeper retrace.
🔹 Structure & Levels
Price is hovering inside a reclaimed range (blue box), retesting it from above.
Just below sits the Golden Pocket (0.5–0.618) retracement zone from the July rally — a classic bounce zone if the reclaim fails.
The 0.5 level at $110,879 aligns with previous consolidation structure, adding extra confluence.
Further below lies the 0.786 at $103,802, which marks invalidation for most swing long setups.
🔹 Momentum Check
The Stoch RSI has started curling down from overbought, suggesting momentum may stall short term.
If bulls can’t defend the current reclaim zone, we could see a flush into the Fib pocket before trend continuation.
🔹 Bias & Trade Idea
Holding this level = bullish continuation toward $118K–$120K range highs.
Lose it cleanly = watch for signs of reversal inside the golden pocket.
Risk is defined, structure is clear — and BTC has a habit of reacting cleanly to these zones.
Are you buying the dip now — or waiting for a cleaner tag of the Fib levels?
Drop your thoughts 👇

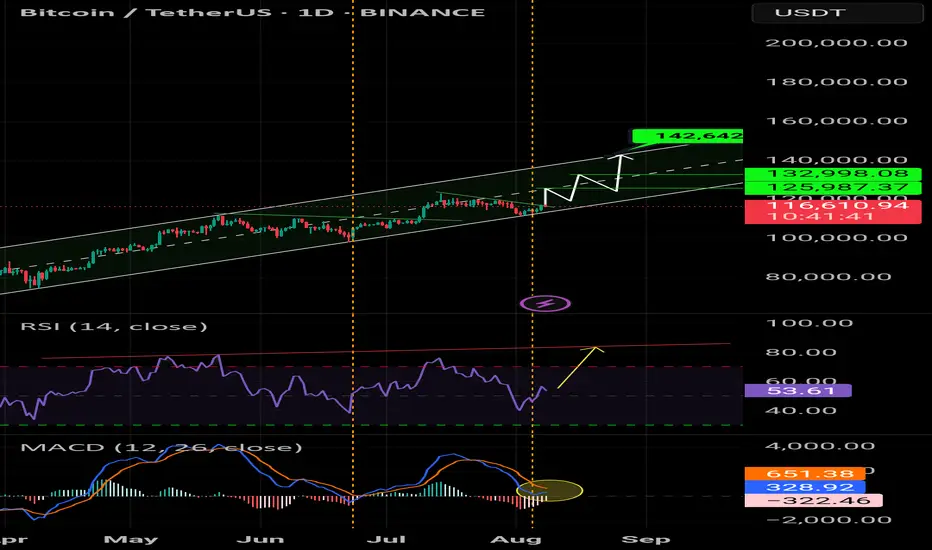
Bitcoin Go 140kAfter a strong break of the trend line, it is ready to launch to the targets of 125,000, 132,000, and 142,000. The MACD and RSI also gave a bullish signal.
125000
132000
142000
🤪🤪🤪
BTC/USDT NalysisThis is a full BTC/USDT market analysis including all technical indicators, chart patterns, trend analysis, and strategies for potential long/short entries.
btcThis is not a signal.
Just my outlook on BTC based on data
No fluff
No fancy indicators
And definetly no rectangles
Just watch and see how it plays out, as we are currently in a big indecision zone as well as the weekend I would not enter any positions now but rather wait for monday-wednesday to enter.
BTC- On a Crucial Testing PointBTC Seems to be testing a strong support point, if it bounce back , it's good opportunity to buy, otherwise sell.

Overhyed Punishment This is what happens when everyone starts to fomo.
Lucky things, I sold some of my Altcoin with profit when BTC went into overbought band as in my chat.
BTC is bearish as long as below 117.6 to 118k :) . Good luck
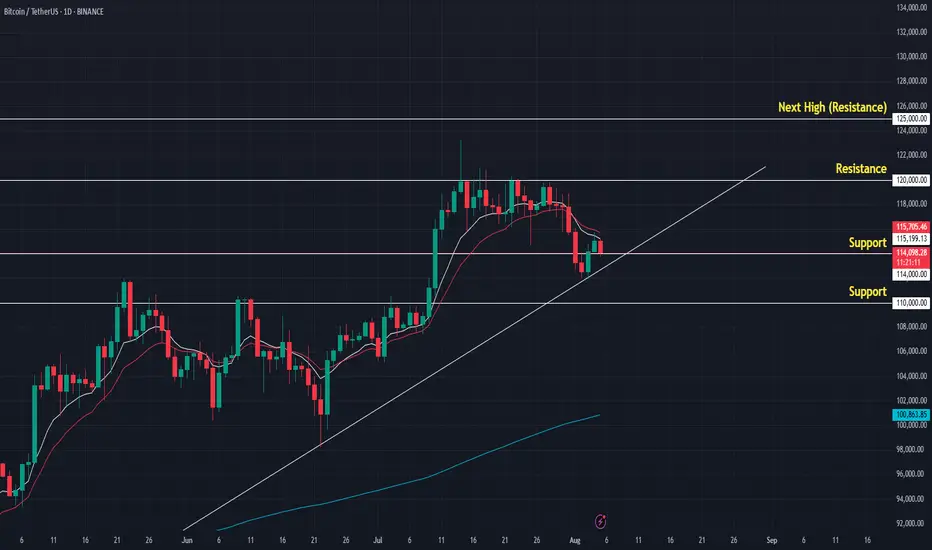
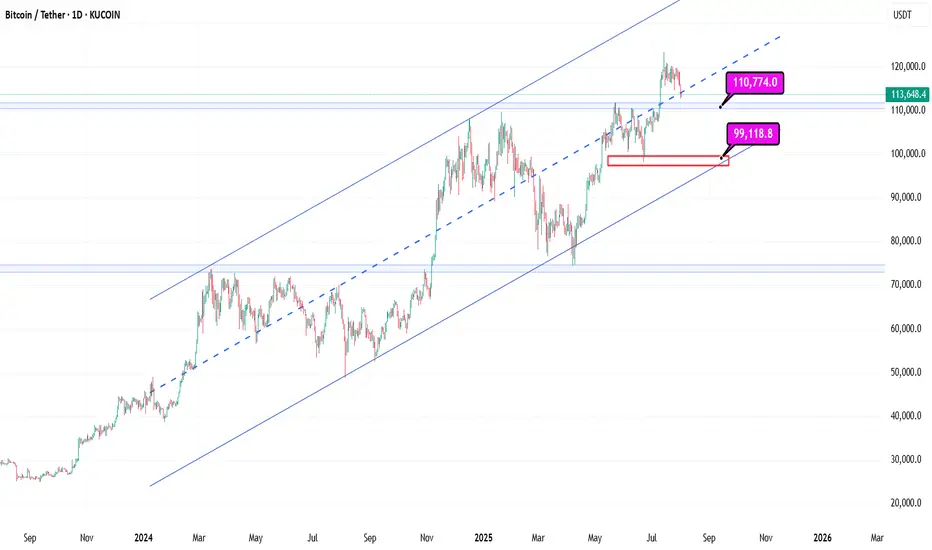
Bitcoin Support: Midline Channel Support at 114kBitcoin
1D
Bitcoin Support: Midline Channel Support at 114k and then Blue Line 110k
With these supports holding in the long term, progress is still possible
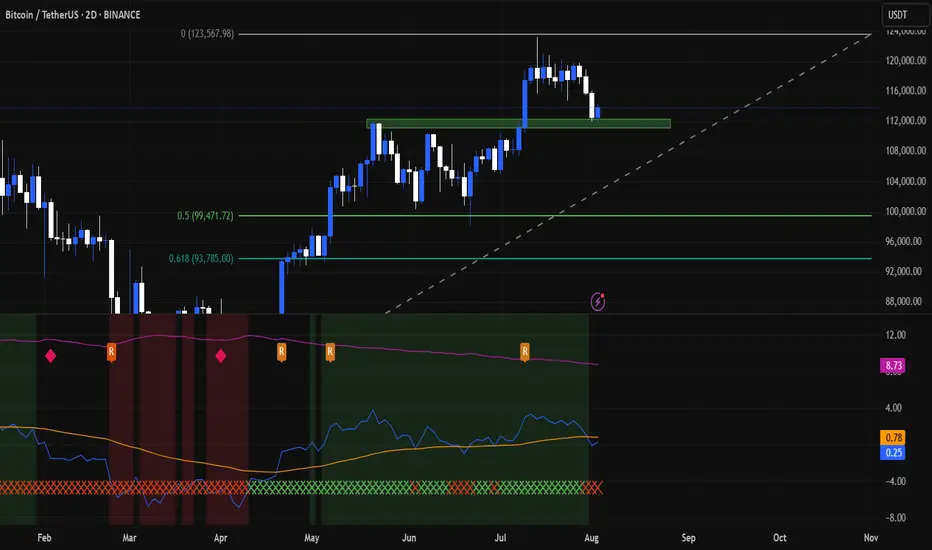
Bitcoin Enters Correction Mode?Bitcoin is already trading at support in the form of the previous all-time high and EMA55. Bitcoin is down more than 8% since its 14-July all-time high. We can see that a correction is already in, a retrace. This retrace we consider part of the normal workings of the market, price fluctuations which invariably always show up. The end result is a higher high, a rising wave, higher prices on the long haul.
Support is strong at current prices but even stronger is the support zone right above $100,000. As long as Bitcoin trades above $100,000, we will continue with a strong bullish outlook. If Bitcoin manages to move and close below $100,000 monthly or weekly, we will consider the short-term, the mid-term and update our map if necessary. For now, the bulls are still in control.
When Bitcoin peaked 22-May it went sideways for an entire month. From a peak of $112,000 it hit a low of $100,000. Now we have a peak around $123,000 and prices can easily swing around in this wide range.
After a few weeks, or several months, exactly as it happened last time, Bitcoin will go up. So you can expect retraces and corrections, but this is only short-term long-term we grow.
Namaste.

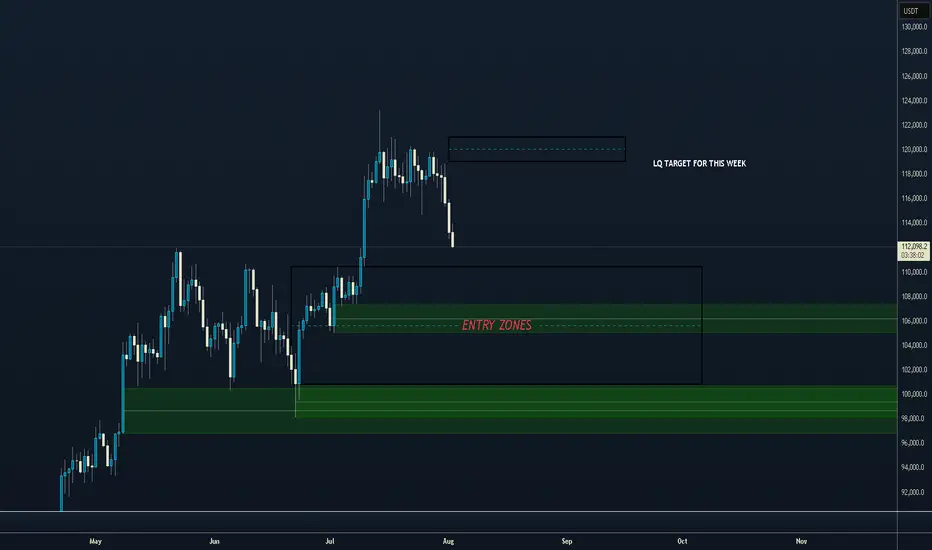
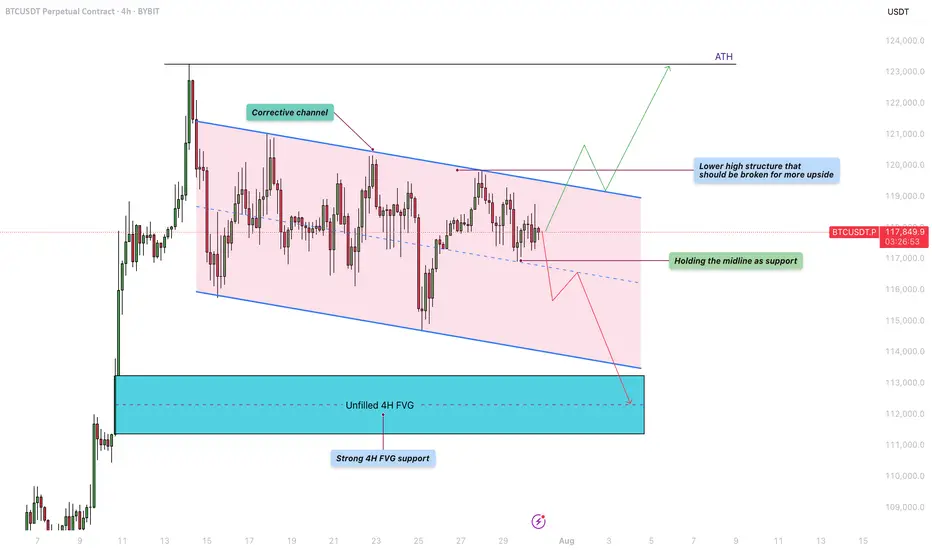
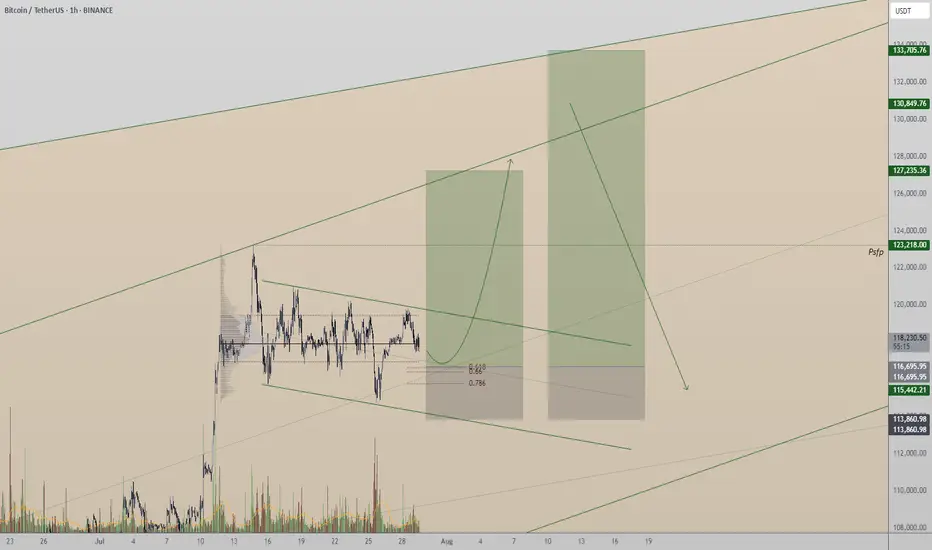
Bitcoin - Will the liquidity at $122K be the next target?Bitcoin is currently trading within a defined corrective channel, which has been developing over the past few weeks. Price action within this structure has been characterized by a sequence of lower highs and lower lows, suggesting a mild downtrend. However, these movements lack strong momentum, indicating that the market is consolidating rather than entering a deeper correction. This kind of structure often precedes a significant breakout, and given the nature of the current price action, a retest of previous highs remains a realistic possibility.
Bullish Scenario
Looking at the overall structure of the channel, a bullish breakout seems increasingly likely. For this scenario to unfold, BTC needs to hold the midline of the channel as support. If this level is respected, it could pave the way for a push towards the upper boundary of the channel and a potential break above the lower high structure near $120,000. A successful breach of that level could trigger a move toward the $122,000 liquidity zone, with the potential to challenge the all-time high (ATH) in the near future. Holding the midline and breaking above key resistance would provide confirmation of strength and continuation to the upside.
Bearish Scenario
On the flip side, if BTC fails to hold the midline as support and starts closing below it on the 4H timeframe, we could see a renewed move toward the lower boundary of the corrective channel. This could lead to a test of the unfilled 4H fair value gap (FVG) highlighted in the chart, located around the $112,000 – $113,000 area. This zone also coincides with a strong historical support level, making it a logical area where buyers might step in and provide the momentum needed for a more sustainable bullish reversal.
Final Thoughts
While both scenarios remain valid, the price structure within the corrective channel currently leans slightly more toward a bullish outcome. The lack of aggressive selling and the potential for liquidity above the previous highs support this view. However, trading is never about certainty but about preparing for various possibilities. Being aware of both bullish and bearish setups allows traders to react with flexibility and discipline depending on how the market unfolds in the coming sessions.
-------------------------
Thanks for your support. If you enjoyed this analysis, make sure to follow me so you don't miss the next one. And if you found it helpful, feel free to drop a like 👍 and leave a comment 💬, I’d love to hear your thoughts!
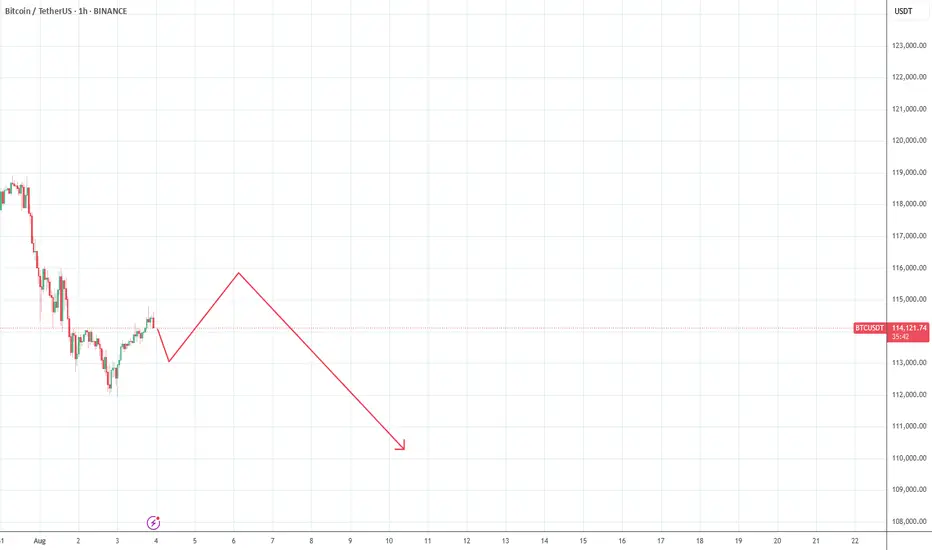
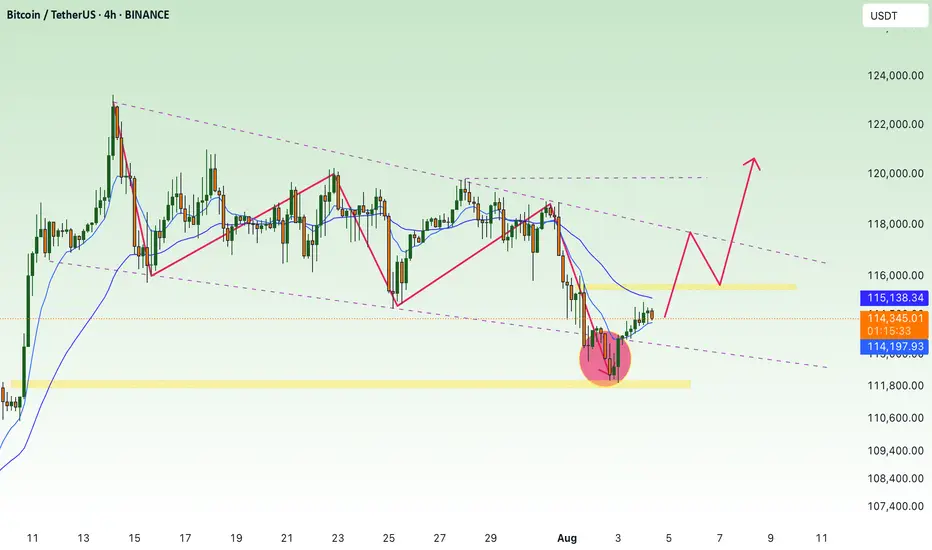
BTC accumulates, slightly adjusts down💎 BTC PLAN UPDATE – START OF THE WEEK (04/08)
🔍 1. Current Technical Structure
Price Pattern: The chart shows BTC is forming a falling wedge pattern, with converging support and resistance lines.
False Break: There was a false break below the strong support zone around ~112,000, followed by a sharp rebound. This indicates buyers are actively defending this level, showing potential buying pressure.
Fibonacci Retracement: From the recent low to high, the 0.5 (115,559) and 0.618 (116,361) Fibonacci levels are acting as key resistance zones.
Key Price Levels:
• Strong support: 111,800 – 112,300
• Near resistance: 115,500 – 116,500
• Next resistance: downtrend line and previous high around 118,000 – 119,000
🔄 2. Possible Trend Scenarios
✅ Main scenario (bullish):
BTC made a false break below the wedge → rebounded toward Fibonacci resistance → potential:
• Continue rising to the 115,500 – 116,500 zone
• If it breaks and holds above this zone, BTC could break out of the wedge pattern and target 118,000 – 120,000
• A longer-term target could be the 1.618 Fibonacci Extension around ~123,159
❌ Alternative scenario (bearish):
If BTC fails to break above 116,000 and gets rejected:
• It may retest the 112,000 support zone again
• A breakdown below this support would bring back the downtrend
🔄 3. Bullish Supporting Factors:
• The false break signals a shakeout of weak sellers.
• A potential inverse head-and-shoulders pattern is forming, supporting a bullish reversal.
• Moving Averages (MA): Price is nearing the 200 MA (red) – a possible bullish crossover with shorter-term MAs may occur, signaling a buy.
🧭 Suggested Trading Strategy
• Safe buy zone: Around 113,500 – 114,000 if there’s a pullback.
• Take profit in stages: 116,500 – 118,000 – 120,000
• Stop-loss: Below 112,000 in case of a confirmed breakdown
Is Bitcoin Pulling Back to the 100,000 Area?If we consider the $124,000 level as Bitcoin's high, Bitcoin should correct to the 0.5 Fibonacci level. Write your comment.
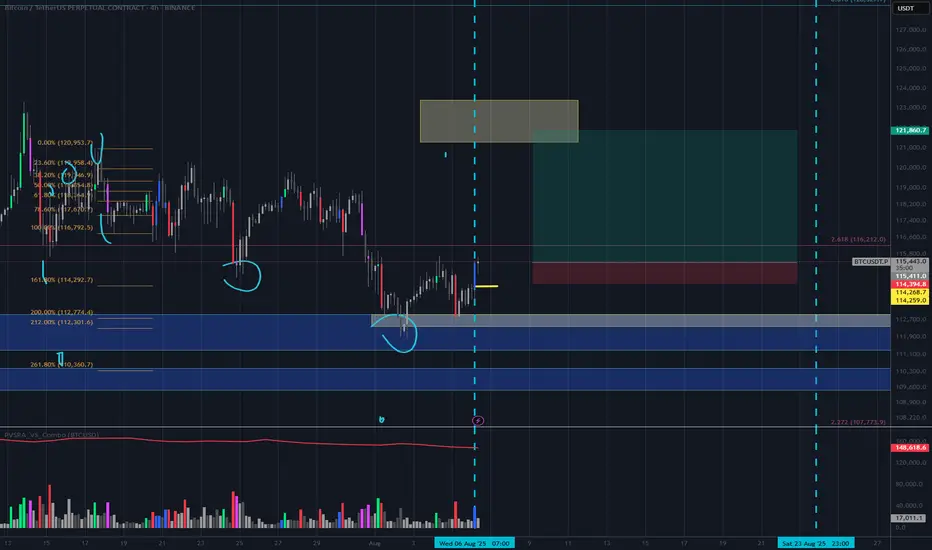
Bitcoin:Can Support at Point of Control Fuel a Move to New High?Bitcoin is currently consolidating at its local point of control, facing immediate resistance from a Fibonacci-aligned value area low. A critical reversal from here could pave the way to new all-time highs.
Bitcoin has entered a pivotal phase, trading at a key technical region that could determine its short-term direction. Over the past week, price action has hovered around the local point of control, showing signs of absorption and consolidation. With immediate resistance looming at a major confluence level, the next few daily candles may set the stage for either a breakout or a deeper retracement.
Key Technical Points:
- Local Point of Control: Bitcoin is ranging around this level, showing indecision
- Value Area Low + 0.618 Fib: Immediate resistance forms strong technical confluence
- Swing Low Critical: A break below the last swing low would invalidate bullish structure
Bitcoin’s current position around the local point of control reflects a phase of market equilibrium. This level represents the area of highest traded volume over the recent range, acting as both support and resistance at different times. The fact that price has revisited and hovered here for multiple days suggests active positioning from both bulls and bears.
Just above lies the value area low, which is in direct confluence with the 0.618 Fibonacci retracement from the recent swing high to swing low. This dual-layered resistance is significant — if Bitcoin is able to break above and reclaim this zone, it could unlock the next leg higher.
However, traders must remain cautious. The most recent swing low, formed during the last pullback, now acts as the final line of defense for bulls. A loss of this low would shift market structure to bearish and potentially initiate a correction deeper into the prior range.
So far, the lack of high-volume breakdowns suggests sellers have not yet gained control. But without a decisive bounce and follow-through above resistance, the risk of a failed reversal increases.
What to Expect in the Coming Price Action:
If Bitcoin holds above the point of control and mounts a successful challenge of the value area low, a rotation toward a new all-time high becomes increasingly likely. However, failure to defend the swing low would invalidate the setup and favor further downside. All eyes remain on the current consolidation for clues on the next major move.
Technical Analysis: All About Its Origin
Technical Analysis is the discipline that studies and graphically records the price and volume changes of a stock or asset, with the aim of exploiting recurring patterns and phenomena with predictive characteristics.
The origins of Technical Analysis date back to 17th-century Japan, in the rice futures markets of Osaka. After a century of internal wars among the daimyo—Japanese feudal lords—General Tokugawa emerged victorious at the Battle of Sekigahara (1600), initiating the unification of Japan. To maintain the loyalty of his subjects, Tokugawa, appointed Shogun, consolidated his power and ensured the allegiance of his followers by concentrating the political-military elite and their families in Edo (modern-day Tokyo).
At that time, the primary source of income for the daimyo was rice collected from the peasants working their lands. Since transporting rice to Edo was impractical, it was stored in the port of Osaka. The proximity of the daimyo in Edo sparked a competition for prestige, manifested through luxuries and other excesses. To sustain this lifestyle, the daimyo sold stored rice and even future harvests. For this “future rice,” warehouses began issuing contracts known as “empty rice.” These contracts were traded in a secondary market, giving rise to one of the world’s first futures markets.
The most prominent trader in this market was Munehisa Homma, who operated in the early 18th century. For Homma, markets were heavily influenced by the psychology of investors, who sometimes perceived a harvest differently from reality. In his book, *The Fountain of Gold*, he expressed ideas that remain highly relevant today, particularly what many Western traders know as contrarian opinion:
“When the price of rice begins to rise, orders come in from all directions at once, and soon the Osaka market joins the frenzy. The price of rice rises faster when people place orders even for stored rice, and it becomes clear that a buying fever is underway. But when you want to be in the position of placing buy orders like everyone else, it’s important to be on the side of those placing sell orders. When people move in unison, rushing westward with the determined intention of participating in the rise, that’s the moment for you to head east, and you will discover great opportunities.”
Steve Nison, an investor who popularized the use of Japanese candlesticks in the West, states in his book *Beyond Candlesticks*:
“In the material I translated, candlestick charts are often called Sakata charts, in reference to the port city of Sakata, where Homma lived. However, based on my research, it is unlikely that Homma used candlestick charts. It is more likely that these charts were developed in the early part of the Meiji period in Japan (late 1800s).”
It is worth noting that, although Homma may not have used candlestick charts, this type of graphical representation was the evolution of centuries of experience using price records for predictive purposes.
The Revolution of Japanese Candlestick Charts
The graphical representation of prices has been a determining factor in the evolution of technical analysis, marking a clear distinction between investment approaches in the East and the West. While traditional bar charts, predominant in the West, were limited to showing opening and closing prices, Japanese candlestick charts offered a more comprehensive view of investor psychology. These charts incorporated not only the opening and closing prices but also the highs and lows of each session, represented intuitively through the body and wicks of the candles.
Perhaps Western investors, constrained by the simplicity of bar charts, developed an approach more focused on studying price formations, while the Japanese could make decisions based on the analysis of small groups of candles. Over time, however, both approaches proved equally practical, and a multi-timeframe understanding became part of the operations of both Western and Japanese investors.
An example of the application of a multi-timeframe approach in the West is found in the father of modern technical analysis, Richard W. Schabacker, who, despite his short life, left a prolific body of work. In his book *Technical Analysis and Stock Market Profits* (1932), he classifies markets into major movements (monthly), intermediate movements (weekly), and minor movements (daily). In Japan, Goichi Hosoda, the creator of the Ichimoku Kinko Hyo indicator, is the best example of an investor who dedicated his life to cataloging and studying price formations beyond the use of candlestick patterns.
Over time, modern Western investment platforms adopted the innovations of Japanese candlestick charts, integrating the ability to display highs, lows, openings, and closings in a single format.
In the early 20th century, scholars of charts in the West were known as chartists, but today, “Chartism” is associated with a classical methodology popularized by journalist and investor Richard W. Schabacker (1899–1935) and later by the book *Technical Analysis of Stock Trends* (1948) by authors Robert D. Edwards and John Magee.
Theory on the Emergence of Technical Analysis
Since the dawn of humanity, people have sought to represent the phenomena around them to understand or communicate information. Whether through cave drawings, symbols, or written records, visual representation has been a fundamental tool for making sense of the world. Undoubtedly, price fluctuations were a phenomenon that invited analysis.
The earliest investors, using graphical representations, aimed to find order in chaos. By meticulously recording price movements, these pioneers likely discovered something surprising: repetitive patterns that seemed to predict future behavior. This discovery must have been thrilling, as it offered the promise of significant profits, often with seemingly low risk.
Without needing to understand market psychology, as later technical analysts would, these early investors found a practical advantage in these patterns. When enough of them identified and acted on the same pattern, it tended to fulfill itself more frequently, reinforcing its validity. Thus, what began as an intuitive observation evolved into a structured practice, laying the foundation for what we now know as Technical Analysis: a discipline that thousands of investors use to interpret market behavior and make informed decisions.
Fun Fact
The first work to describe the phenomenon of stock market investing is titled *Confusion of Confusions* (1688) by José de la Vega, set in Amsterdam, the financial hub of Europe at the time. More than a detailed study of the investment methods of the era, this novel seeks to entertain and inform readers about the risks of speculation.
Its author, moreover, employs a narrative style that surpasses even the florid prose of his contemporaries:
“They strive to perpetuate the unrest of those who frequent their dealings, and just as they imprison them in their towers, they cast the locks into the sea so that the hope of ever removing the bolts may never flatter them.”
Conclusions
Some might consider the history of technical analysis a curious but irrelevant tale for modern practice. However, history shows us that markets are more than just numbers—they are a reflection of human psychology. Far from being a mere catalog of tricks to memorize, technical analysis invites us to understand psychological dynamics to make informed decisions.
Recognizing that markets are shaped by historical patterns grants us a strategic advantage. By studying how past investors interpreted prices and emotions—from rice traders in 17th-century Japan to modern analysts—we can anticipate market movements with greater precision. This perspective not only enriches our trading but also positions us as more aware and prepared investors in an environment where collective psychology remains the dominant force.
References
Nison, S. (1994). *Beyond Candlesticks: New Japanese Charting Techniques Revealed*. New York, NY: John Wiley & Sons.
Schabacker, R. W. (1932). *Technical Analysis and Stock Market Profits*. New York, NY: B.C. Forbes Publishing.
Edwards, R. D., & Magee, J. (1948). *Technical Analysis of Stock Trends*. Springfield, MA: John Magee.
Rabassa, Y. (n.d.). *How to Master Japanese Candlesticks?* . YouTube.

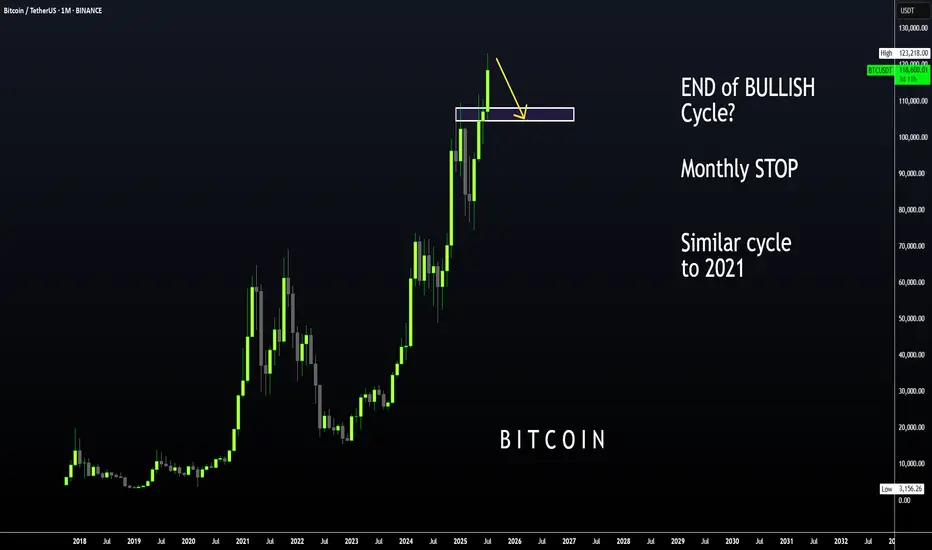
BTC | ALT Season, then BEARISH CYCLE BeginsBitcoin is likely moving in to the beginning of a bearish cycle.
I'm not saying this is immediate, we first need to see altseason - however, if BTC increases it may not go any higher than the last high of $123k. We could easily see the price hover around this zone with a few small increases and decreases for the next few weeks as alts make their respective moves.
I have been talking about the 2021 fractal for a couple of months, where BTC took its time to correct and then made another ATH which was only slightly higher.
We already see a similar pattern playing out in the monthly timeframe if we overlay bars pattern from 2021:
Although Bonce zone 3 may only be in several months, these are the major support zones where BTC could bounce from. Ideal for a swing:
____________________
BINANCE:BTCUSDT
BTC long with stop lossA leg of our strategy says price will return to broken threshold candle price levels. Meaning the corresponding price candle to the volulme bar that broke threshold will have price back within that candles open and close range; at some point in time. Things get kind of shaky below 15minute with my script but nonethe less we will use our stop loss just below the candles open at 114268. yellow line