BTC Forecast For August & September. The Only Roadmap You Need !This is one is so obvious, its a no brainer , and would likely be very easy to trade as long as you follow this road map i have provided.
The Value Area High at 110k price range is most important upcoming battle line between bull vs bear. If bulls fail to get a strong bounce from 110k and we close at least 2 daily candles below it. Then it would mean bears have full control and the implication of that is that since we would at that point be closing back inside an established Value Area range, formed between Nov 20th to Jul 25th, then it would mean the probability of price selling all the way down to re-test the VAL (value area low) at $91.6k would instantly become very very high.
After re-testing $91.6k we'll watch and see what happens.
It'll either hold after grabbing some liquidity below and stay in the Value Area Range until further notice Or we lose it and the sell off continues. Bear market will be in full swing if that happens and you can bet a ton of weak hands will start to exit due to max pain & cascading long liquidations. Fear index will be back in the red at that point as capitulation starts to set in. Alot of new alts and meme coins will be completely obliterated.
Bullish Continuation Scenario
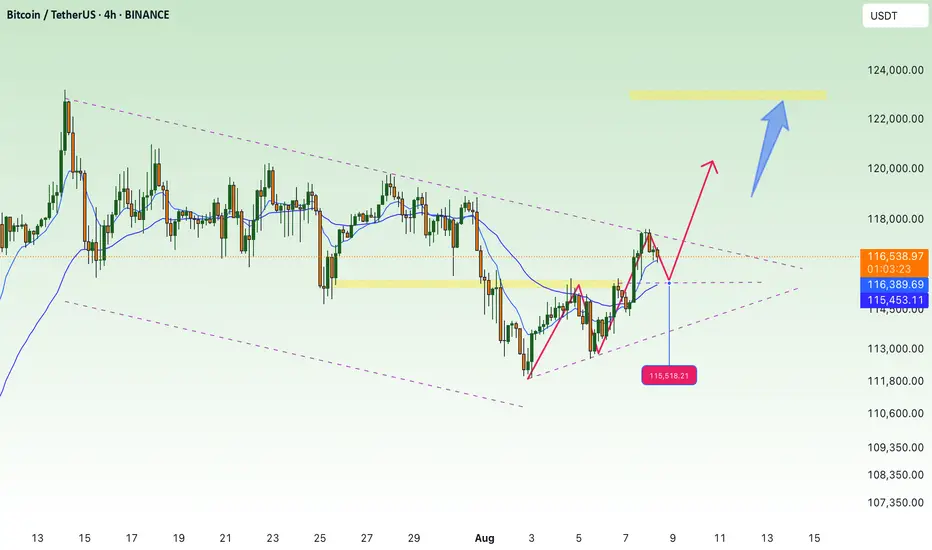
If bulls get a strong bounce from 110k and don't close back inside the Value Area Range below, then we could continue up to a make a new ATH for a classic trend pullback continuation trade. Once we get back above 115.4k, the dream of a new ATH will become much more realistic. There is an UFA(Unfinished Auction) at 120.8k which is only visible to traders using the market profile or footprint chart. This make poor high and needs to be taking out at some point.
For the Price target to the upside, we would be using the peak formation line of the ExoFade indicator.
BTCUST trade ideas

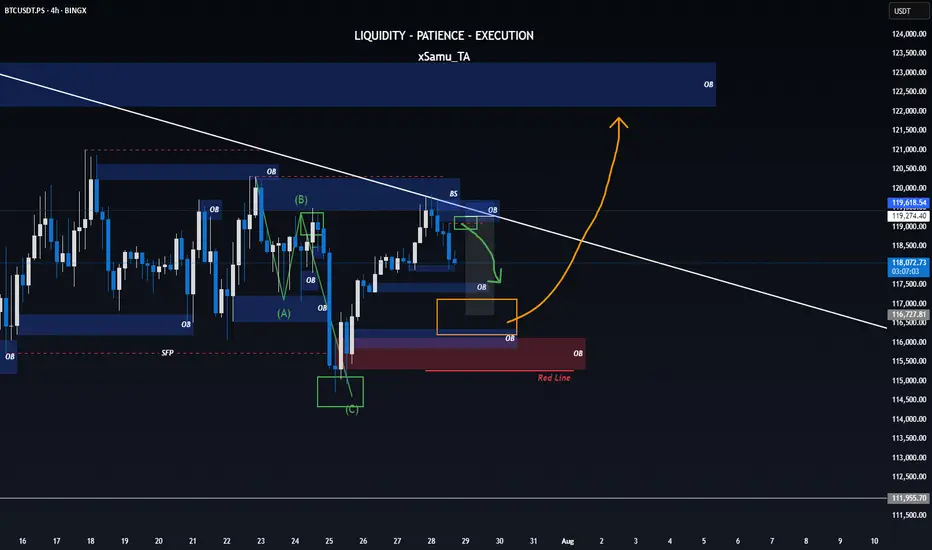
One last Correction till breakoutWith the most recent SFP printed on the higher timeframe and BTC still failing to break a significant high, all signs point toward one final dip – a move to shake weak hands and reload for the breakout that’s been brewing in silence.
⚡ If the orange level holds, consider it a highly bullish signal – supercycle potential unlocked?
Naturally, the Wizard plays both sides of the board:
📉 Short ideas would activate around the blue Order Block / green correction level.
📈 But should we bounce strong from orange… well, let’s just say you’ll want a seat for what comes next.
🟥 Bullish invalidation rests at the red line.
Let’s see how the game unfolds.
WE HAVE PREDICTED EVERY MOVE OF BITCOIN - HERE IS WHAT’S NEXT!! Yello Paradisers! we have predicted every single movement on Bitcoin in the past few months, and in this video, I will reveal to you what's going to happen next with the highest probability. Again, on the high time frame chart, we are seeing the ABC zigzag, and right now, we are trading inside of the C wave. Further in the video, we are zooming into the fourth wave.
On the medium time frame, we are seeing bearish divergence that is showcasing an absorption. We are describing Heron-Chorda's target and taking a look at the channel in which the zigzag is being formed. On the low time frame, we are analyzing the Elliott Wave Theory Triple Three pattern, and on the ultra-low time frame, we are analyzing the impulse.
We are describing what kind of conformations we are waiting for. Basically, it's a five ways to the downside. Then, we will be increasing our portfolio exposure on a corrective mode wave to the upside where we will be able to create a tight risk-to-reward ratio position and a high-probability trade setup. Trade smart, trade with a professional trading strategy, be tactical, and enjoy your weekend.
Remember, don’t trade without confirmations. Wait for them before creating a trade. Be disciplined, patient, and emotionally controlled. Only trade the highest probability setups with the greatest risk to reward ratio. This will ensure that you become a long-term profitable professional trader.
Don't be a gambler. Don't try to get rich quick. Make sure that your trading is professionally based on proper strategies and trade tactics.

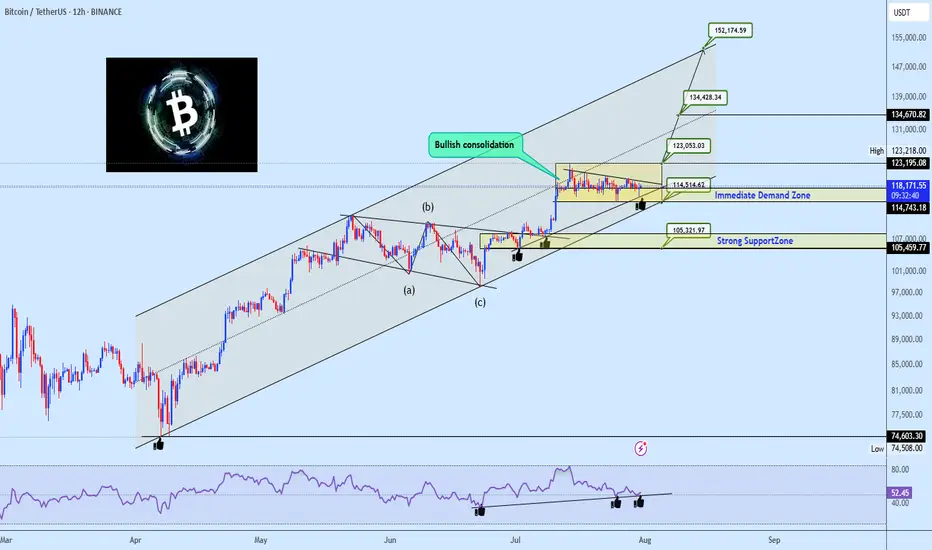
Bullish Channel Intact: BTC Poised for Next Leg Toward 152KBitcoin continues to coil within a bullish consolidation zone above the critical $114.5k–$117.5k Immediate Demand Zone, firmly riding the ascending channel structure that has guided price since the March swing low. The prior wave structure confirms a clean ABC correction, followed by a powerful breakout and a structured range indicative of accumulation, not exhaustion.
The RSI shows persistent bullish divergence, confirming hidden strength, with multiple support bounces confirming demand. The current tight consolidation above former resistance now flipped demand presents a launchpad scenario for a breakout towards major projected upside targets.
Targets to Watch:
🟢 $123,053 – Range breakout threshold, aligns with channel midline and prior local high.
🟢 $134,428 – Measured move from current range and top channel boundary intersection.
🟢 $152,174 – Final leg projection based on macro channel trajectory and bullish wave extension potential.
On the downside, failure to hold $114.5k opens the door to a test of the $105k Strong Support Zone, which aligns with prior structural demand and broader trendline confluence.
💬 Drop your favorite altcoins in the comments for quick analysis , let's catch the next movers before they fly!
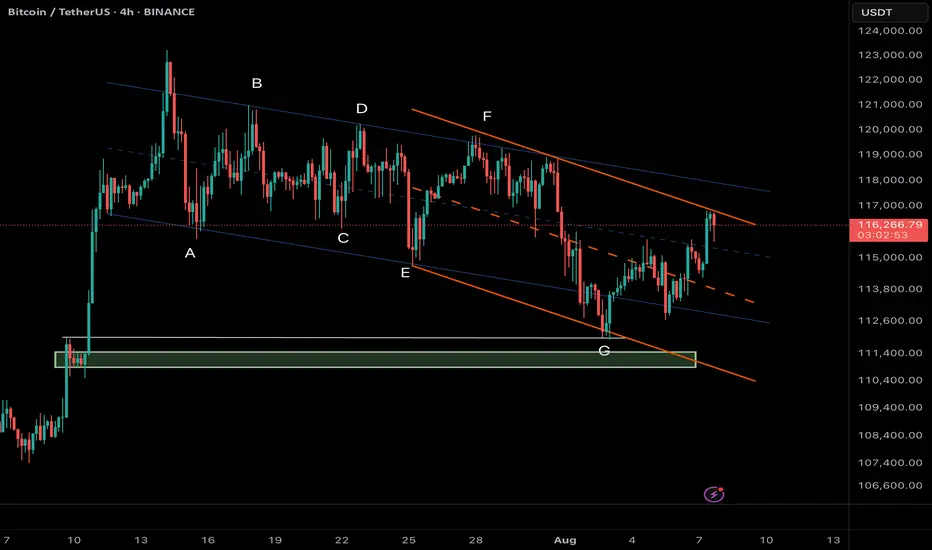
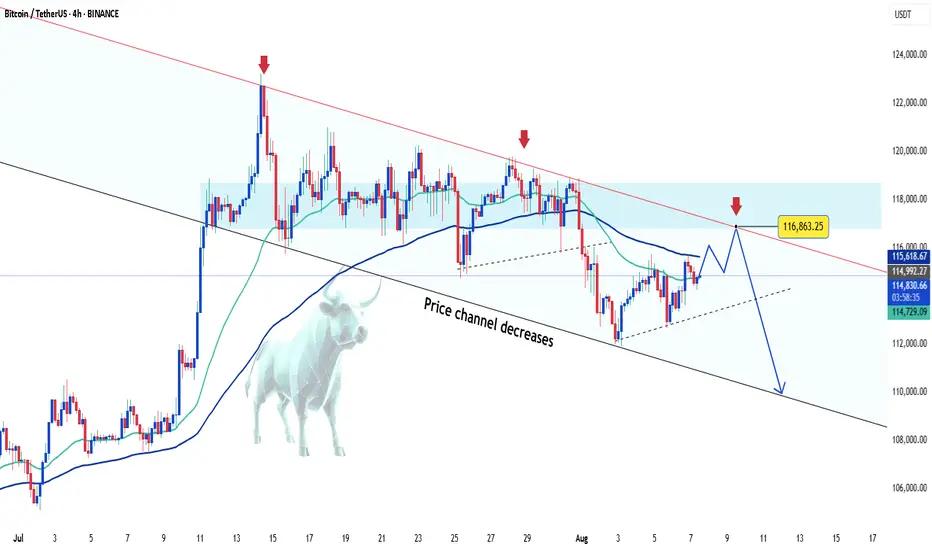
Bitcoin (BTC/USDT) – Bearish Scenario Remains in Focus4H Chart Analysis – Structural + Price Action Insight
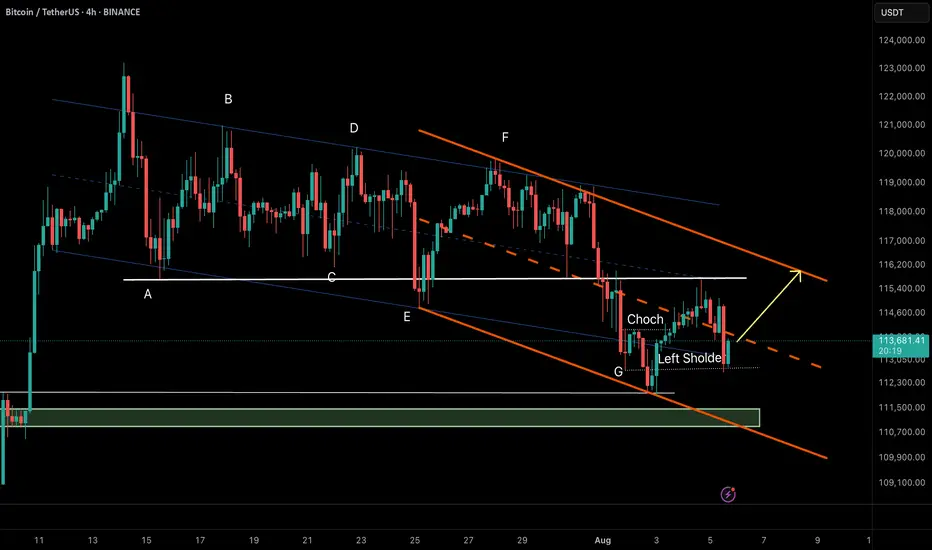
Bitcoin is currently trading inside a descending minor channel (orange), which is part of a larger complex correction pattern, potentially a contracting running flat or diametric in NeoWave context. The sequence A to G may suggest that the market completed its G-leg after bouncing off the lower support.
Now, BTC has reached the upper boundary of the orange channel, which aligns with a strong resistance zone around 116.8K–117K.
⸻
✅ Primary Scenario (Bearish Bias):
As long as BTC fails to break and sustain above 116,800 – 117,000, the current move can be interpreted as a pullback within the correction, with high probability of price heading back toward the green liquidity/support zone near 110,800 – 111,400.
This could be a continuation of the broader corrective structure, or even the beginning of a new downward cycle.
⸻
❗ Alternative Scenario:
If bulls manage to break above 117,000 with strong momentum and confirmation (e.g., breakout + retest), the structure may shift bullish with short-term targets near 118,500 – 120,000.
⸻
🎯 Key Takeaways:
• Watch price action closely at the current resistance zone.
• Bearish confirmation (e.g., bearish engulfing, rejection wicks, or supply absorption signs) is required before considering short entries.
• High R:R setups emerge near channel extremes with clear invalidation levels.
TradeCityPro | Bitcoin Daily Analysis #141👋 Welcome to TradeCity Pro!
Let’s dive into Bitcoin analysis. Yesterday, the exact bearish scenario I told you about happened. Let’s see what opportunities the market is offering us today.
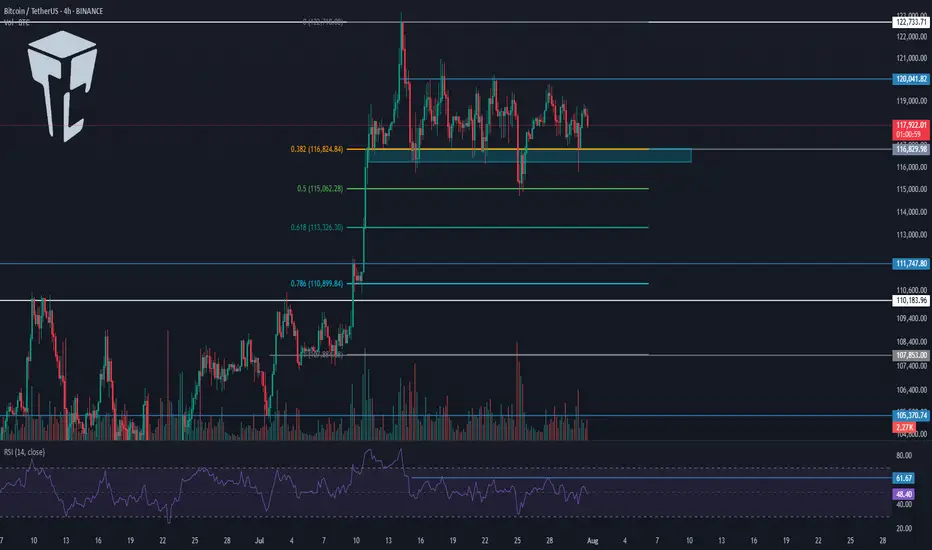
⏳ 4-Hour Timeframe
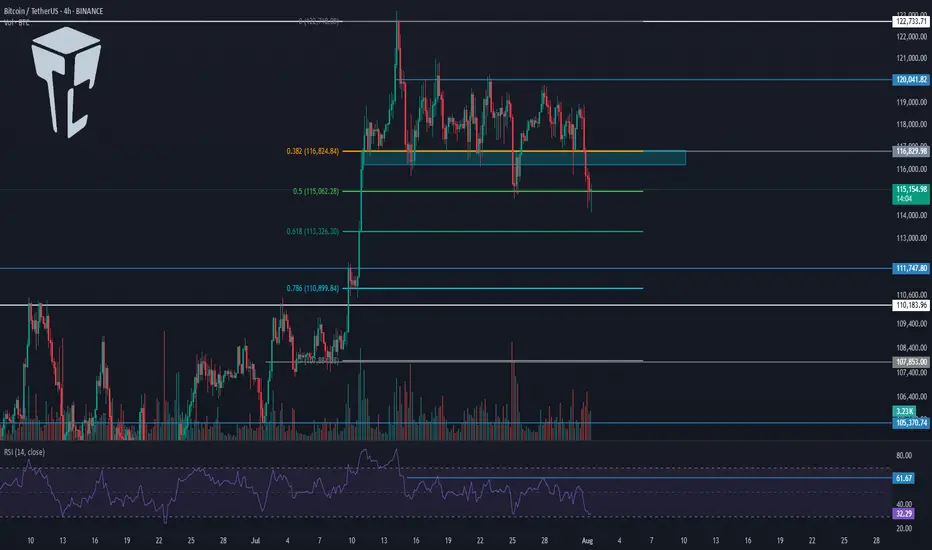
Yesterday, I mentioned that the price had tested the 116829 zone too many times and that this area had become very weak. I also said that if the price made a lower high than 120041, deeper corrections would be likely.
✔️ Another perspective I have on the market is that sometimes certain support and resistance levels simply aren’t strong enough to continue the trend.
🔑 For example, in this case — despite Bitcoin being in an uptrend across all cycles — the 116829 support couldn’t hold, and the price broke it to reach a stronger support zone, one that might be capable of continuing the trend.
📊 Right now, this is what might be happening again. Support levels like 0.5, 0.618, and 0.786 Fibonacci retracement zones could be where the next bullish leg begins.
✅ At the moment, price has reached the 0.5 Fibonacci level, and the previous strong bearish momentum has slightly weakened. If you look at the volume, momentum is still in favor of sellers, but based on the long lower wicks on the candles, we can say the bearish trend is showing signs of weakness.
💥 On the other hand, RSI is approaching 30, and in an uptrend, when RSI nears the Oversold zone, it can often be a good entry point for a long. However, we’re not acting on this yet — we’ll wait for more confirmations before opening any positions.
⭐ For now, there’s no trigger for a long position on this timeframe. A break below 115000 could act as a short trigger, but given the trend Bitcoin is in, I’m not opening any short positions at the moment.
⏳ 1-Hour Timeframe
The price has dropped down to 114560, and I believe today we might enter a corrective phase. However, if the price stabilizes below 114560, the correction could continue. The next targets would be the Fibonacci levels from the 4-hour timeframe.
🔽 I won’t open a short position with the break of 114560, and I suggest you don’t take that short either.
📈 If this move turns out to be a fakeout, the first trigger we have now is at 118736, which is quite far from the current price. For this trigger to activate, we’d need to see a V-pattern form.
🔍 There are no other triggers right now. But if more range structure forms, we might consider opening a risky long on the breakout of the range top.
❌ Disclaimer ❌
Trading futures is highly risky and dangerous. If you're not an expert, these triggers may not be suitable for you. You should first learn risk and capital management. You can also use the educational content from this channel.
Finally, these triggers reflect my personal opinions on price action, and the market may move completely against this analysis. So, do your own research before opening any position.
Bitcoin (BTC/USDT) – RTM Reversal Pattern in Action🔸 Market Structure:
Bitcoin has formed a descending channel after a prolonged correction. Recently, price tapped the channel bottom and printed a CHoCH (Change of Character), indicating a potential reversal.
The price has now retraced to the left shoulder of a potential inverse head & shoulders pattern—an RTM classic structure—which held as support, suggesting bullish continuation.
⸻
🔸 Key Technical Signals:
• ✅ CHoCH confirmed at demand zone near $112,300
• ✅ Retest of the left shoulder validates bullish structure
• ✅ Holding above the internal bullish trendline
• ✅ Price aiming toward upper channel resistance
⸻
🎯 Target:
$116,200 – Top of the descending channel & next key resistance.
❌ Invalidation:
Break and close below $112,800 would invalidate the current RTM setup and open room for deeper correction.
⸻
📌 Summary:
This is a textbook RTM reversal:
CHoCH → Retracement → Left Shoulder Test → Continuation
As long as the structure holds, we remain bullish toward the channel top.
BTC/USD) Bullish trend analysis Read The captionSMC Trading point update
Technical analysis of (BTC/USDT) on the 4-hour timeframe, using Smart Money Concepts and a falling channel breakout approach.
---
Technical Breakdown:
1. Market Structure:
Price has been moving within a descending channel, forming lower highs and lower lows.
BTC just bounced strongly from the Fair Value Gap (FVG) zone, marked in yellow, and the lower boundary of the channel, suggesting a potential trend reversal.
2. Key Levels:
FVG (Demand Zone): Between ~112,000–114,000 — price reacted from this zone with clear bullish momentum.
200 EMA (114,799.70): Price is currently below it, but if it reclaims this level, it will strengthen the bullish setup.
Target Point: ~123,287–123,327 — aligns with the upper boundary of the channel and previous resistance.
3. Projected Price Path:
Step 1: Price is expected to retest the mid-channel resistance and potentially break above.
Step 2: If confirmed, BTC may rally toward the 123k+ target zone, continuing the trend reversal.
4. RSI (14):
RSI is currently at 42.70, moving up from oversold territory (33.05 low), which supports a bullish reversal.
No bearish divergence seen, indicating room for upside.
Mr SMC Trading point
---
Trade Idea Summary:
Bias: Bullish
Entry Confirmation: Strong bounce from FVG and bullish candle close above 114,800 (EMA)
Target Zone:
TP1: 118,000 (channel midline)
TP2: 123,327.97 (channel top / resistance zone)
Invalidation: Close below 112,000 or breakdown of channel and FVG
Indicators: RSI recovery + strong volume bounce supports bullish scenario
plesse support boost this analysis)

Bitcoin Tests Major Support at $112,500Bitcoin is currently in a local downtrend, with price now testing a major support zone around $112,500. This level, backed by multiple technical confluences, may serve as the base for a potential reversal if defended on lower timeframes.
Price action has been drifting lower over the past sessions, finding its way into a key support zone defined by the 0.618 Fibonacci retracement, the blue upward trendline, and prior structure. The $112,500 region now acts as the immediate level to hold from an intraday perspective. If bulls are able to defend this zone and volume confirms participation, the probability of a rotation higher toward $123,000 increases significantly.
Key Technical Points:
- Support at $112,500: Aligned with 0.618 Fibonacci, trendline support, and structural pivot
- Intraday Confirmation Required: Holding this level on lower timeframes improves the
probability of reversal
= $123,000 Target in Sight: Technical target for rotation if a bottoming structure forms and holds
From a short-term perspective, Bitcoin has clearly shifted into a local downtrend, creating a sequence of lower highs and lower lows. However, the current area around $112,500 presents a strong confluence of support that could interrupt this trend. This zone includes the 0.618 Fibonacci retracement from the most recent swing move, a respected upward trendline (blue), and a previous structural pivot. Together, these elements increase the probability of a bounce—provided price can stabilize.
At this stage, price may still trade sideways and consolidate within this region to form a bottoming structure before any meaningful move higher. For traders, this means confirmation is key. Watching for multiple intraday candle closes above the support zone, paired with an increase in bullish volume, would suggest that demand is building. Only then would the setup favor an entry targeting the local highs.
The upside technical target from this area remains at $123,000, representing the recent swing high and a clear resistance level. A reclaim and rotation to this level would validate the support zone and reintroduce the bullish bias in the short term. Until that occurs, however, price could continue to consolidate, especially if volume remains low or indecisive.
The overall structure still leans constructive, as long as $112,500 holds. A breakdown below this level would weaken the short-term setup and potentially open the door to deeper downside probing. But for now, the region remains a high-probability bounce zone on lower timeframes.
What to Expect in the Coming Price Action
Bitcoin is testing critical intraday support at $112,500. If this level holds with volume confirmation and intraday structure aligns, a rotation toward $123,000 is likely. However, price may continue consolidating at this level before a clear direction forms.
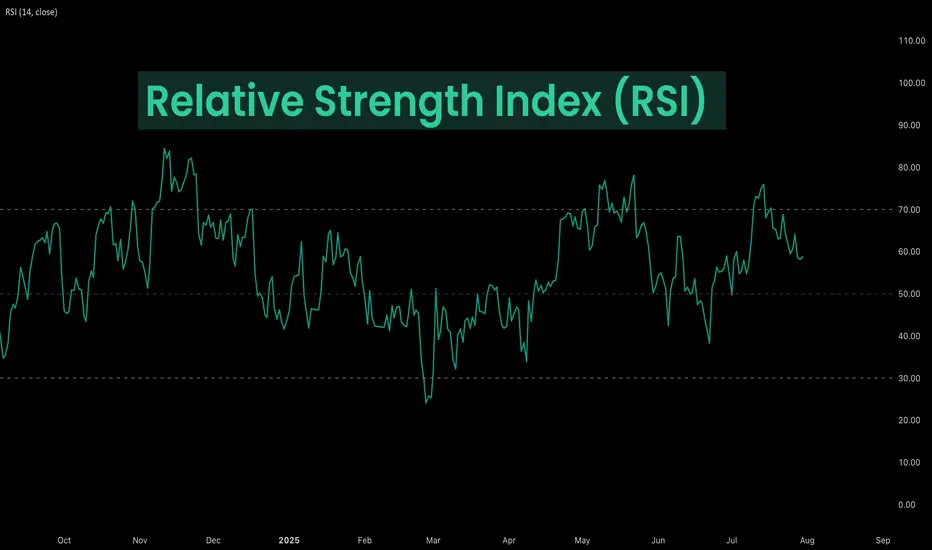
Deep Dive Into Relative Strength Index (RSI)The Relative Strength Index (RSI) is a momentum oscillator developed by J. Welles Wilder Jr. that measures the speed and magnitude of price changes.
Introduction
In the world of trading, timing is everything — and few indicators have stood the test of time like the Relative Strength Index (RSI). Introduced by J. Welles Wilder in 1978, the RSI is a momentum oscillator that helps traders evaluate the strength and speed of price movements. Whether you're trading stocks, forex, or crypto, understanding how RSI is calculated and how to interpret its signals can give you a critical edge.
In this article, we’ll break down exactly how the RSI works, explore its formula, and dive into practical ways you can incorporate it into your trading strategies. From spotting potential reversals to identifying overbought and oversold conditions, the RSI remains a cornerstone of technical analysis — but only if you know how to use it properly.
Let’s explore the mechanics and the mindset behind this powerful indicator.
What Is RSI and How Is It Calculated?
The Relative Strength Index (RSI) is a momentum oscillator that measures the speed and change of price movements over a defined period. It outputs a value between 0 and 100, which helps traders determine whether an asset is overbought or oversold.
The default RSI setting uses a 14-period lookback window and is calculated with the following steps:
🔷Calculate the average gain and loss over the last 14 periods:
Average Gain = Sum of all gains over the past 14 periods / 14
Average Loss = Sum of all losses over the past 14 periods / 14
🔷Compute the Relative Strength (RS):
RS = Average Gain / Average Loss
🔷Apply the RSI formula:
RSI=100−(100/(1+RS))
The result is a single number between 0 and 100 that indicates the asset's momentum.
How to Use RSI in Trading Strategies
⚡️Overbought and Oversold Conditions Strategy
RSI > 70 typically signals that an asset may be overbought and due for a pullback.
RSI < 30 suggests the asset might be oversold, potentially primed for a bounce.
However, these levels aren’t absolute sell or buy signals. In strong trends, RSI can stay overbought or oversold for extended periods.
📈Long Trading Strategy Example:
1. Identify the major trend, to find the long trades it shall be uptrend. On the screen below you can see 1D time frame for BITMART:BTCUSDT.P .
2. Move to lower time frame (in our case 4h) and find the moment when RSI falls below 30. This is our oversold condition and we are going to look for long trade.
3. Find the local support zone and open long trade.
4. Take profit when price reaches resistance level next to the previous swing high
5. Don’t forget to put initial stop loss when enter position. The best stop loss which will give you 3:1 risk to reward ratio.
📉Short Trading Strategy Example
1. Identify the major trend, to find the short trades it shall be downtrend. On the screen below you can see 1D time frame for BITMART:ETHUSDT.P .
2. Move to lower time frame (in our case 4h) and find the moment when RSI grows above 70. This is our overbought condition and we are going to look for short trade.
3. Find the local resistance zone and open short trade.
4. Take profit when price reaches support level next to the previous swing low
5. Don’t forget to put initial stop loss when enter position. The best stop loss which will give you 3:1 risk to reward ratio.
⚡️RSI Breakout Strategy
RSI is breaking through 60 indicating bullish momentum shift if the long-term trend is bullish can be the potential long signal
RSI is breaking down 40 indicating bearish momentum shift if the long-term trend is bearish can be the potential short signal
This strategy works great only on the trending market, don’t use it on the range bounded market to avoid whiplashes.
📈Long trading strategy example:
1. Make sure that long-term trend is bullish. Use 200 period EMA as its approximation. If price remains above it we can look for potential long trade setup.
2. If RSI crossed above the level 60 open long trade.
3. Put the initial stop-loss under the signal candle’s low.
4. Take profit when price reached 3:1 risk-to-reward ratio.
📉Short trading strategy example
1. Make sure that long-term trend is bearish. Use 200 period EMA as it’s approximation. If price remains below it we can look for potential short trade setup.
2. If RSI crossed below the level 40 open short trade.
3. Put the initial stop-loss above the signal candle’s high.
4. Take profit when price reached 3:1 risk-to-reward ratio. In our case we received very fast and profitable trade
⚡️RSI Divergence Strategy
RSI can be used also as a trend reversal indicator if we are looking for divergences. This is very reliable sign of current trend weakness and great opportunity open trade against the trend. Usually it’s not recommended, but in case if divergence can be applicable.
Bullish divergence is the situation when price created the lower low, while RSI made the lower low. Usually, it indicates that current downtrend is weakening and we can look for long trades
Bearish divergence is the situation when price created the higher high, while RSI made the lower high. Usually, it indicates that current uptrend is weakening and we can look for short trades
😎Important hint: it’s rarely covered in textbooks about technical analysis, but in our opinion it’s better to used divergences when RSI was able to cross level 50 between two lows/highs.
📈Long trading strategy example
1. Find at the chart situation, when the price made the lower low
2. At the same time RSI shall set the higher low
3. RSI shall break level 50 between these lows indicating shift to the bullish momentum
4. If price failed to set the clean breakdown open long trade on the candle which set the lower low. Put stop loss under it’s low
5. Take profit at 3:1 RR. When you master this concept, you will be able to have much more RR trades, even 10:1. This is possible because when trend finish you have the highest potential upside
📉Short trading strategy example
1. Find at the chart situation, when the price made the higher high
2. At the same time RSI shall set the lower high
3. RSI shall break level 50 between these highs indicating shift to the bearish momentum
4. If price failed to set the clean breakout open short trade on the candle which set the higher high. Put stop loss above it’s high
5. Take profit at 3:1 RR. When you master this concept, you will be able to have much more RR trades, even 10:1. This is possible because when trend finish you have the highest potential upside
Conclusion
The Relative Strength Index (RSI) remains one of the most powerful and flexible tools in a trader’s technical arsenal — but its real value lies in how you use it.
We’ve explored three key RSI strategies:
✅ Overbought/Oversold setups offer simple entry signals in ranging markets, where price tends to revert to the mean.
✅ Breakout strategies unlock RSI’s momentum-tracking potential, helping you ride strong directional moves with confidence.
✅ Divergence detection reveals hidden shifts in market sentiment, giving you an early warning of possible reversals or trend continuations.
Each approach has its strengths — and its risks — but together, they offer a complete framework for using RSI across different market conditions
🔑 Key Takeaways:
RSI is not just a “buy low, sell high” tool — it’s a multi-dimensional indicator that adapts to trends, momentum, and market structure.
The best RSI signals come from confluence: combining RSI with price action, support/resistance, volume, or trend filters like moving averages.
Patience and discipline are essential — RSI signals are only effective when paired with proper risk management and confirmation.
By mastering RSI beyond the basics, you'll be better equipped to make timely, confident, and informed trading decisions — whether you're entering a pullback, chasing a breakout, or spotting the early signs of reversal.
NeoWave Alert: BTC G-Wave Sets Up a Brutal Drop After $116K PumpAs anticipated in our previous NeoWave analysis, the market appears to be deep within Wave G of a Contracting Diametric structure (A–G), originating from the March 2025 high.
⸻
🔻 Key Developments:
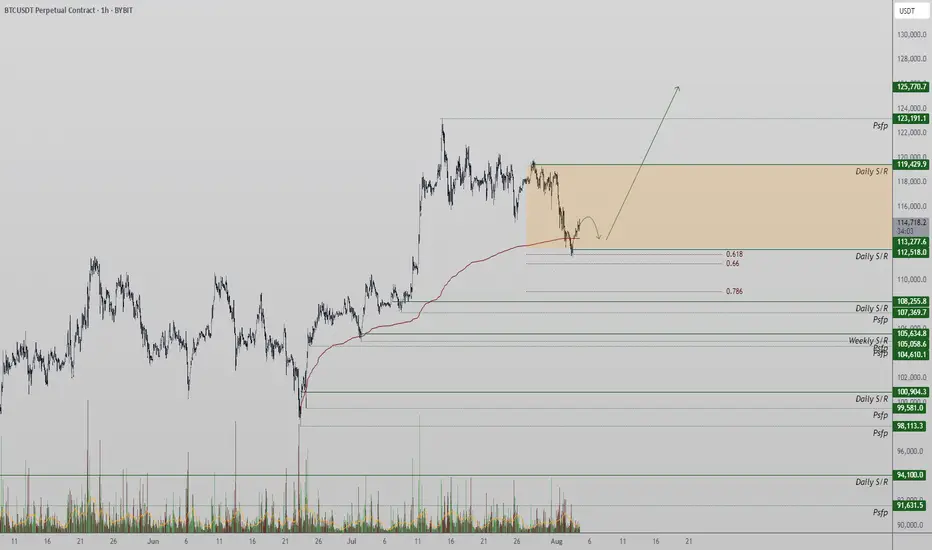
• After rejecting from $119,000–119,500 (Wave F resistance), price dipped to $112,000, breaking below the previous channel’s lower bound, and now appears to be forming a steeper descending channel.
• This new channel’s resistance has shifted lower to $116,000, becoming a potential bull trap zone.
• The bounce from $112K is likely a liquidity sweep, preparing for one final upside to $116K, followed by aggressive distribution.
⸻
💡 Trading Thesis:
We’re likely seeing a trap-style rally within Wave G, aiming to:
• Attract liquidity up to $116K
• Induce late longs before initiating a more violent selloff toward $105K or lower
⸻
🔍 Smart Money Confluence (SMC / ICT)
• 🟥 Confirmed bearish structure on 1H (Lower Highs + BOS)
• 🟨 Liquidity above $120K already swept during Wave F
• 📉 Order blocks around 119.5K rejected
• 🔻 Price currently trades above $114K, but trapped inside a sharper descending range
• 🧲 Unfilled FVGs between $113K–$110K may serve as magnets
⸻
🧠 Wave G Structure (Diametric)
• Possibly unfolding as a Zigzag or Complex Combination
• Channel boundary now capped at $116K
• Wave G likely targets a breakdown below Wave E ($113K) and toward $105K
⸻
📌 Primary Scenario:
• Final push to $116K → strong rejection expected
• Bearish continuation targeting $110K → $105K
🧯 Invalidations:
• Clean breakout & daily close above $120.5K invalidates this diametric structure
• Watch for triangle or flat morphing if structure shifts
⸻
⚠️ Risk Management:
• $116K = key distribution zone
• Watch closely for rejection and breakdown confirmation
• Shorts valid below $114K with tight invalidation above $117K
⸻
📌 Conclusion:
Bitcoin is nearing the climax of a multi-month complex correction. The current setup favors a liquidity trap toward $116K, followed by continuation of Wave G toward major demand zones. Smart money bias remains bearish below $117K.
⸻
💬 Drop your alternate wave counts or SMC confirmations in the comments!

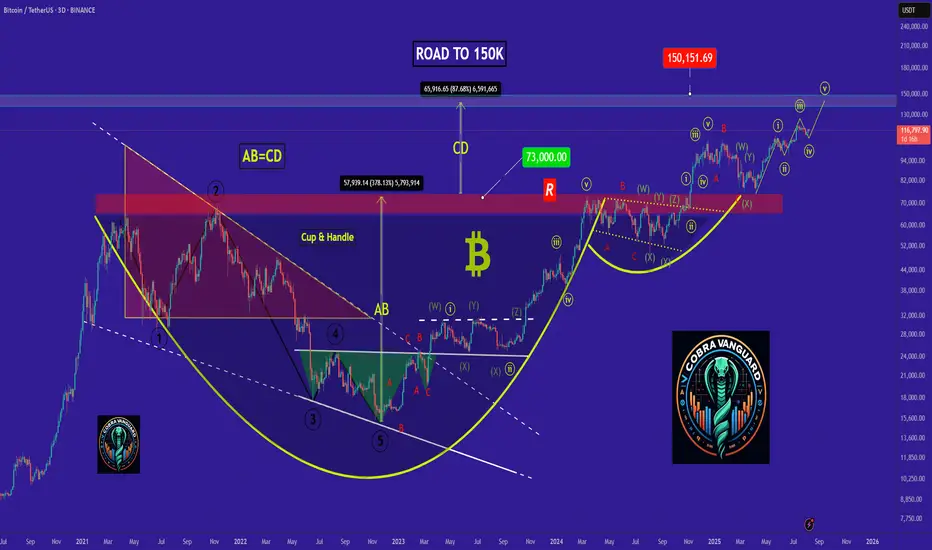
bitcoin - Time to buy again!The price seems to have completed the fourth corrective wave, and from now on, it's time for a price increase, which will continue up to around $150k .
previous analysis
BTCUSD long setup: Targeting the next bull move.Hello IGT FOLLOWERS
Here is my BTCUSD overview, Bitcoin is showing bullish momentum after holding strong support near $112,000. A breakout above the $115000 resistance suggests buyers are regaining control. RSI is turning upward, and volume is increasing on green candles signaling demand. As long as price holds above $113,000, bulls may push toward the $117,500 target.
Key points :
Entry point : 113500
1st Target : 115000
2nd Target : 117500
Follow me for more latest updates and signals

Bitcoin Faces Pressure Below $114,000 – What’s Next?Hey crypto community, BINANCE:BTCUSDT continues to face pressure as the price slips below $114,000 during Thursday’s trading session. Although there was an attempt to break through the $116,000 resistance, buying power remains weak, mainly due to diminishing demand from institutional players.
A clear indication of this trend is seen in the ongoing outflows from US-listed Bitcoin ETFs – on Tuesday alone, $196 million was withdrawn, extending the losing streak to four consecutive days.
However, there’s a glimmer of hope from Asia: SBI Holdings in Japan has recently filed for approval of a dual-asset ETF that includes both BTC and XRP. This could be a sign of a fresh wave coming from the East.
On the chart, if BTC fails to reclaim the $114k – $116k range soon, further downside potential remains. But keep in mind, deep corrections often provide an opportunity for large players to accumulate.
👉 What do you think about this correction? Will BTC hold its ground against selling pressure? Let me know your thoughts!
Okay, Let's Take a Live Look Into the Market 📺⚡ Okay, Let's Take a Live Look Into the Market 💹🔥
Important levels across S&P 500, Bitcoin, and XRP are all flashing 🔴 right now. Here's what I'm seeing in real-time:
📈 S&P 500 Futures – 6,351 Is Everything
The 6,351 level marks the midpoint of the rising channel.
On Friday, I flagged 6,430 as critical resistance — price rejected perfectly.
Now we’re attempting a rebound, but we’re stuck at mid-channel.
⚠️ A confirmed breakout above 6,351 could reignite upside momentum.
👉 Yes, this is a 1-minute chart, but precision matters when watching key structural levels — especially in legacy indices.
💥 BTC – 115,700: The Grandmaster Level
Zoom out and see the massive yellow horizontal on the chart: 115,700.
It’s not just any number — this is the ultimate resistance-turned-support battleground.
We’re currently under it, which keeps pressure to the downside.
A reclaim flips the structure bullish and opens room for trend continuation.
📌 Until we’re above it, this remains the dominant resistance across the entire crypto macro framework.
🧩 XRP – Still Facing Rejection
On the 2H/3H chart, XRP continues to flirt with resistance but fails to confirm strength.
This aligns with both the S&P 500 stalling at 6,351 and Bitcoin being capped at 115.7K.
📉 When multiple assets respect key levels in sync, it signals market-wide hesitation.
🔄 Cross-Market Confluence
It’s fascinating to watch:
A TradFi index (S&P)
A macro crypto asset (BTC)
A mid-tier alt (XRP)
...all pivoting around hyper-precise structural resistance at the same time.
✅ These aren’t coincidences. They’re systemic correlations.
🔮 What’s Next?
If S&P 500 breaks above 6,351, it could act as a risk-on signal.
That momentum could help BTC flip 115,700 — a massive deal.
And if that happens, XRP could finally follow with a stronger move.
Until then? We respect resistance and wait for confirmation. 📊🔍
One Love,
The FXPROFESSOR 💙
Disclosure: I am happy to be part of the Trade Nation's Influencer program and receive a monthly fee for using their TradingView charts in my analysis. Awesome broker, where the trader really comes first! 🌟🤝📈

TradeCityPro | Bitcoin Daily Analysis #140👋 Welcome to TradeCity Pro!
Let’s dive into the Bitcoin analysis. Yesterday, the interest rate decision by the US Federal Reserve was announced, and once again, just like the past few months, it remained unchanged. Let’s see what impact it had on Bitcoin.
⏳ 4-Hour Timeframe
In the 4-hour timeframe, after the announcement of the unchanged interest rate and Powell’s speech, Bitcoin printed a red candle on the support zone and even wicked lower, but then recovered and the price returned back into the box.
✔️ Basically, we can say that this month’s rate decision had no real impact on the market, and Bitcoin is still moving inside its range box. The fact that the support zone wasn’t lost is a positive sign for the continuation of the trend.
⭐ But the important point is this: if the uptrend is going to continue, the price must print a higher high or at least a level equal to 120041, and in my opinion, if for any reason a lower high gets printed, the chances of breaking below 116829 significantly increase.
📊 I currently have no new position on Bitcoin, and all my entries are below 110000. But if 120041 breaks, I’ll open a long position for the next bullish wave that Bitcoin might start.
💥 A major trigger for starting a new leg is the 61.67 level on the RSI. As long as RSI remains below this level, there’s no bullish momentum in the market — and considering that the number of touches to 116829 has increased, the probability of a correction is also rising.
❌ Disclaimer ❌
Trading futures is highly risky and dangerous. If you're not an expert, these triggers may not be suitable for you. You should first learn risk and capital management. You can also use the educational content from this channel.
Finally, these triggers reflect my personal opinions on price action, and the market may move completely against this analysis. So, do your own research before opening any position.
Bitcoin Analysis – August 8, 2025After consolidating between $120K and $116K for two weeks,
last week Bitcoin broke below this range with a strong bearish candle. 📉
Part of the leftover liquidity has been swept, but the candle formations at the top indicate profit-taking by buyers and increasing selling pressure at higher levels.
On the retracement toward the $118K zone, sellers still showed dominance.
As we mentioned in previous analyses, Bitcoin wouldn’t truly enter a corrective phase unless it reached the $108K–$104K zone.
However, with the current market structure, a new wave of sellers is joining in, and we’re already seeing its impact on altcoins.
While we may not have full confirmation yet for a sustained downtrend,
the market signals suggest Bitcoin has entered a corrective phase.
Bitcoin Ready for Takeoff - $150K Target Ahead! MARKETSCOM:BITCOIN is showing impressive strength after successfully retesting its May high and bouncing back with conviction. This level, along with the 50 EMA, is currently acting as a strong support zone. Holding above this area signals that buyers are in control, and this zone now serves as a major support for the ongoing bullish trend.
At the moment, CRYPTOCAP:BTC is facing minor resistance in the $115K–$116K range. A decisive breakout above this level is likely to trigger strong momentum, opening the doors for a new all-time high. Once this resistance is cleared, our previous projection of $150K comes into play as the next major target.
For now, it’s crucial for MARKETSCOM:BITCOIN to hold the current support zone to maintain the bullish structure. As always, traders should manage risk effectively and place stop-losses to protect their capital in case of unexpected volatility.
Follow Our Tradingview Account for More Technical Analysis Updates, | Like, Share and Comment Your thoughts

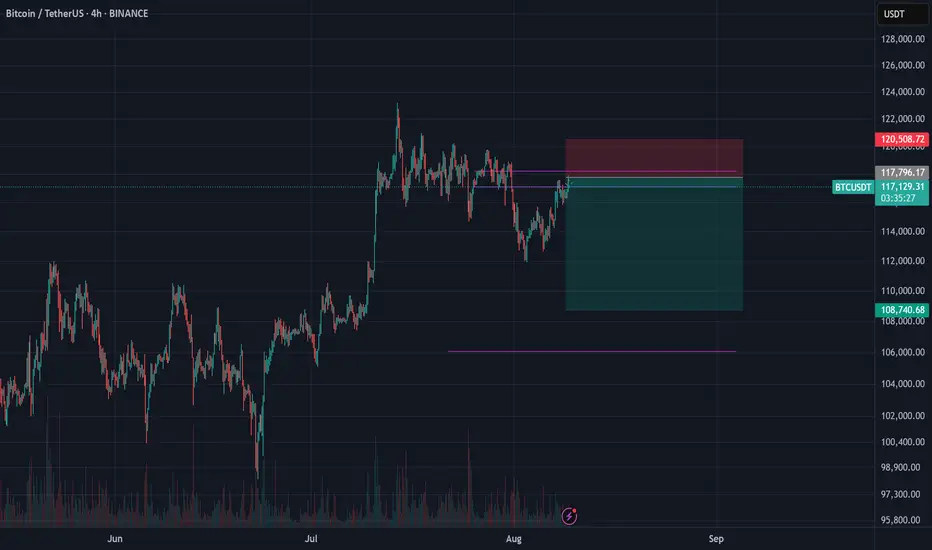
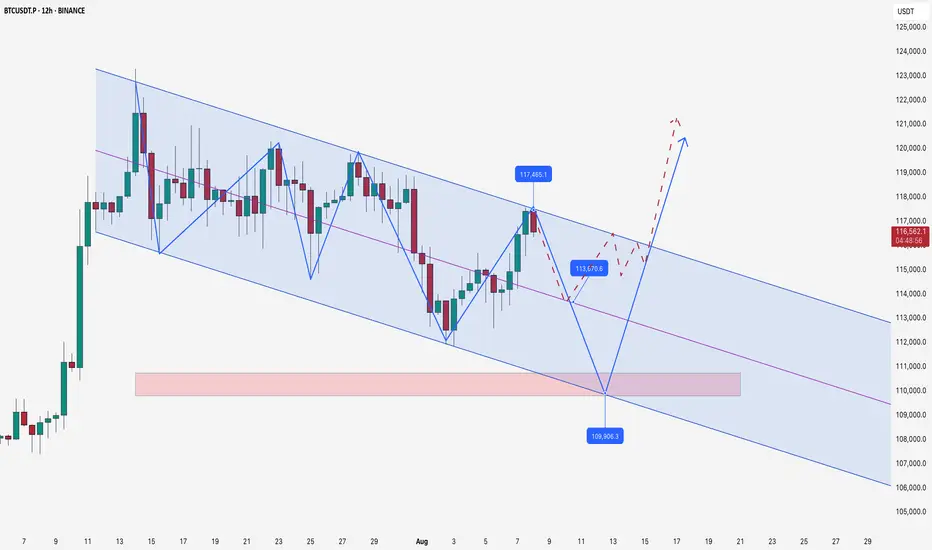
BTC recovers, trying to get back to 120k💎 WEEKEND BTC PLAN UPDATE (08/08)
🔍 BTC Analysis (H4 timeframe):
1. Elliott Wave Structure:
• BTC is following an impulsive wave sequence 1–2–3–4–5.
• Currently in wave (4) and may bounce to complete wave (5) around the ~119,000–120,000 zone.
2. Key Support Levels:
• 116,000–116,200: Support area for wave (4) – can look for buying opportunities here if confirmation signals appear.
• Below that, strong support lies around 115,200–115,600 (confluence of 0.5–0.618 Fibonacci retracement + MA200).
3. Resistance Levels:
• Previous high around 117,500 (Fibo 1.0) is the nearest resistance.
• Wave (5) target: 119,400–120,000 (Fibo 1.618).
4. Trading Plan:
• Buy at 116,000–116,200, SL below 115,600.
• Expected TP: 117,500 – 119,400.”
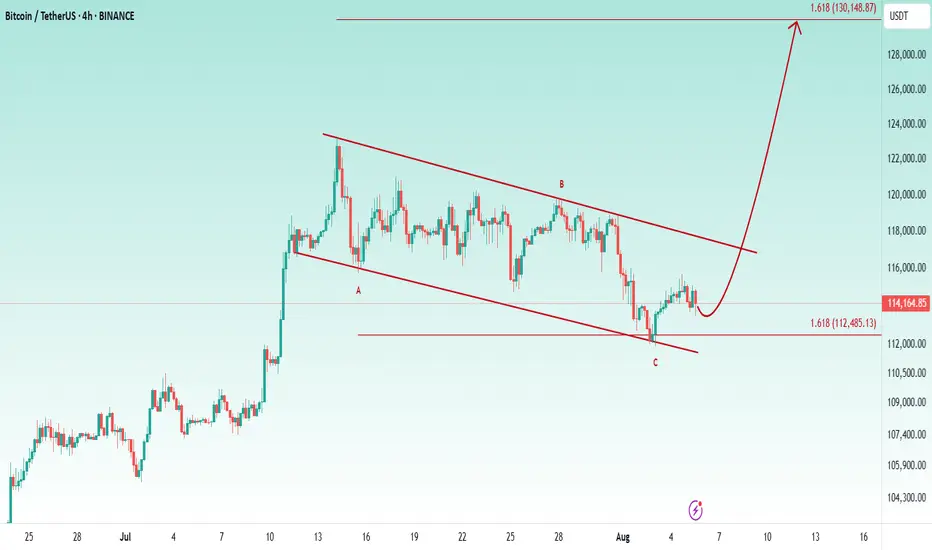
New Bullish Rally About To Start Toward The 130k🔥 Well, the previous update played out perfectly — the price dropped to the $12K support area and bounced back strongly. Now, let’s talk about my next plan for Bitcoin
📥 At the moment, there’s a clear bullish flag forming on the chart. Price has bounced from the 1.618% PRZ (Potential Reversal Zone), which I’ve labeled as wave C of the larger corrective ABC structure.
📈 From here, I’m expecting a new bullish rally, with the next major target around $130K.
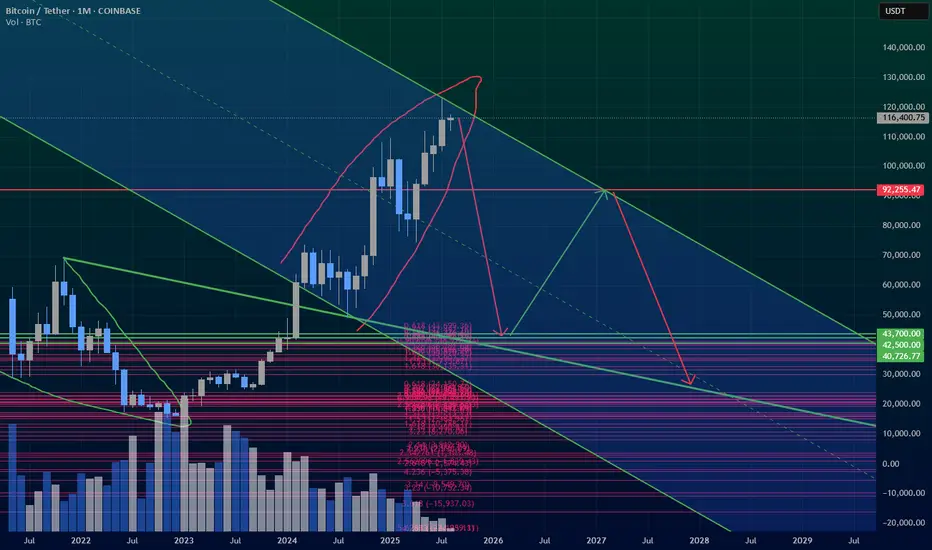
16 Year Cycle looks completeYou can refer to my chart linked below (about the "Summer Rally"), which did indeed happen.
I was skeptical the Summer Rally would actually happen, as it was a bit predictable, but there we go.
Distribution is also being seen on lower time frames.
BTC levels for August 2025Simple channel on BINANCE:BTCUSDT.P
retest of equilibrium with main liquidations of 20x - 40x leverages around 113600
this weekend or if we will see some bad macro news drop by end of 12-15 august
109900
keep charts simple
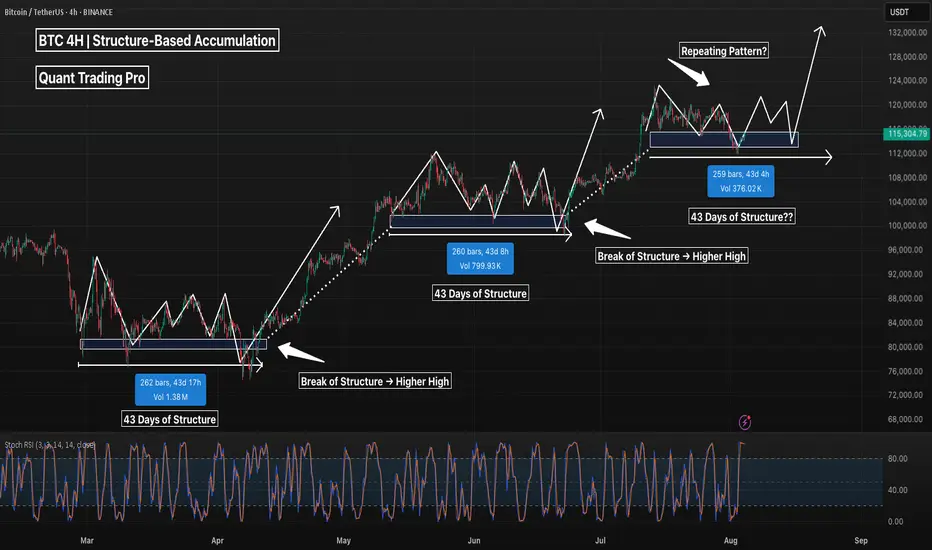
BTC 4H – Repeating Accumulation Pattern, But Will It Hold Again?Bitcoin has shown a clear structural tendency to consolidate for ~43 days at key demand zones before breaking to new highs. This 4H chart highlights three nearly identical accumulation phases, each lasting around 260 bars with a clear base, fakeout, and bullish continuation.
We’re now sitting in the fourth demand zone, with price revisiting the same volume pocket and reclaiming key structure. If history repeats, we may be looking at another breakout leg above $124K+.
Key observations:
– Each consolidation zone lasted ~43 days
– Volume decreases into the base → demand absorption
– Reclaim of structure precedes each leg up
– Current consolidation mirrors previous 3 (in time, shape, and volume)
⚠️ A clean break below ~$112K would invalidate the pattern and suggest deeper retracement.
Are we seeing another accumulation leg… or distribution in disguise?
Drop your thoughts below.
#Bitcoin #BTCUSDT #Crypto #TradingView #PriceAction #MarketStructure #BTC4H #CryptoAnalysis #Accumulation #Wyckoff #SwingTrading #PatternRecognition #TechnicalAnalysis