Bitcoin: Expected Cool-Off or Cause for Concern?After rallying more than 25% off the June lows, Bitcoin is finally taking a breather with a much-anticipated pullback. But as expected, the fear meter is spiking, especially across CT.
Was this cool-off really a surprise? Not quite.
The signs were there: price stalling at upper extremes, responsive sellers stepping in at perceived overextensions, and inefficient zones left behind during sharp impulsive moves.
Of course, reading it in real-time is easier said than done. Emotions always complicate execution , but that’s a separate conversation.
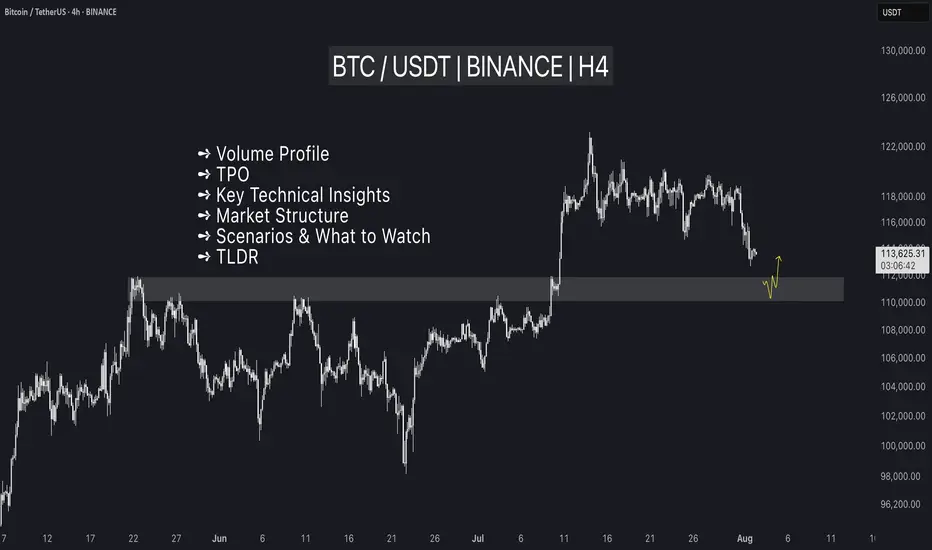
In this post, let’s break down the current structure in detail —using volume profile, TPO charts, and market structure analysis, to give you a clearer picture of what’s unfolding. We’ll also explore a few scenarios worth watching as the next move shapes up.
Let’s dive in!
Table of Contents
➺ Volume Profile
➺ TPO
➺ Key Technical Insights
➺ Market Structure
➺ Trade Scenarios and What to Watch
➺ TLDR
⦿ Volume Profile
Currently, we’re seeing two key zones of balance : one broad range that held for over 60 days and a tighter 21-day structure that formed at higher levels. These are classic areas of value where buyers and sellers found temporary agreement, establishing balance.
The sharp move from ~111,000 to ~122,000 was largely impulsive , with little volume built along the way, suggesting initiative buying in early July. As is often the case with such thin zones, they tend to get revisited once momentum fades. That’s exactly what we’re seeing now.
As price dips into this low-volume pocket, the key question is:
Will the market accept this zone and begin building value here, or will it reject and bounce back toward higher ground?
Looking at the Volume Range Visible Profile (VRVP) since June 7th, the nearby Value Area High (VAH) sits around ~111,000 . If current support doesn’t hold, this becomes the next major volume magnet. That said, there’s also a low-volume node (LVN) just above 111,000 , which could act as a demand pocket and trigger a responsive bounce.
In simple terms:
– Acceptance into the LVN could lead to new range formation at lower levels
– A sharp bounce off ~110,000 might reestablish the prior higher balance, or create a fresh range between the two existing areas
The next few sessions will reveal whether the market is hunting for new value or just shaking out weak hands.
⦿ TPO
Zooming into the 4H TPO chart, we can clearly see the evolving monthly profiles from May through August. And as is often the case, the market found resistance right where you’d expect: at the extremes.
The upper end of July’s profile became a battleground. Buyers attempted multiple pushes above that upper balance, but each effort was consistently faded by responsive sellers , signaling growing exhaustion at the top.
Eventually, that pressure gave way to an impulsive breakdown, driven by initiative selling. Notably, price didn’t rotate gently back into the previous range, but it sliced straight into a thin zone of prior low participation.
Now, the market is sitting at the low-volume region , and the next key battle is shaping up. Additionally, The 108,000 to 110,000 area carries weight as it served as the Value Area High (VAH) for both the May and June profiles. If buyers are going to respond, this is one of the more likely places for them to step in.
⦿ Key Technical Insights
▸ Failed Acceptance Above 21-Day Balance
Repeated attempts to hold above the short-term balance were rejected, signaling buyer fatigue and a lack of conviction at higher levels.
▸ Initiative Sellers Took Control
Once demand dried up, sellers stepped in aggressively. The thin participation during the recent rally left little structural support, allowing price to drop quickly.
▸ No Value Built Below Yet
The zone currently being tested saw minimal trading earlier. If bulls want to reclaim control, they’ll need to build value here and establish a new base.
▸ Prior Balance High as Potential Support
Price is now retesting the top of the 60+ day balance area from above, a classic setup where previous resistance can become support. This area also aligns with a known demand shelf.
▸ Deviation Below the 200 MA Cloud
Price has slipped below the 200 MA cloud and is nearing a key flip zone. A test of the 110,000 level next week wouldn’t be surprising. That area could serve as a strong support zone where a new accumulation phase begins.
⦿ Market Structure
The broader market structure points to a transition in progress. After spending over two months in balance , price broke out to the upside —only to form another short-lived range at higher levels. That, too, gave way to a swift breakdown.
This kind of “failed acceptance at higher prices” is often an early signal that the market may revisit prior zones of interest, typically areas where value was last built.
All eyes now shift to the 110,000–111,000 zone , the high of the previous 60-day balance.
We’re in a classic test-retest phase, where the market is probing for conviction . These moments often set the stage for the next significant move, either continued distribution lower, or the beginning of a re-accumulation phase.
⦿ Scenarios & What to Watch
As Bitcoin pulls back into key structural zones, several scenarios are in play. Here's what to monitor in the coming sessions:
Scenario 1: Re-Acceptance into 21-Day Balance
▸ If price reclaims and holds above ~116K, we could see a rotation back toward the upper end of the short-term balance near ~120K.
▸ This would suggest the recent breakdown was a failed auction or bear trap, not the start of a broader trend reversal.
▸ Watch for initiative buying above the demand shelf with follow-through volume.
Scenario 2: Choppy Mid-Balance Activity
▸ Price remains range-bound between ~110K and ~116K, forming a new short-term balance zone.
▸ Expect slower movement and back-and-forth behavior as the market decides its next direction.
▸ Patience is key here. Watch volume and initiative behavior to gauge strength.
Scenario 3: Rejection and Continuation Lower
▸ If price fails to hold above ~110K, there’s potential for a move down to the POC near ~104K, or even deeper toward ~100K (Value Area Low).
▸ These are low-volume zones, which rarely offer strong support unless new value is built.
▸ This would signal a continuation of the current imbalance and potentially mark a structural trend shift.
I’m primarily focused on Scenario 1 and 2 , as we appear to be in a late bull phase. A deeper pullback toward 100K increases the risk of a broader trend change, making it less attractive from a risk/reward standpoint.
⦿ TLDR
▸ Buyers failed to hold the top of the 21-day balance. Clear signs of exhaustion.
▸ Price dropped into a prior low-volume zone, which now acts as potential demand.
▸ This area has never been accepted before - either buyers step in, or we go lower.
▸ Reclaiming ~116K could fuel a move back toward 120K+.
▸ Failure to hold ~110K opens the door to 104K, maybe even 100K.
What happens next week will likely set the tone for the next major move. Watch how the market responds to acceptance vs rejection zones, and let price action confirm your bias before you act.
If you found this analysis helpful, share it with someone who trades Bitcoin. 🥰
What’s your read on the current structure? Let me know in the comments! 📉
⚠️ Disclaimer
As always, this post is purely for educational purposes. I am not a financial advisor, and nothing here should be taken as financial advice. Always consult your financial advisor before making any investment or trading decisions. Or at the very least, consult your cat. 🐱
BTCUST trade ideas
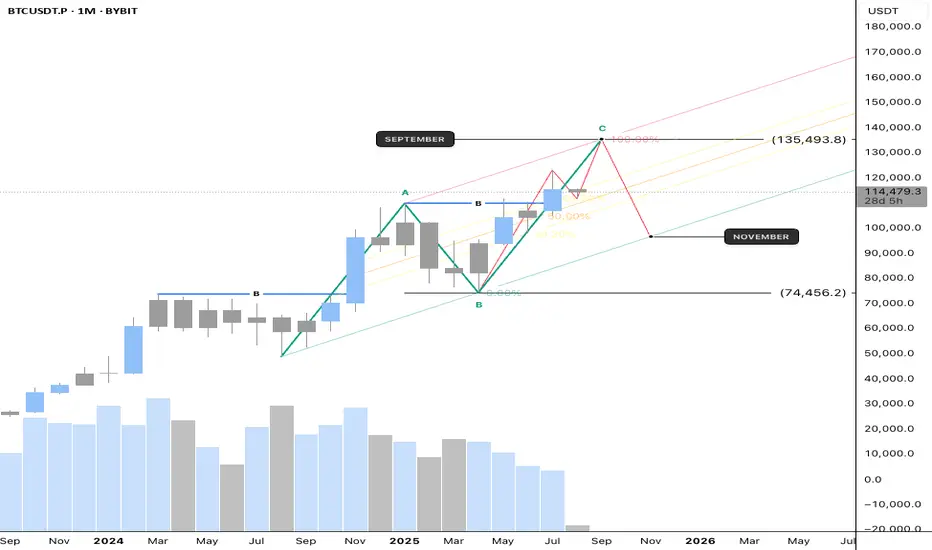
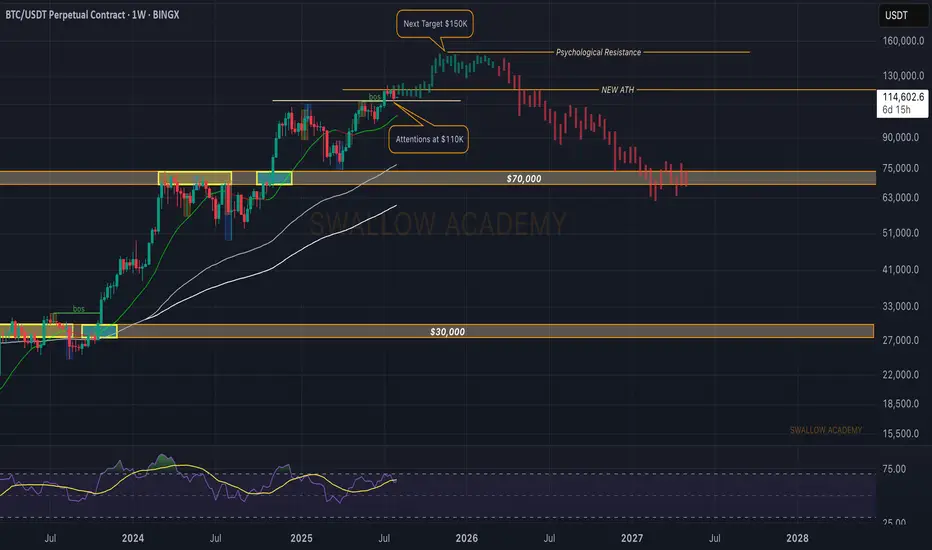
Market StructureIf we look at the underlying market structure, Bitcoin's structure isn't fully formed yet. There are still unsolved puzzles around 135,000. I believe Bitcoin will finalize its final structure around 135,000, which will be its expansionary structure.
The final candle on this weekly timeframe will determine Bitcoin's direction. This August, Bitcoin will either continue its bullish structure or continue its minor retracement.
Disclamer: Any information provided is for educational and informational purposes only and does not constitute investment advice.
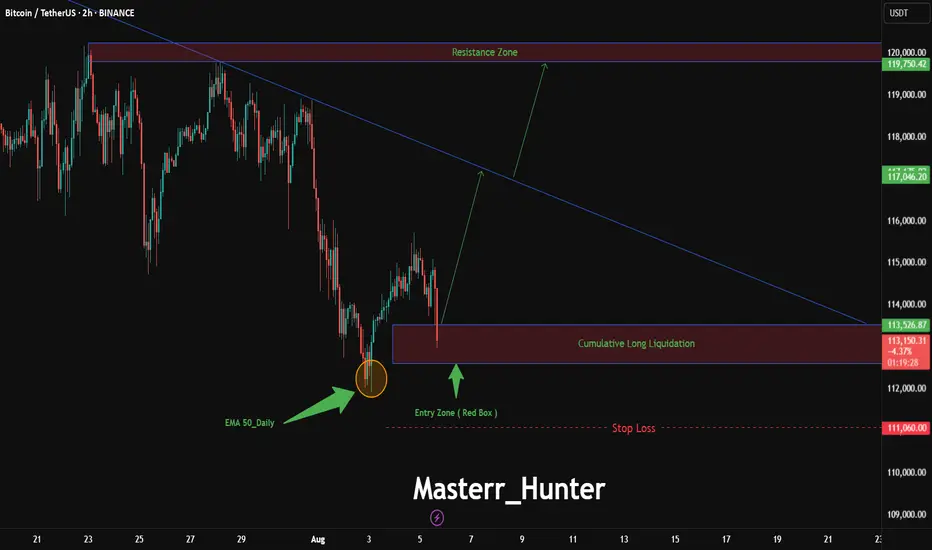
BTC/USDT: Bitcoin Blast to New Heights?BINANCE:BTCUSDT is gearing up for a breakout on the 2-hour chart, with an entry zone between 113,520-112,590 near the 50-day EMA support. First target at 117,190 , with a second target at 119,750 aligning with key resistance. Set a stop loss at 111,060 below the recent low to manage risk. A break above 114,000 with volume could ignite this rally. Watch BTC sentiment and market liquidity shifts. Ride the wave!
Do you see this BTC breakout coming? Drop your thoughts!
#BTCUSDT #BitcoinTrading #CryptoSignals #TechnicalAnalysis #TradingView #DayTrading #MarketAnalysis
BTC - Bulls vs Bears: who will win?Market Context
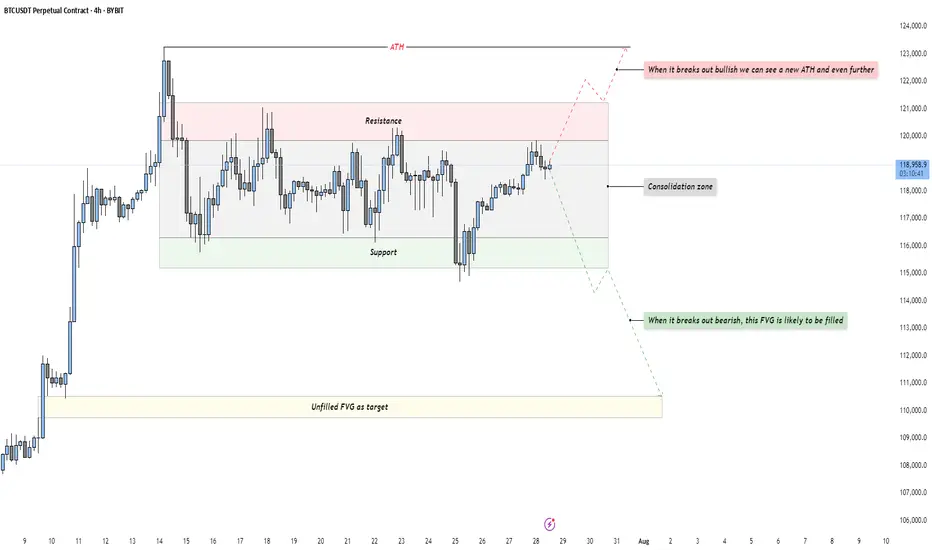
Bitcoin is trading in a tight consolidation just below its all-time high after a strong impulsive rally. This phase represents a balance of power between buyers and sellers, with neither side able to take control yet. Such a pause in momentum at this key level often builds pressure for a breakout move as liquidity pools accumulate above and below the range.
Consolidation Phase
The current range is clearly defined by a resistance area at the top and a support area at the bottom. Price has been oscillating within these boundaries without any sustained breakout attempts. This range-bound behavior is an essential part of the market cycle, as it allows larger players to build or distribute positions. The longer price stays in this box, the more significant the breakout that follows tends to be.
Bullish Breakout Scenario
If price breaks out decisively above resistance, it would indicate buyers have absorbed all the supply at these levels. Such a breakout opens the path to a new all-time high and could potentially extend far beyond as trapped shorts are forced to cover. For traders, a retest of the breakout level on lower timeframes could provide a low-risk entry point for continuation to the upside.
Bearish Breakout Scenario
On the flip side, if support fails, the market will likely gravitate toward the unfilled Fair Value Gap left behind during the previous rally. This inefficiency becomes a natural draw for price, offering a logical downside target for a corrective move. A clean break below the range followed by a retest from underneath could present shorting opportunities for those aiming to capture that move into the FVG.
Final Words
Patience and precision are key when dealing with setups like this. Let the market come to your level — and react with intent.
If you found this breakdown helpful, a like is much appreciated! Let me know in the comments what you think or if you’re watching the same zones.
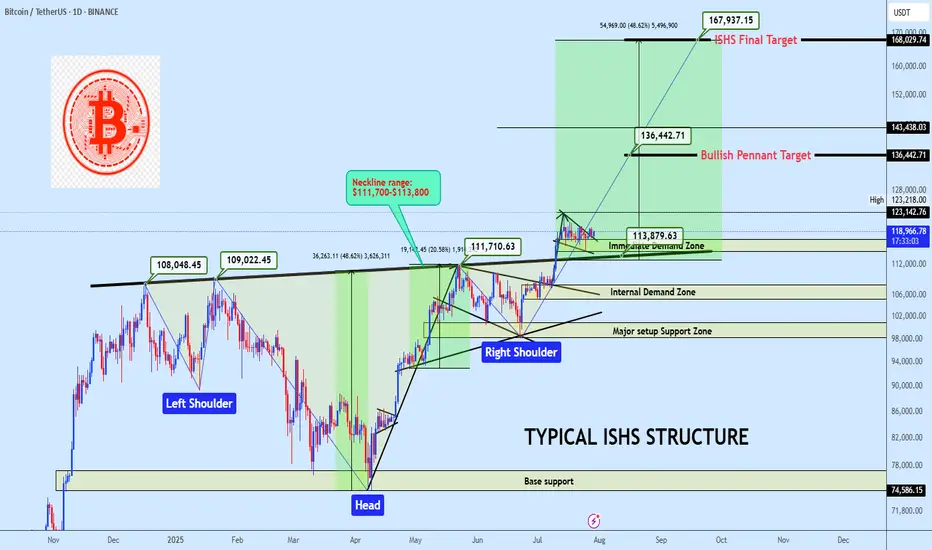
BTCUSDT ISHS Breakout with Bullish Pennant ContinuationBTC is holding above a clean neckline breakout from a inverse head and shoulders formation, currently consolidating inside a bullish pennant. A breakout from this range offers continuation potential to $136K and possibly to $168K. Bias remains bullish while price holds above the $114K region.
Market Structure
• Trend: Bullish continuation
• Pattern: Inverse Head & Shoulders + Bullish Pennant
• Price Action: Clean breakout and retest of neckline support, followed by tightening consolidation
Key Zones
• Immediate Demand Zone: $114,000 – $117,000
• Internal Demand Zone: $105,000 – $108,000
• Major Setup Support Zone: $98,000 – $101,000
• Base Support (ISHS Origin): $74,500 – $77,000
• Neckline: $111,700-$113,800 (Confirmed pivot level)
Technical Confluence
• Volume: Strong candle breakout through neckline, followed by low-volume bullish flag
• Price Geometry: ISHS measured move aligns with the final target at $168K
• Momentum: Bullish structure maintained with higher lows and reactive demand
Entry Plan
• Zone: $117,500 – $119,000
• Method: Limit buy on demand retest or breakout retest of $123K
• Execution: Swing entry with invalidation below demand base
Targets
• 🎯 TP1: $136,442 — Pennant measured move
• 🎯 TP2: $168,029 — Final ISHS target
Invalidation
• ❌ SL: Below $110,000
• Reason: Break below ISHS Neckline invalidates bullish thesis in the short term
• RRR: Estimated 1:4 depending on execution
If this structure aligns with your outlook, feel free to share your thoughts in the comments.
You’re also welcome to drop your preferred altcoins for a quick technical review.
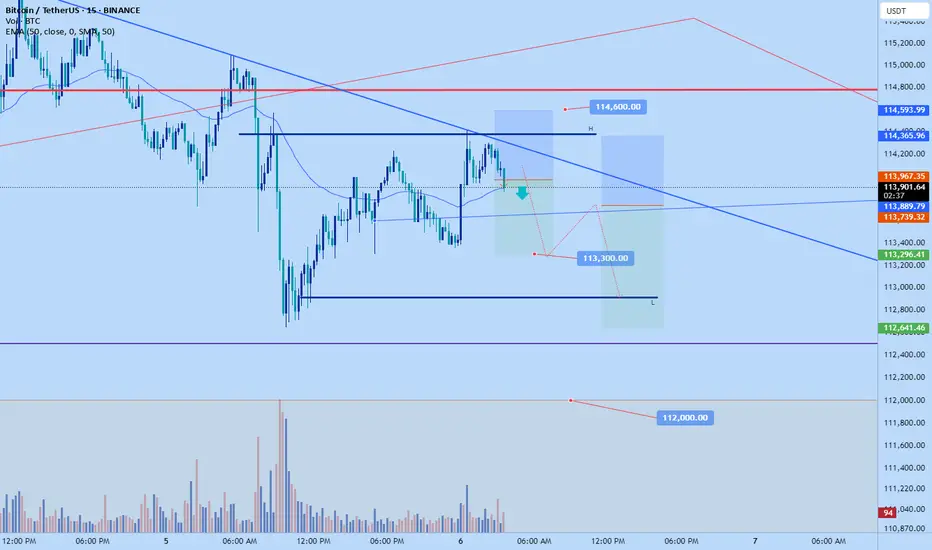
Bitcoin scalp short then main shortJust now opened a scalp short position on #bitcoin. Anticipating another push down to $113300 just in time for another likely correction back up in new york session to dump back down again
Sl: 114,600
TP: 113300
From Fakeout to Takeoff: How the V-Pattern REALLY WorksEver seen a support level break, only for the price to rocket back up in a V-shape? That’s the V-Pattern in action! In this post, Skeptic from Skeptic Lab breaks down the step-by-step mechanics of this powerful setup. From the fakeout that traps short sellers to the surge of buy orders from liquidations, you’ll learn exactly how buyers flip the script and create explosive reversals. Perfect for traders looking to spot high-probability setups. Join me to decode the markets—check out the steps and level up your trading game!

longI think the pullback is complete and the beat can grow, but I'm still paying attention to the Dominance Beat. Thank you for your attention.

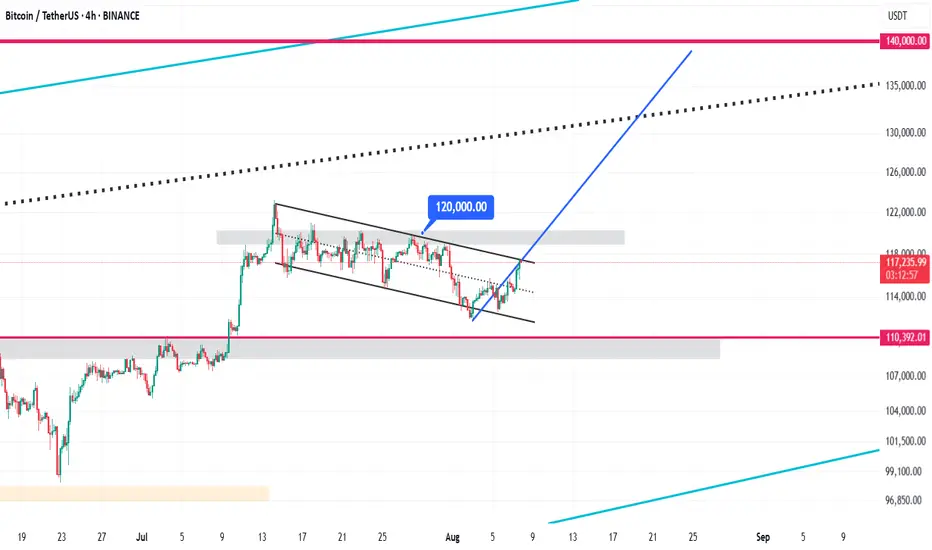
Bitcoin Bullish Flag Pattern Analysis & $140,000 Target🚩 Bullish Flag Pattern Formation
Bitcoin is currently forming a bullish flag pattern on the 4-hour chart. This pattern typically appears after a sharp upward move and represents a short-term consolidation within a descending channel. It usually signals a continuation of the strong bullish trend. Currently, the price is oscillating between the upper and lower boundaries of this channel, poised for a potential breakout.
⏳ Duration of the Correction Phase
The correction inside this channel has lasted from July 14 to August 8, 2025, spanning approximately 25 days. This relatively long consolidation period indicates a deep stabilization phase, allowing the market to gather momentum for the next upward wave. During this time, Bitcoin traded in a tight range between the channel’s support and resistance levels.
⚠️ Critical Resistance at $120,000
The key resistance level to watch is $120,000. If Bitcoin can break this level decisively with strong volume and confirming candles, the bullish flag pattern will be validated, signaling a continuation of the upward trend. This breakout point is considered an optimal entry for new long positions.
🎯 Price Target at $140,000
The target price derived from the bullish flag pattern, calculated by measuring the flagpole and projecting it from the breakout point, is around $140,000. This represents approximately a 20% gain from the breakout and may serve as a significant psychological resistance level.
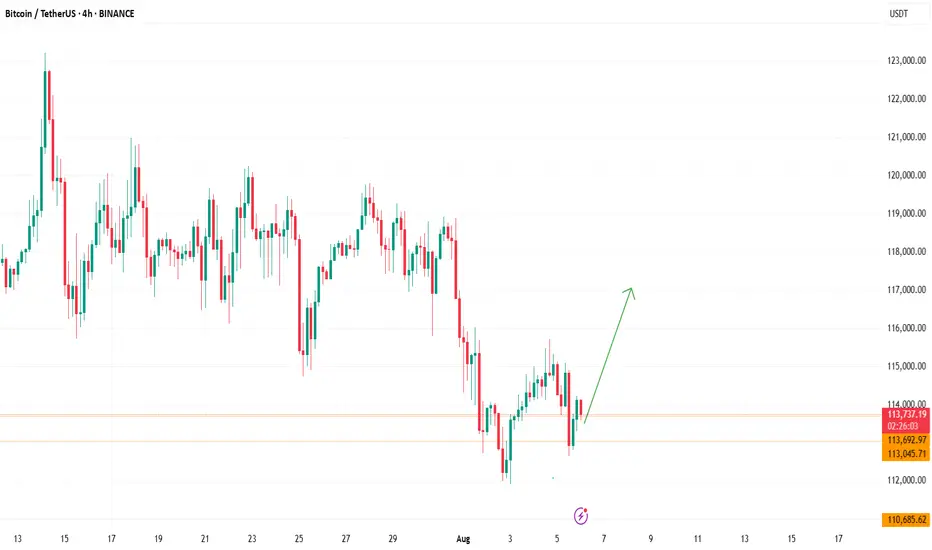
Bitcoin Technical Analysis | August 7, 2025 Bitcoin Technical Analysis | August 7, 2025
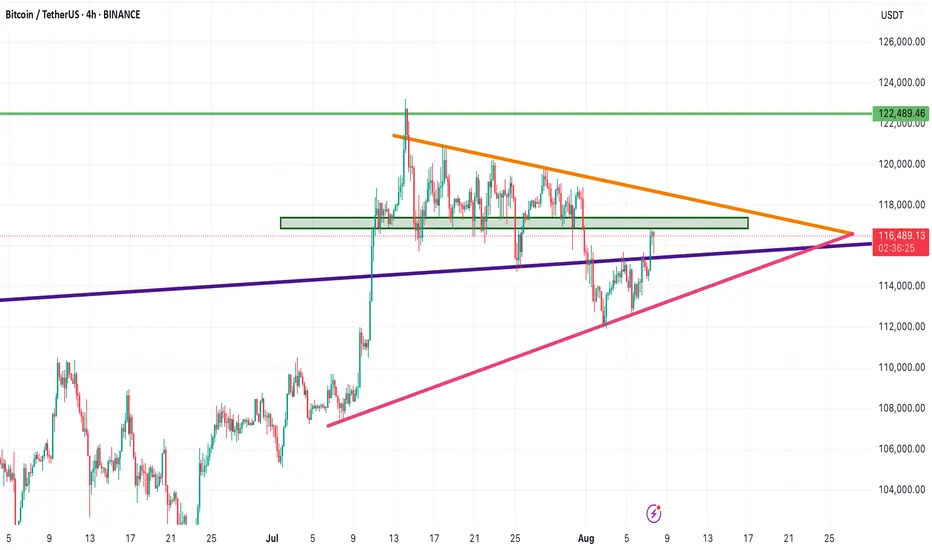
After a corrective move to the $112,000 support zone, Bitcoin bounced back and is now moving along a rising trendline (highlighted in pink). As long as the price holds above this line, the bullish structure remains intact.
🔸 Currently, BTC is approaching a key resistance zone between $117,500 and $118,600, which aligns with the descending orange trendline on the chart. If this zone is broken with confirmation, the next potential targets will be:
$122,400
and $129,500
🔻 However, if the price gets rejected from this resistance:
The first support lies at $115,570
Breaking below that, the next support will be the purple trendline
A confirmed break of the bullish structure could push BTC down to $110,524
📌 Conclusion:
Bitcoin is nearing the apex of a symmetrical triangle pattern. A breakout in either direction could define the next major move. Make sure to mark these critical levels on your chart and adjust your trading strategy accordingly.
BTC ~ will it make new lows!?Ideally its following the pattern i drew, and latter after NY session, it would claim the lows ideally after the buying activity I am antiiipating now!
Is it time to buy BITCOIN now?My previous analysis of reaching $112,000 was correct and now Bitcoin is around $113,000. Is it time to buy now? The answer is no because the price has not yet stabilized and other news may push the price below 112,000. Also, the NEW RSI indicator has not yet crossed its moving average.

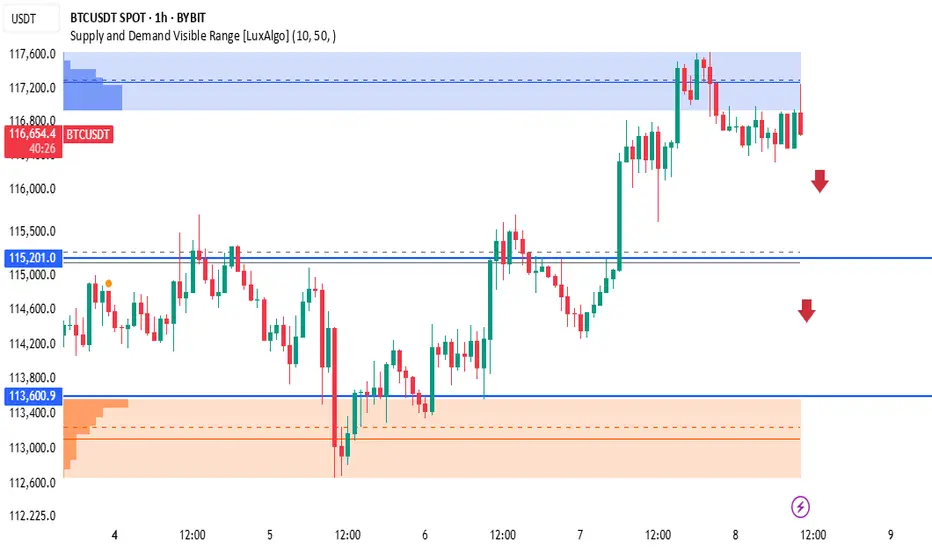
BTCUSDT 1H Supply Zone Rejection – Bearish Setup in PlayIf price fails to reclaim the supply zone, we expect a rejection and drop toward lower demand areas
Price broke market structure previously at 115,201, which now acts as the first major support
🎯 Trade Plan (Sell Idea):
text
Copy
Edit
Entry: Near 116,800–117,000 (within supply zone)
SL: Above 117,300
TP1: 115,201 (support zone)
TP2: 113,600 (high-probability demand zone)
TP3: 113,000 (orange demand base)
Risk:Reward ~ 2:1 to 3:1
🧠 Key Zones:
🔵 Resistance/Supply Zone: 116,800 – 117,300
🔵 Support Zone 1: 115,201
🟠 Strong Demand: 113,000 – 113,600
📌 Notes:
This is a clean reaction setup from a well-defined supply zone using volume profile and price action. Look for confirmation like bearish engulfing or M-pattern on lower TF before shorting.
⚠️ Disclaimer:
This is not financial advice. For educational purposes only. Always do your own analysis and manage risk.
Bitcoin (BTC): Bullish Start of Week | Eyes on $110KOur attentions are currently at $110K on BTC, where we maintain the bullish plan as long as we are above that zone.
This zone is marked as the BOS area for us, where currently we are seeing the price has retested it and bounced right off again, leading the price back to upper zones here.
So once again, as long as we maintain that area, we are bullish; if we break it, we are going to look for that Bollinger Bands middle line!
Swallow Academy
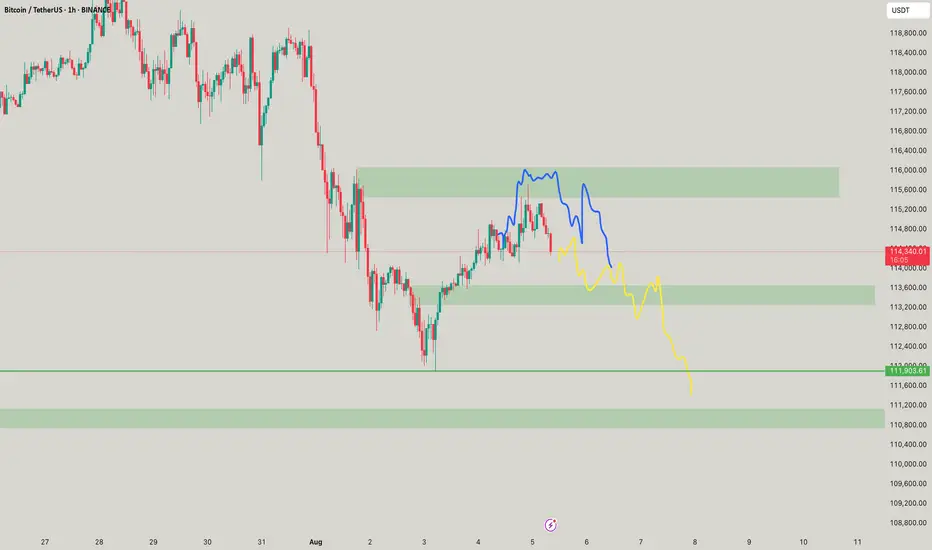
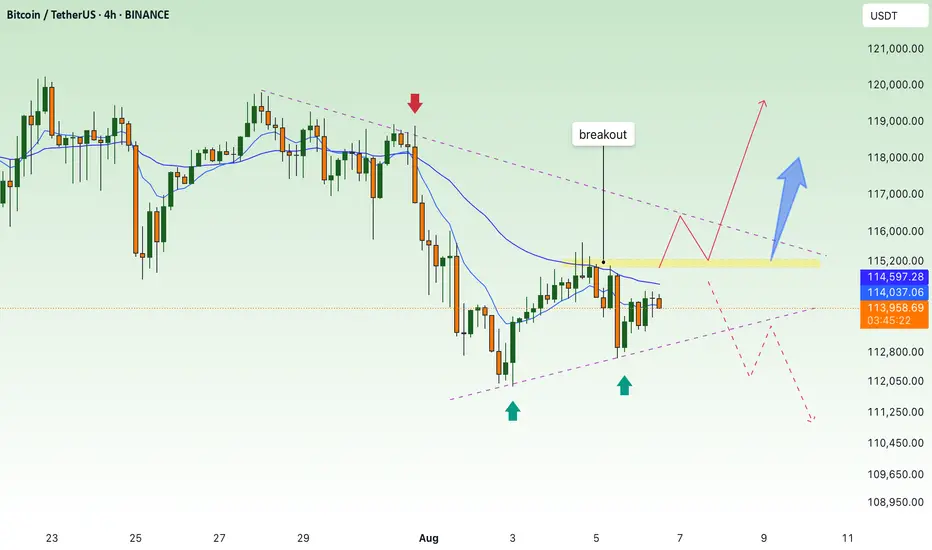
BTC continues to accumulate, waiting for breakout to go up💎 MID-WEEK BTC PLAN UPDATE (06/08)
Brief BTC Analysis – 4H Timeframe:
• Main Trend: Price is consolidating within a descending channel (green diagonal lines).
• Support: The 112,500–113,000 zone has been tested twice and bounced (green arrows).
• Resistance: The 114,800–115,200 zone (purple area) – this is the key level that will determine the next trend.
⸻
Two main scenarios:
🔺 Bullish Scenario (Preferred):
• Price breaks above the 115,200 resistance zone → confirms a breakout from the descending channel.
• Next targets: 116,500 → 119,000.
🔻 Bearish Scenario:
• Price gets rejected at around 115,000 and breaks below the 113,000 support → likely to revisit 110,000.
📌 Key Signals to Watch:
• A clear breakout above 115,200 with volume is a strong buy signal.
• If the price fails to break this zone, consider selling once there is a clear bearish reaction.

How to Use AI for Crypto Trading (The Right Way)lemme answer real quick: YOU DON’T.
Most traders using AI in crypto are straight up doing it wrong.
Here’s the usual story:
They open ChatGPT and ask,
“Hey… uhm… tell me which altcoin will 100x… Bruh, I heard you know everything, bet you know the next 10x coin!”
ChatGPT confidently replies,
“Sure, buy this coin right now…”
And the trader’s like,
“Ok, thanks.”
Then they jump on Binance, smash that buy button, and lose money faster than you can say ‘left trading’.
Don’t be that guy. Tools like ChatGPT weren’t made for this wild crypto jungle. Crypto’s a messy, super risky market, and ChatGPT’s language models mostly have old info anyway. They can’t give you solid, grounded analysis of what’s really going on — on-chain or across exchanges.
BUT, if you wanna cut through the hype and dodge the FOMO, this quick guide is for you. I’ll show you how to use AI the right way — with real on-chain and off-chain data, and special AI agents built specifically for crypto research.
Wanna keep going? Cool, let’s dive in. If not, peace out and don’t waste your time.
1. Use AI That Actually Processes On-Chain and Off-Chain Data
Real AI power kicks in when you talk about scale — thousands of tokens, millions of wallet moves, shifting stories everywhere. Humans can’t keep up, but AI can process it all instantly, in real time.
Look for AI tools that analyze stuff like:
Wallet behavior and how smart money moves.
Token velocity and decentralized exchange volumes.
Social sentiment from Twitter, Reddit, Discord, Telegram.
Developer activity, governance updates, protocol changes.
How market narratives pop up and spread.
2. Use AI Agents Made Just for Crypto Research
Crypto’s not like stocks or forex. It’s faster, fragmented, and shaped by both on-chain wallet moves and off-chain communities.
That’s where specialized AI agents shine. They understand stuff like:
How wallets behave during airdrops.
How Telegram groups hype early projects.
How dev activity correlates with price moves.
Instead of raw data dumps, these crypto-native AI agents spot patterns that’d take humans days to find. Like spotting when big wallet clusters start accumulating in a new ecosystem, or when a protocol suddenly blows up on social media.
3. Combine Research & Automation for Full-Spectrum Edge
I’m personally pumped about this part. Imagine an AI agent tracking low-cap funds moving into Telegram channels, running sentiment analysis, then tracking smart wallets accumulating tokens (even mixing in technical analysis).
Finally, it finds your risk management , sets triggers, and helps you enter trades with clear stop-loss and target levels.
Quick heads-up: Because of TradingView’s house rules, I can’t drop any links here — you gotta search and find your best AI tools on your own.
Remember : The only way to survive this market is to stay skeptical , watch risk management like a hawk, and keep your head cool. So if you feel FOMO creeping in or money management slipping — close your laptop, hit a coffee shop, and order a espresso. Trust me, it’s worth it.
Thanks for sticking with me till the end of this lesson. Im Skeptic from Skeptic Lab & If this helped, smash that boost button and I’ll catch you in the next one! :)

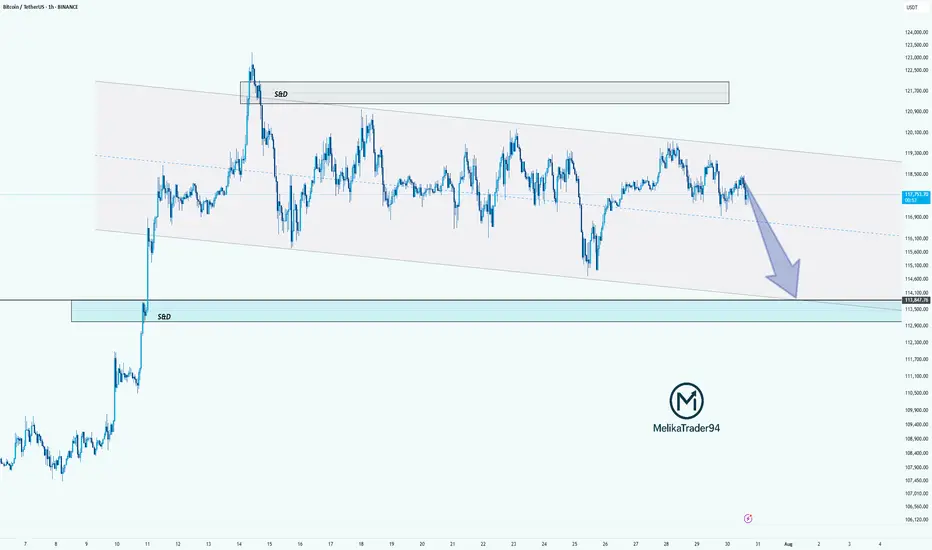
BTC: in a new drop?!Hello guys!
btc is running in a descending channel!
However, the upper level is broken up, but it could reach the upper level after a drop here!
I am not sure about this analysis!
What do you think about it?
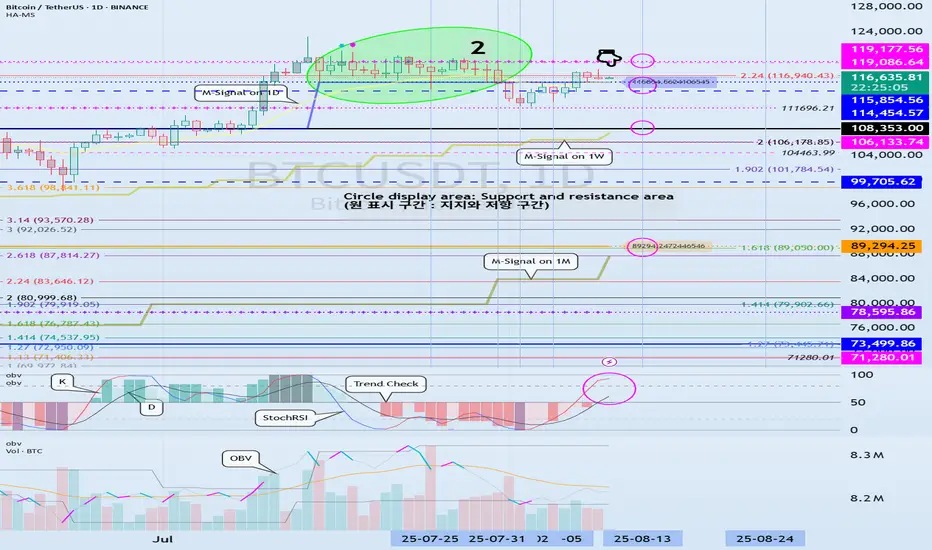
Support and Resistance Areas: 114454.57-115854.56
Hello, traders!
Follow us to get the latest information quickly.
Have a great day!
-------------------------------------
(BTCUSDT 1D Chart)
The K indicator on the StochRSI indicator appears to have entered the overbought zone, leading to a change in slope.
Therefore, the upward trend appears likely to be constrained.
-
We need to confirm whether the price falls within the range indicated by the index finger.
The key question is whether there is support around 114454.57-115854.56.
If it declines, it is likely to continue until it meets the M-Signal indicator on the 1W chart.
At this point, we need to check for support around 108353.0.
This period of volatility is expected to occur around August 13th (August 12th-14th).
The start of a stepwise uptrend is likely to occur only after it rises above 119177.56.
-
Thank you for reading to the end.
We wish you successful trading.
--------------------------------------------------
- This is an explanation of the big picture.
(3-year bull market, 1-year bear market pattern)
I will explain in more detail when the bear market begins.
------------------------------------------------------
BTCUSDCOINBASE:BTCUSD
Well I need price to make a retest to this level since it’s a break of resistance


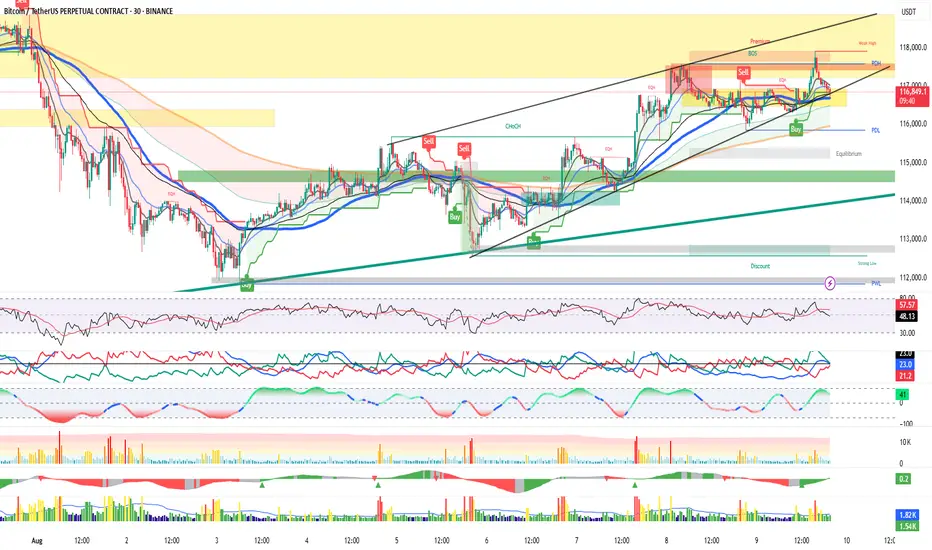
BTC/USDT — All-in-one MTF Map & Trade Plan (30m/4H/1D/1W)Summary: HTF uptrend intact; price is compressing inside a rising channel just under 117.4–117.6 (PDH/supply/premium edge). Intraday path: hold 116.7–116.9 → retest 117.4; lose 116.7 → slide to PDL/EQ.
Structure
Weekly: HH/HL above trendlines; weak high ~120k remains a magnet if 118k clears.
Daily: Riding 21/50D EMAs in an ascending channel; shallow pullbacks bought.
4H: Repeated rejections at 117.4–117.6; higher lows along inner trendline.
30m: Tap of channel/EMA confluence 116.7–116.9 after a PDH sweep; momentum neutral.
Key Levels
R1: 117.4–117.6 (PDH/EQH)
R2: 117.9–118.2
R3: 119.6
R4: 120.0k (weak high/liquidity)
S1: 116.9–116.7 (trendline + EMAs)
S2: 116.1 (PDL)
S3: 115.5–115.0 (Equilibrium block)
S4: 114.9–114.4 (demand)
S5: 112.8–112.2 (discount/“strong low”)
Momentum / Volume
RSI mid-50s (room either way).
ADX ~23 (trend mild) → next break likely expands.
Sell wicks at PDH; lighter pullback volume favors bounce if S1 holds.
Setups (If-Then)
Breakout Long: 30m/4H close >117.6 → 117.9/118.2 → 119.6 → 120k.
Invalidation: swift slip <117.2.
Range Long (buy the dip): Bullish reaction at 116.7–116.9 → 117.0 → 117.4–117.6.
Invalidation: 30m close <116.7.
Breakdown Short: Clean 30m close <116.7 then <116.0 → 116.1 → 115.5–114.6; stretch 112.8.
Invalidation: reclaim >116.9.
Bias: Neutral-to-bullish above 116.7 (look for 117.4 retest / 118k squeeze). Bearish below 116.7, targeting PDL → EQ. Wait for edge breaks; avoid mid-range chop 117.0–117.3.