B/USDTKey Level Zone: 0.34850 - 0.36500
HMT v8.1 detected. The setup looks promising, supported by a previous upward/downward trend with increasing volume and momentum, presenting an excellent reward-to-risk opportunity.
HMT (High Momentum Trending):
HMT is based on trend, momentum, volume, and market s

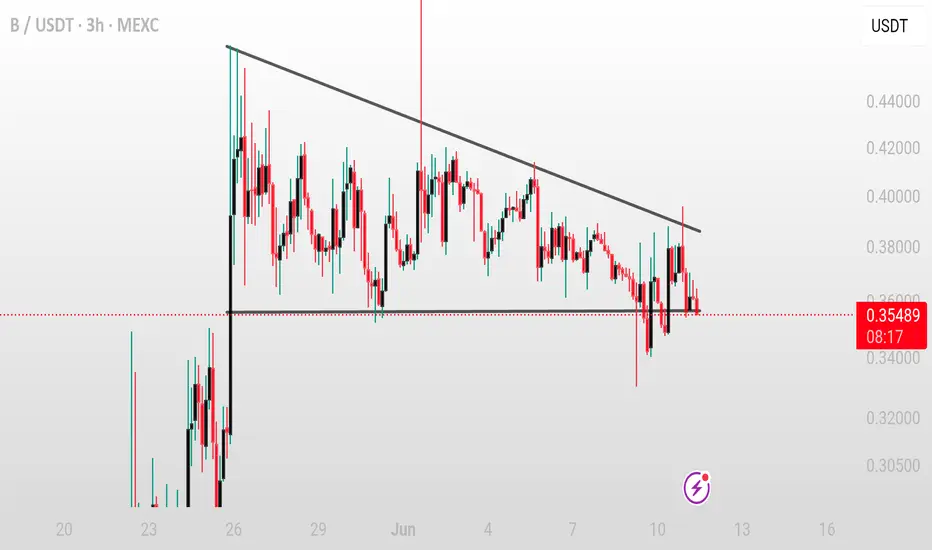
B/USDT – Descending Triangle Breakdown B/USDT – Descending Triangle Breakdown
pattern: descending triangle
timeframe: 3H ⏱️
status: support broken – breakdown in progress ⚠️
idea:
B has broken below key horizontal support at 0.3500–0.3550. If price sustains below and rejects this level on retest, further downside is likely 🔻
entry (c
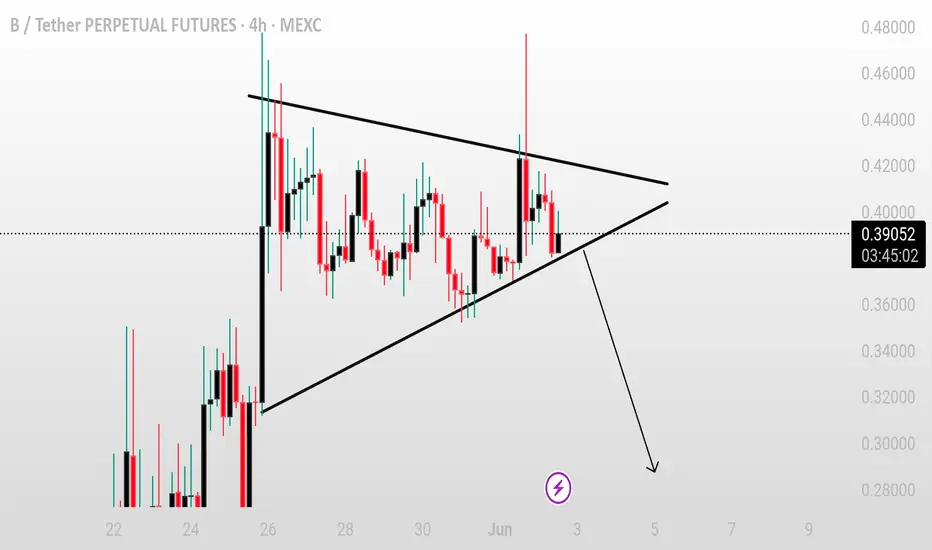
BUSDT/USDT – Symmetrical Triangle Breakdown SetupBUSDT/USDT – Symmetrical Triangle Breakdown Setup
BUSDT is currently trading within a symmetrical triangle pattern on the 4H timeframe, indicating price compression and a possible breakout or breakdown ahead. The price is now hovering near the lower trendline, and pressure is building up.
A clean

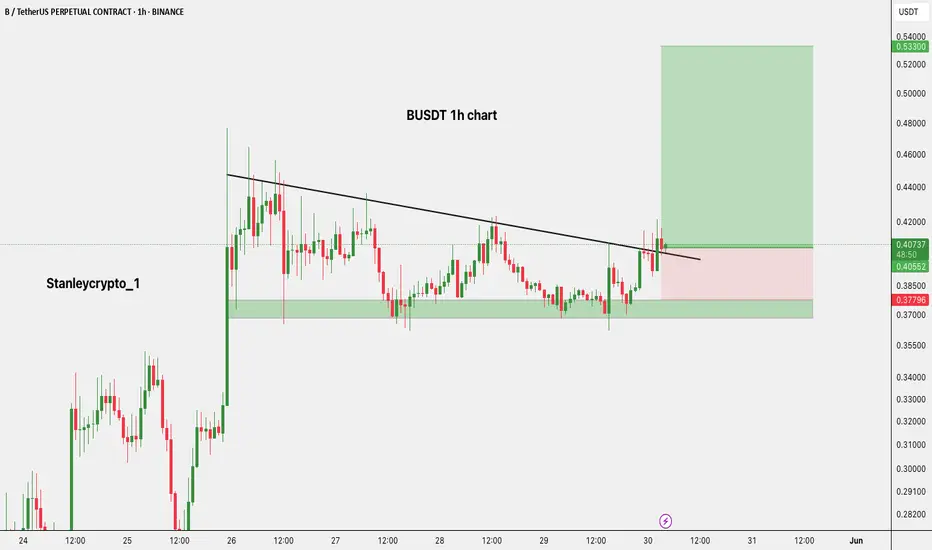
$BUSDT Trade Setup 1HMEXC:BUSDT Trade Setup (1H)
Entry: CMP
SL: $0.37796
TP: $0.47400 / $0.53300
Setup: Breakout above trendline with strong support at $0.37313.
Needs 1H close above $0.41 for confirmation.
DYRO, NFA
$BUSDT Ready to Explode? Breakout Could Send It Flying#BUSDT is demonstrating strong potential for a pennant breakout.
A successful breakout could trigger a +60% bullish rally in the coming days. 🚀
#Altseason2025
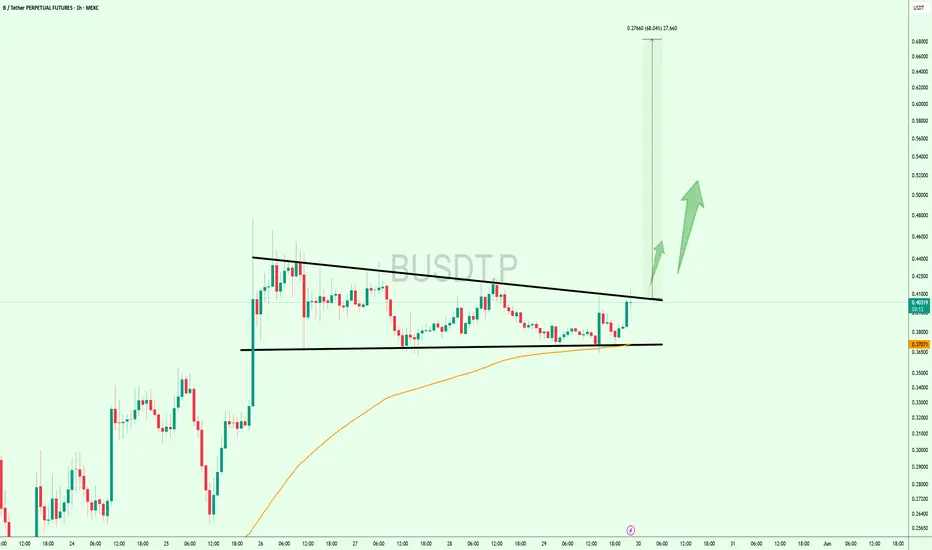
Busdt Busdt could see an impulsive move up to 0.54 after a brief correction from a previous impulsive move

B/USDT Bullish flagB/USDT has recently formed a textbook bullish flag pattern on the lower timeframes, signaling a continuation of the prior upward move. Price action is currently showing strong momentum after breaking out of the flag consolidation.
a scalp trade targeting $0.50 as the next key resistance level.

$B Long Setup 1H Chart Price has broken out of the trendline and is retesting the breakout zone
Strong support is seen around the $0.36–$0.37 demand zone.
- Entry: CMP
- Stop Loss: $0.37297
- Targets:
• TP1: $0.44455
• TP2: $0.53243
DYOR | NFA

B/USDT PERPETUAL TRADE, Sold From $0.33200B/USDT PERPETUAL TRADE
B/USDT SELL SETUP
Currently $0.33200
Sold From $0.33200
(Trading plan If B go up to $0.36
will add more shorts)
Expecting target $0.30800 OR DOWN
Incase of early exist will update this anaylsis
Its not a Financial advice

See all ideas
Summarizing what the indicators are suggesting.
Oscillators
Neutral
SellBuy
Strong sellStrong buy
Strong sellSellNeutralBuyStrong buy
Oscillators
Neutral
SellBuy
Strong sellStrong buy
Strong sellSellNeutralBuyStrong buy
Summary
Neutral
SellBuy
Strong sellStrong buy
Strong sellSellNeutralBuyStrong buy
Summary
Neutral
SellBuy
Strong sellStrong buy
Strong sellSellNeutralBuyStrong buy
Summary
Neutral
SellBuy
Strong sellStrong buy
Strong sellSellNeutralBuyStrong buy
Moving Averages
Neutral
SellBuy
Strong sellStrong buy
Strong sellSellNeutralBuyStrong buy
Moving Averages
Neutral
SellBuy
Strong sellStrong buy
Strong sellSellNeutralBuyStrong buy