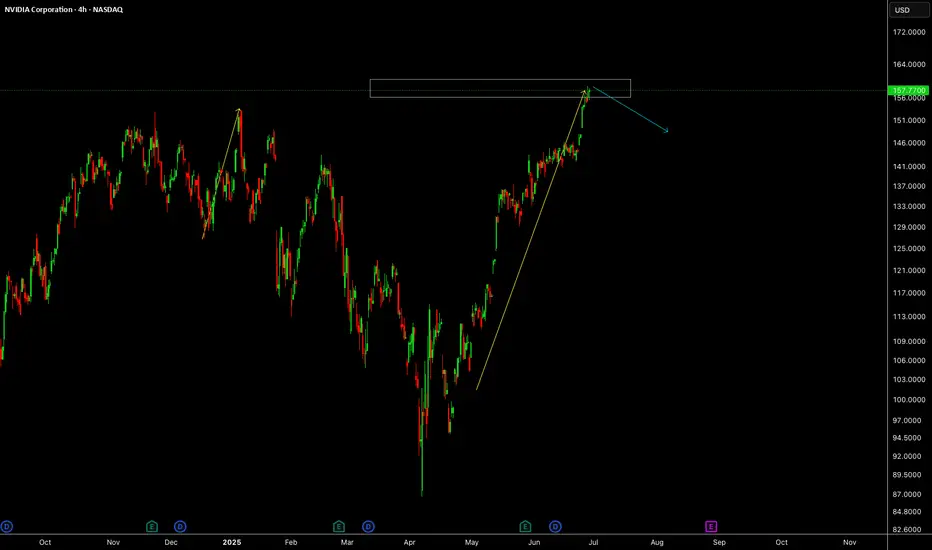
NVIDIA (NVDA) 4H Setup – Rocket Booster Strategy Building🚀 NVIDIA (NVDA) 4H Setup – Rocket Booster Strategy Building Momentum After Gap-Up and Volume Spike 📈
NVIDIA (NVDA) is showing early signs of another bullish
continuation on the 4-hour chart, echoing a similar pattern seen recently on Microsoft. This setup fits well within the Rocket
Booster Strategy framework — a method focused on catching strong trend acceleration signals backed by confluence.
Here’s what’s happening on NVDA’s chart:
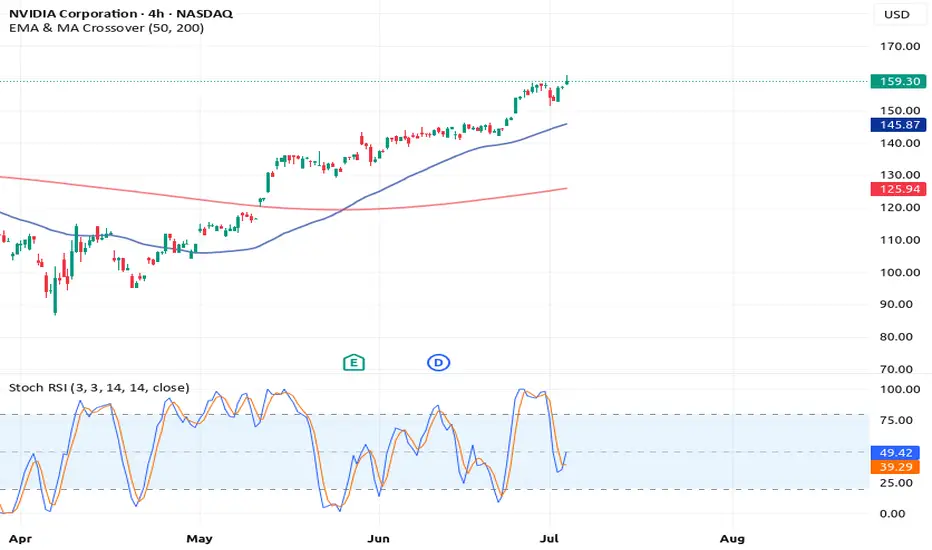
1. High Volume on the 4H Candle
There’s been a strong increase in volume on a bullish 4H candle, indicating significant interest at current levels. This suggests
accumulation or breakout positioning, typically a good sign ahead of momentum bursts.
2. Stochastic RSI Between 50 and 20
While the Stochastic RSI hasn’t bounced from the oversold zone yet, it’s hovering between 50 and 20 — a zone that often acts as a
launching point for continued upward momentum. This shows that buyers are gradually regaining control without being overextended.
3. Price Above the 50 EMA and 200 EMA
NVDA is currently trading well above both the 50 EMA and 200 EMA on the 4-hour chart. This bullish structure confirms a strong
underlying uptrend, and it gives added confidence to long positions.
4. Bullish Gap-Up
A gap-up occurred recently, further confirming buying pressure. Gaps during trending conditions often signal the start of a new
impulsive wave, especially when backed by rising volume and clean trend structure.
Strategy Context
This is a textbook setup for the Rocket Booster Strategy, though the Stochastic RSI is not fully reset. Instead, it’s showing a more
gradual buildup of strength — which can be an early entry signal before larger players pile in.
Entry: On 4H candle continuation or brief intraday retracement
Stop Loss: Below the gap or recent support
Target: Previous swing highs or Fibonacci-based extensions
Final Thoughts
NVIDIA is showing strong signs of bullish continuation, and this could be the early stage of a new momentum phase. The
Stochastic RSI position adds a slightly different flavor to the setup
— more of a buildup than a reversal — but the overall structure remains solid. As always, risk management is key.
Let me know in the comments if you’re watching NVDA too or already in the trade. More setups like this coming soon.
🔥 Rocket Booster Strategy: Engaged for NVDA?
Disclaimer:
This analysis is for educational and informational purposes only. It does not constitute financial advice or a recommendation to buy or sell any security.
Always do your own research and consult a licensed financial advisor before making any trading decisions. Trade at your own risk.
NVDA trade ideas
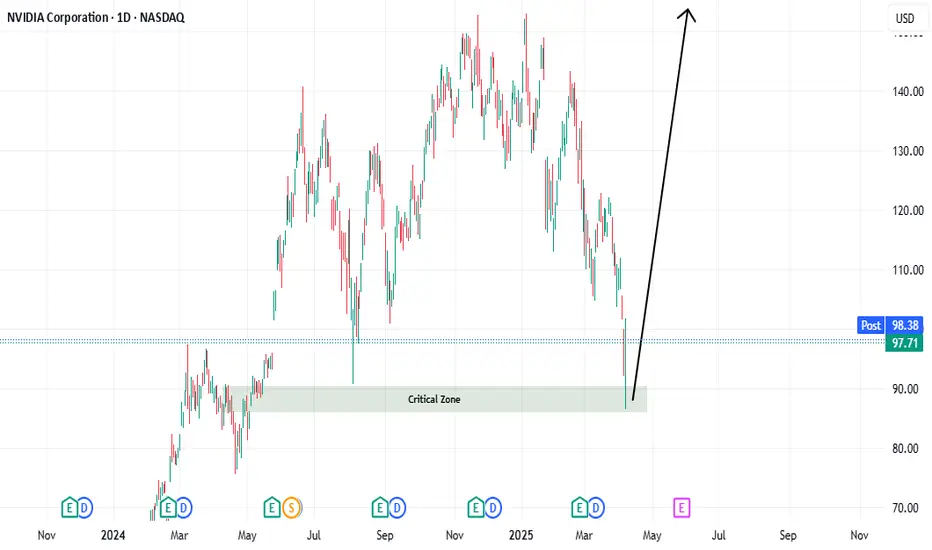
NVDA$ - possible pullback to $50 (-67% from pick) in the making.NASDAQ:NVDA have done this before (67% pullbacks after long rally).
NVDA is following very predictable patterns for many years now, despite excitement around this stock - stock made "new recent low" and current rally maybe just a part of a "head and shoulders" in the making. If "new all time high" is not reached with in the next few weeks - we will see stock pullback to $50 or less in the next 6-9 month.
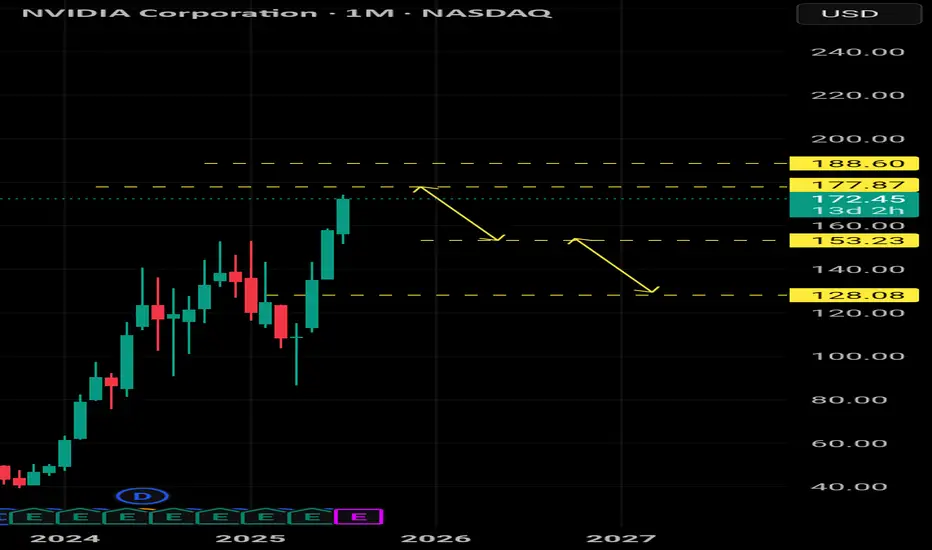
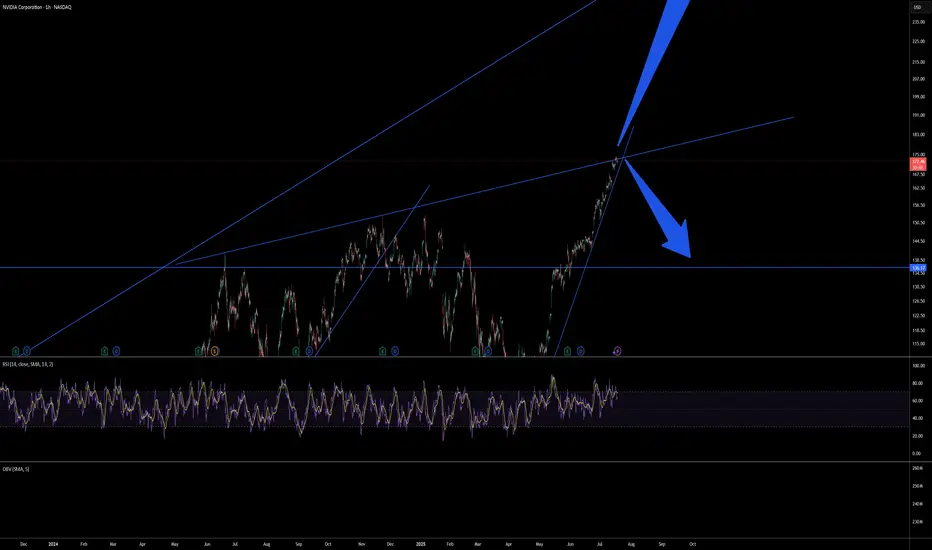
Potential NVIDIA Pullback: Watch These Key SupportsWe might witness a correction on one of the strongest stocks – NVIDIA
The level 177 is a very critical support.
Followed by the level 188 as another key level.
Correction targets are clearly illustrated on the chart in front of you.
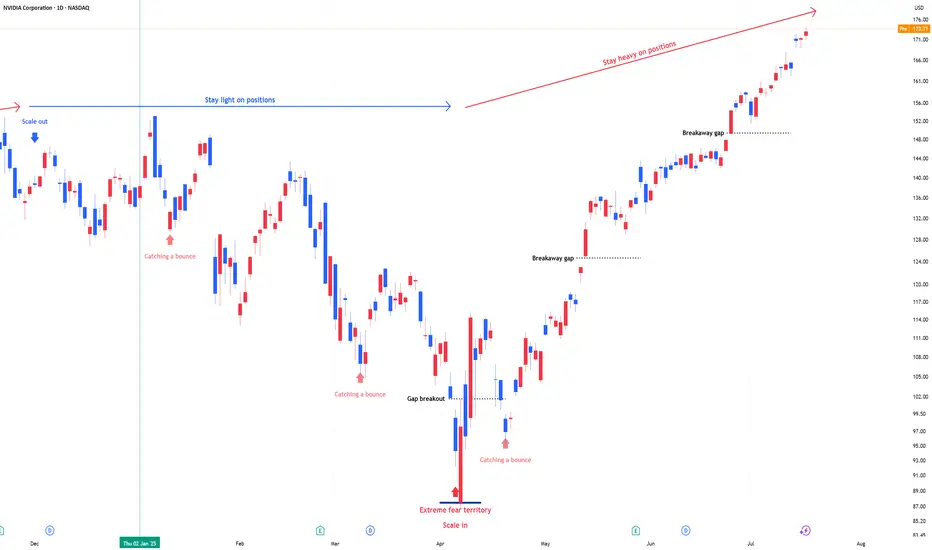
NVIDIA: Stay heavy on positionsNVDA position size is adjusted in line with US market signals for underweight or overweight allocations. During panic phases, 2x leverage ETFs are on the table
Stay heavy on positions.
$NVDA – Going Long Long LONGTaking a long position here at $98 – yes, despite the noise.
There’s no denying the pressure across semiconductors following renewed tariff threats from the Trump administration. But I believe this is more short-term overreaction than long-term damage. Any meaningful negotiation or de-escalation could act as a slingshot for these names, especially leaders like Nvidia.
Nvidia's fundamentals remain incredibly strong. The company is still outpacing its peers in AI, data centers, and gaming hardware. Profitability remains intact, and there’s no indication of a breakdown in their competitive edge.
Technicals are giving us some strong signals:
We're seeing a long-term bullish divergence forming.
RSI is approaching oversold territory – rare for Nvidia and historically a signal for strong bounces.
Price is nearing key long-term support levels that held in previous cycles.
I'm positioning early here because I believe the broader market is mispricing geopolitical risk. If the situation improves – and it often does faster than expected – NVDA is one of the first names that will rebound aggressively.
Let’s see how this plays out, but I’m confident this is a high-conviction entry point in the 80's and 90's.

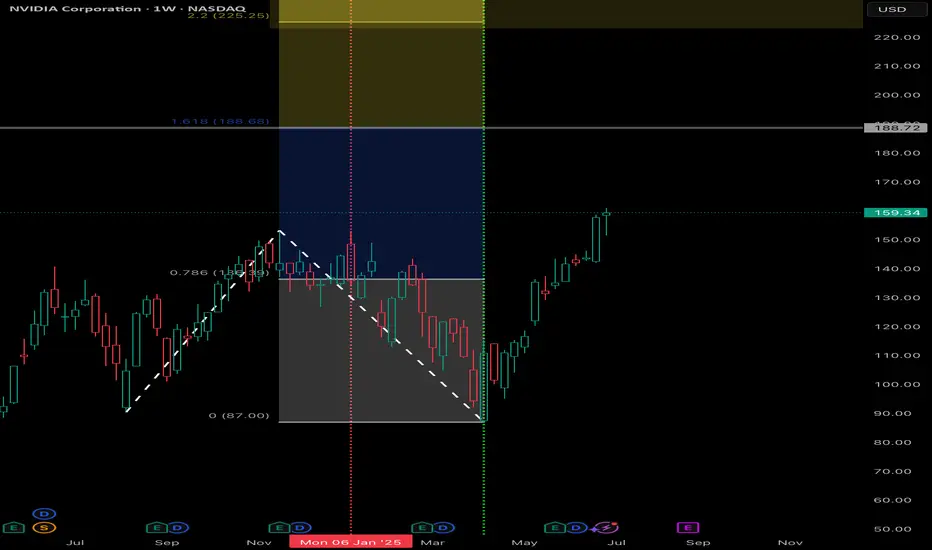
NVDIA to 185 or Higher base Trend ExtensionInitial Impulse Move (P1 to P2): The strong upward movement from $90.33 to $153 shows significant bullish momentum.
Healthy Retracement (P2 to P3): The pullback to $87 represents a deep correction—deeper than the starting point, suggesting a potential shakeout before resuming upward.
Extension Projection: Using the 1.618 level from this wave structure, the projected price of ~$187 serves as a potential target or resistance level where price may react or consolidate.
Technical Significance: The 1.618 level is often used by traders to anticipate where profit-taking or trend exhaustion may occur in strong moves, especially after a retracement.
NVIDIA: More Room in Wave BNvidia’s strong rally over recent weeks lifted the stock above resistance at $153.13. Despite a brief pullback on Tuesday, we still expect beige wave B to extend toward $178.39. Afterward, beige wave C should initiate a substantial correction, likely finding its low above $81.98 to complete blue wave (IV). If Nvidia rallies directly through $178.39, that would support our alternative view that blue wave alt.(IV) has already bottomed (37% probability).
📈 Over 190 precise analyses, clear entry points, and defined Target Zones - that's what we do.

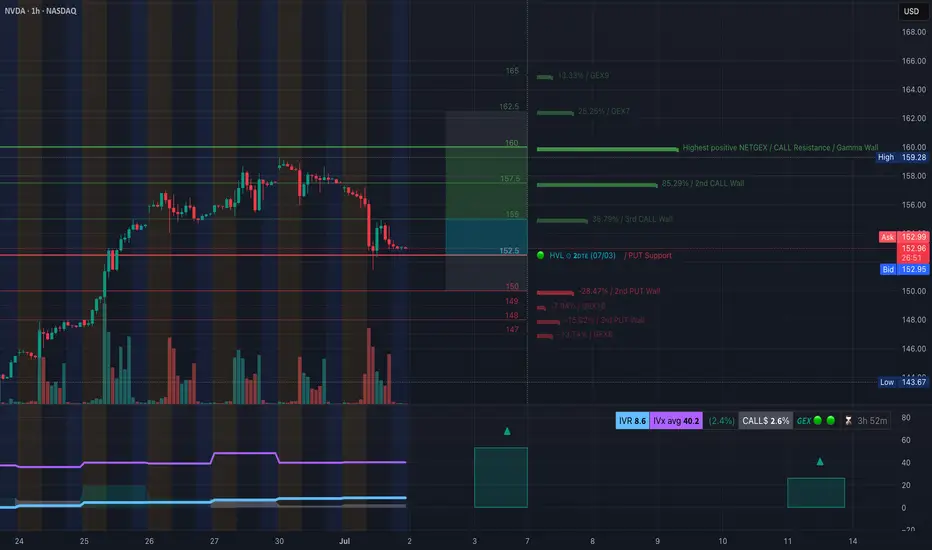
NVDA Buyers Getting Squeezed? What Gamma & Price Action Say NextGEX-Based Options Insight (Gamma Exposure):
📉 NVDA is currently sitting at $152.54, just above a key PUT wall at $150, with GEX sentiment tilted bearish short-term.
* Highest Call Resistance / Gamma Wall: $160
This is the level with the strongest net positive GEX, acting as a cap where market makers may short against CALLs.
* 2nd Call Wall: $158 – Heavy positioning here, could slow price if it bounces.
* PUT Support: $150 – Strong gamma magnet; price may hover or bounce near this.
* IVR: 8.6 (low) – Options are relatively cheap.
* CALLs Flow: 2.6% bias – Weak call flow, favors downside or range behavior.
💡 Options Trade Suggestion:
Because NVDA is under the gamma wall and just above strong PUT walls, consider buying a debit PUT spread, especially if $152.50 breaks.
* Setup: Buy 155P, Sell 150P expiring this Friday
* Risk: Defined
* Reward: Targets $150 zone (gamma magnet)
* Only valid below $152.50 breakdown
1H Price Action + SMC Trade Plan (Chart 2):
🟣 Structure Breakdown Confirmed – NVDA lost its rising structure and broke BOS + CHoCH zones near $157–158.
📉 Current Bias: Bearish
Multiple break-of-structure (BOS) and change-of-character (CHoCH) events suggest a shift to downtrend.
🟩 Possible Short Entry Zone:
* Price could retest the last order block around $155–156 for a lower high before dropping.
📍 Short Trade Idea:
* Entry: Around $154.80–$155.50 (if price retests)
* Stop: Above $157.99 (previous high)
* Target: $150 (1st TP), $147.50 (2nd TP, PUT wall)
📍 Alternative Scenario (invalidates the short):
If price reclaims $158 with strength, we could get a squeeze toward the $160 gamma wall.
Conclusion & Plan:
Right now, NVDA is in a short-term downtrend, aligning with bearish GEX flow. Option sentiment, volume, and structure all favor selling bounces into $155–157 with $150 as magnet. But don’t short blindly—watch if price retests OB and rejects. Use PUT debit spreads or simple 1 DTE options with tight stops.
Disclaimer: This analysis is for educational purposes only and does not constitute financial advice. Always do your own research and manage your risk before trading.
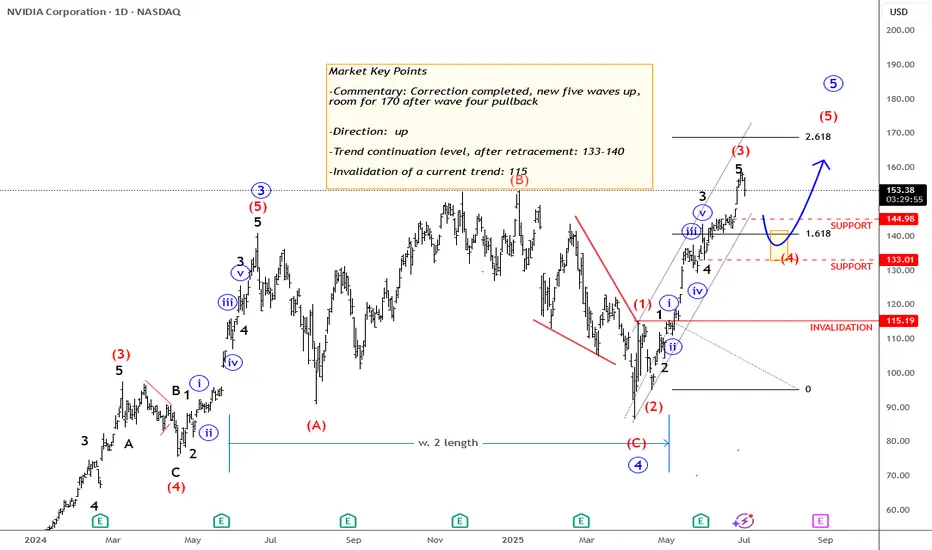
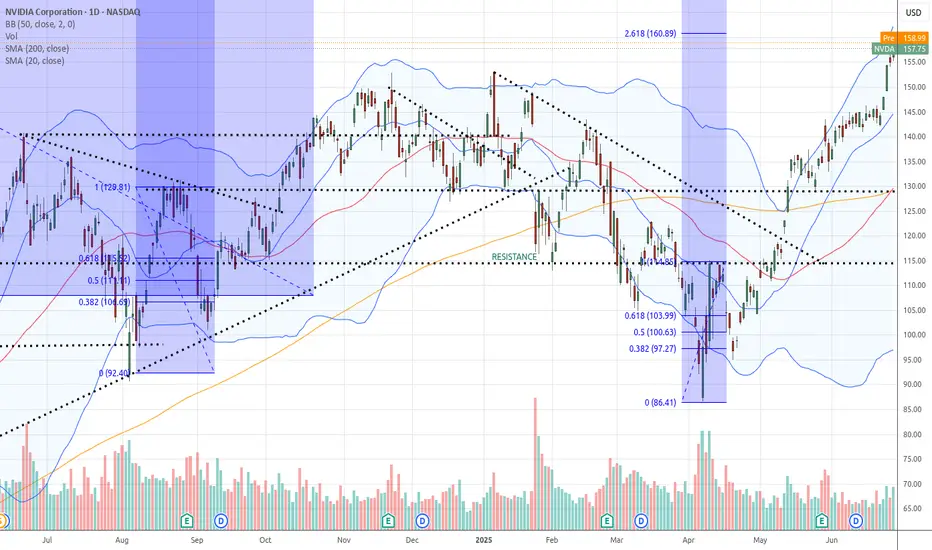
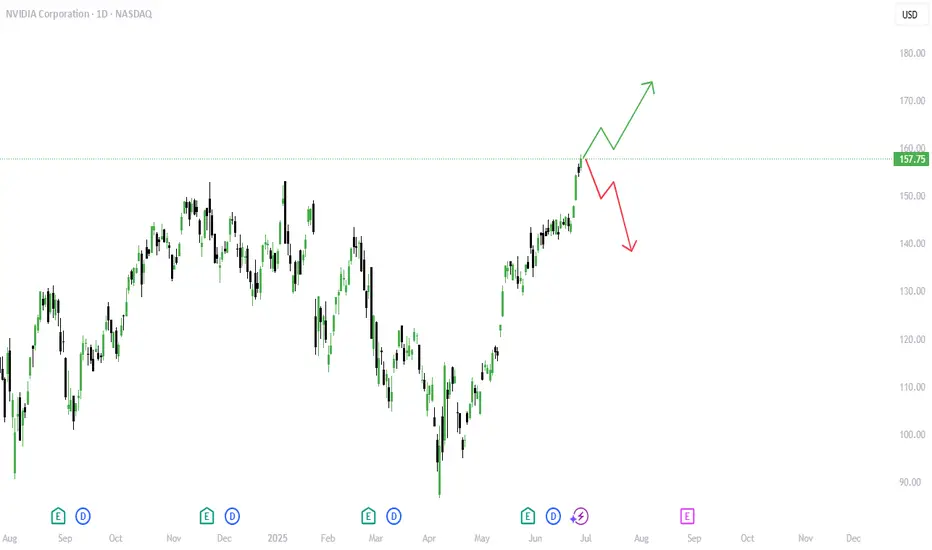
Nvidia - More Upside After Correction NVIDIA completed an irregular flat correction back in April. Since then, the price action has been strong and steady, forming higher highs and higher swing lows —a clear sign of bullish con-
continuation.
From an Elliott Wave perspective, the current move appears incomplete, as we cannot yet identify a full five five-wave advance from the April lows. This suggests that more upside may still be ahead.
However, we could see a wave four pullback develop sometime during the summer. If that occurs, the key support zone to watch would be around $140 down to $130, which could provide
an opportunity within the ongoing uptrend.
- Resistance: 170
- Support: 143 / 132
- Invalidation: 115
GH
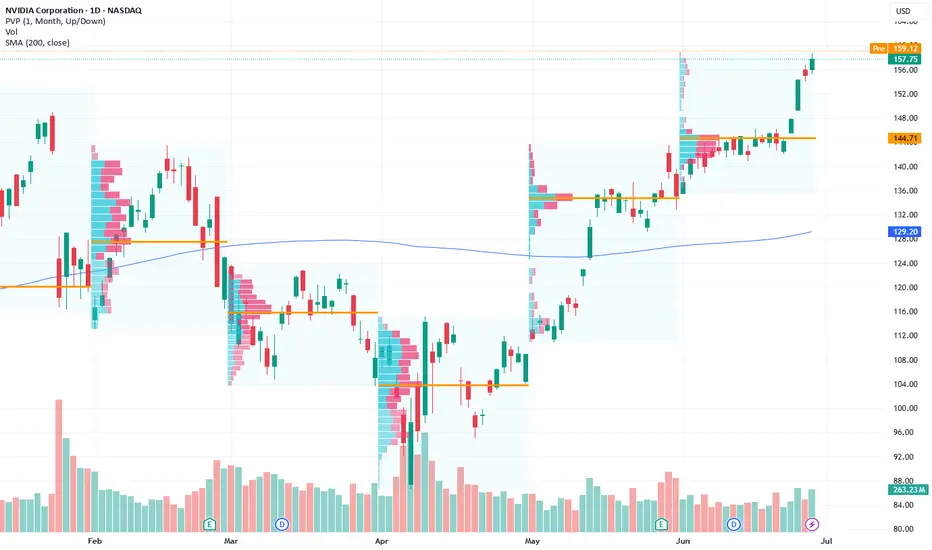
Nvidia Breaks Out and Stays OutNvidia has powered to new all-time highs, reclaiming its title as the world’s most valuable
company. The move is being driven by a blend of AI-fuelled optimism and technical resilience.
AI spending is alive and well
After a rocky start to the year, Nvidia’s resurgence has been fuelled by a sharp rebound in
confidence across the AI ecosystem. At the company’s shareholder meeting, CEO Jensen Huang
painted a bullish long-term picture, calling the AI boom a multitrillion-dollar opportunity and
highlighting the rise of sovereign AI infrastructure around the world. That message landed well with
the market, especially after several big tech firms reaffirmed their commitment to AI investment
during earnings season.
Micron added fuel to the rally with a blowout earnings report, topping forecasts and issuing strong
guidance on AI-driven demand. Investors have also warmed to the idea that Nvidia’s grip on the AI
hardware stack remains firm, despite rumblings of competition. Cloud giants like Microsoft and
Amazon may want to build their own chips, but for now, the fastest and most scalable path still runs
through Nvidia.
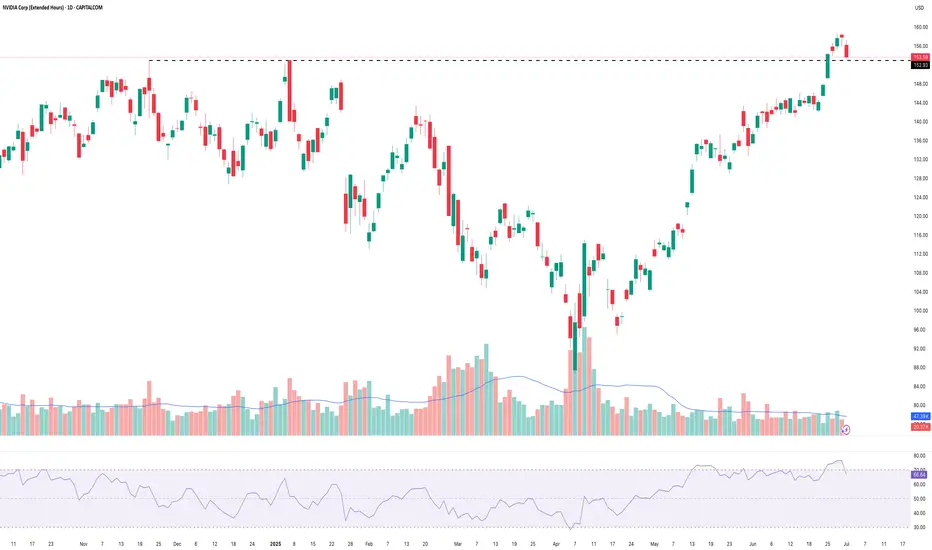
The price action tells its own story
They say the strongest stocks are the ones that bounce back quickly from bad news. Nvidia fits the
bill. After a nasty correction in Q1, triggered by China export restrictions and the DeepSeek
breakthrough, it would’ve been easy for sentiment to stay sour. Instead, since mid-April, the chart
has told a different story. The January gap has been closed, the stock has gone sideways to digest,
and now we’ve seen a clean breakout to fresh highs.
Volume was healthy on the move higher. Not euphoric, but solid enough to back the price action.
What matters now is follow-through. Traders will want to see Nvidia hold above the breakout zone,
and so far the early signs are promising. Price has now closed above the breakout for three sessions
in a row, increasing the probability that this isn’t a fake-out.
There’s also a clear ascending trendline in play, offering a reference point for future pullbacks
alongside the old horizontal resistance. The RSI is up at 76, but that’s no red flag here. Nvidia has
happily trended with the RSI in the 80s before, and momentum doesn’t tend to fizzle out just
because it’s technically overbought.
NVDA Daily Candle Chart
Past performance is not a reliable indicator of future results
Disclaimer: This is for information and learning purposes only. The information provided does not
constitute investment advice nor take into account the individual financial circumstances or
objectives of any investor. Any information that may be provided relating to past performance is not
a reliable indicator of future results or performance. Social media channels are not relevant for UK
residents.
Spread bets and CFDs are complex instruments and come with a high risk of losing money rapidly
due to leverage. 85.24% of retail investor accounts lose money when trading spread bets and
CFDs with this provider. You should consider whether you understand how spread bets and CFDs
work and whether you can afford to take the high risk of losing your money.
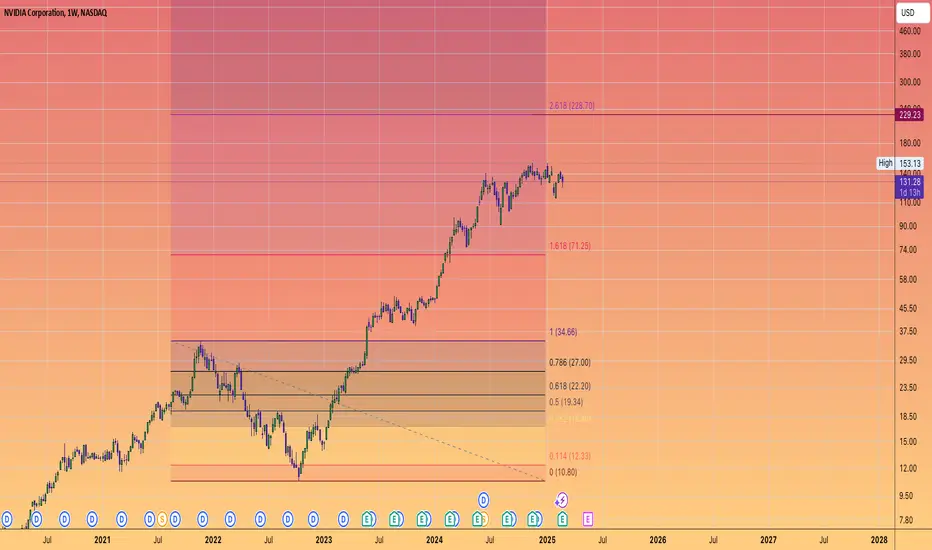
NVIDIA to $228If Nvidia were truly done for, why is it impossible to find their latest 5000 series GPUs?
Even if someone wanted to buy one, they simply can't.
The reason lies in Nvidia's commitment to fulfilling the soaring demand from AI data centers, which has left them unable to produce enough H100 and H200 models.
This situation also allows Nvidia to increase their profit margins significantly, capitalizing on the disparity between demand and the media frenzy surrounding them.
DeepSeek serves as a prime example of how out of touch mainstream media can be.
All DeepSeek did was replicate Chat GPT.
Training models requires substantial computing power. The panic surrounding Nvidia and other semiconductor companies is quite amusing; the demand for computing power is skyrocketing!
The gap between the reality of the AI mega-trend and the narrow focus of mainstream media is staggering! It's astonishingly out of touch! Just as out of touch as Cramer was when he declared META was done at $100, or when he thought Chat GPT would obliterate Google at $88.
Stock prices fluctuate between being overvalued and undervalued. While we have metrics like EGF and PE ratios to assess valuation, indicating that Nvidia is currently inexpensive, this doesn't guarantee it won't drop further. However, it is generally wiser to buy stocks when they are cheap rather than when they are costly.
The greater the deviation from the high then the greater the BUYING OPPORTUNITY being presented for the very best leading companies.
The key takeaway is that the deeper Nvidia falls during its corrections, the more advantageous it could be.
Those who are experiencing anxiety during these declines may find themselves selling at a loss, or for a marginal profit possibly around previous highs, while the stock has the potential to rise to $228 and beyond.
The potential for growth is significant; the $228 Fibonacci extension may not represent the peak. Attempting to predict a top for Nvidia could be misguided. Once it reaches $228, Nvidia might maintain a valuation similar to its current $130 level.
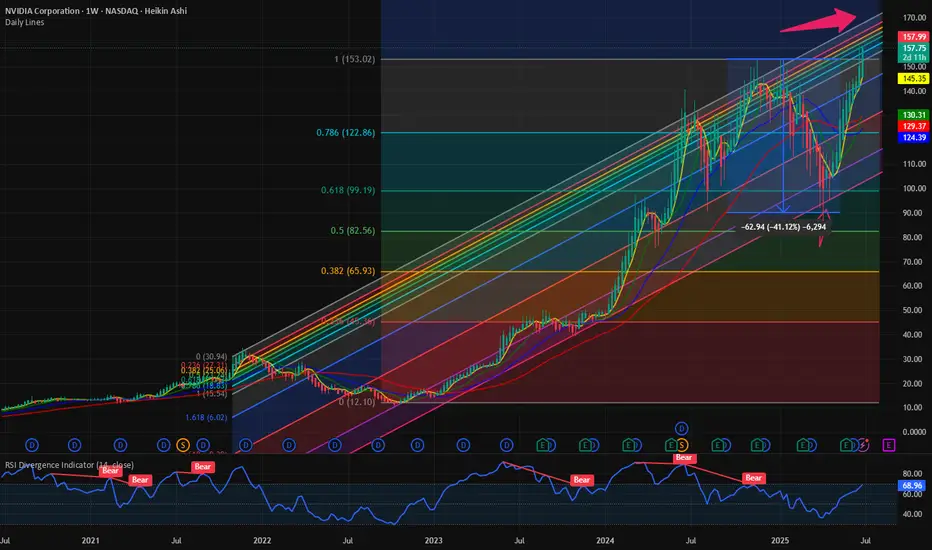
$NVDA: Levitating higher: Next Stop 175$: 250$ Before cycle endsIn this summer bull market, it makes more sense to talk about the large cap winners. NASDAQ:NVDA chart is a beauty to watch with the steady climb of this mega cap stock levitates all the indices including S&P500 and NASDAQ. After hitting 90$ during the Liberation Day drawdown the stock is 60% up since then and recovered all its losses and hitting a new ATH. With stock at 158 $ it is targeting the highs of the upward sloping Fib Retracement channel which indicates that stock can reach a price of 175$ before this run loses its steam. At RSI of 65 this is not overbought compared to its historical level of 84. Hence there might be more room left in this bull run for $NVDA. My prediction is that before end of July 2025 the stock hits 175$.
But where do we like to see this outperforming stock during this cycle of bull run. Will it hit 5T USD before Dec 2024? If NASDAQ:NVDA hits 5T USD, then the stock will be 205 $ which in my opinion not impossible before Dec 2025. 40% Upside in the Market Cap and the stock price is achievable in a momentum stock like $NVDA.
Verdict: NASDAQ:NVDA @ 175 $ before July 2025 & 205 $ or 5 T USD Market Cap before Dec 2025
$NVDA Tradespoon – Long Entry $152.62Tradespoon model generated long signal for NASDAQ:NVDA . Predicted range: $152.62–$158.22. Trend: -0.22%. NASDAQ:NVDA
Nvidia Key Resistance Test—Will $157.75 Trigger Rally? Current Price: $157.75
Direction: LONG
Targets:
- T1 = $161.80
- T2 = $169.50
Stop Levels:
- S1 = $155.25
- S2 = $150.75
**Wisdom of Professional Traders:**
This analysis synthesizes insights from thousands of professional traders and market experts, leveraging collective intelligence to identify high-probability trade setups. The wisdom of crowds principle suggests that aggregated market perspectives from experienced professionals often outperform individual forecasts, reducing cognitive biases and highlighting consensus opportunities in Nvidia.
**Key Insights:**
Nvidia remains a market leader in technology, benefiting from its dominance in artificial intelligence processing units and a growing demand for critical computing infrastructure. Traders widely recognize Nvidia's ability to capitalize on high-margin opportunities in the AI space and data-center expansion. Recently, bullish momentum patterns supported a breakout forecast, with expert price models suggesting that Nvidia will likely attempt key resistance zones before pushing higher.
However, challenges such as supply-chain constraints for semiconductor chips and broader sector overbought conditions might lead to intermittent retracements. Nvidia's historical resilience in tight cycles offers optimism, with analysts signaling growth opportunities as new catalysts emerge from both technical and fundamental perspectives.
**Recent Performance:**
Nvidia's stock performance has demonstrated volatility but remains strong year-to-date, driven by widespread adoption of AI technologies and strategic investments in autonomous systems, gaming advancements, and supercomputing infrastructure. Price action displays resilience near support levels and hints at a continuation of bullish trends. The stock recently formed a golden cross—a bullish technical indicator where the 50-day moving average crosses above the 200-day moving average—highlighting potential upside targets.
**Expert Analysis:**
Market professionals remain optimistic, projecting favorable long-term growth across Nvidia's highly profitable product lines. AI is expected to fuel enterprise solutions growth, with supercomputing initiatives providing durable momentum opportunities. Analysts also point out Nvidia's active partnerships with world-leading enterprises, including in sectors like autonomous vehicles, gaming, and cloud computing. Despite optimistic forecasts, traders should monitor overbought conditions and sector-wide supply bottlenecks before aggressively scaling positions. Resistance levels near $160 could spark consolidation, offering better entry points for subsequent moves higher.
**News Impact:**
Recent developments reinforce Nvidia's strategic positioning, including massive investments in AI-driven innovations and global partnerships. New product announcements and collaborative ventures with big tech players have amplified Nvidia's stock sentiment in expert circles. Yet, industry-wide chip shortages and macroeconomic concerns persist, potentially hampering rapid price acceleration. Positive earnings surprises or key news events in the coming quarter may further support a bullish case for Nvidia, validating its resilience as a top-tier growth stock.
**Trading Recommendation:**
Given Nvidia's sustained strength, coupled with bullish technical formations, a long position appears justified for traders seeking upside exposure. Current price action suggests well-supported price continuity amid investor enthusiasm for AI and supercomputing growth. Primary resistance levels at $161 and second-tier targets near $169 offer traders strong profit-taking junctures. Stop-loss levels below $155 safeguard against potential sector-wide retracements, ensuring disciplined risk management to preserve capital while leveraging Nvidia’s growth trajectory.
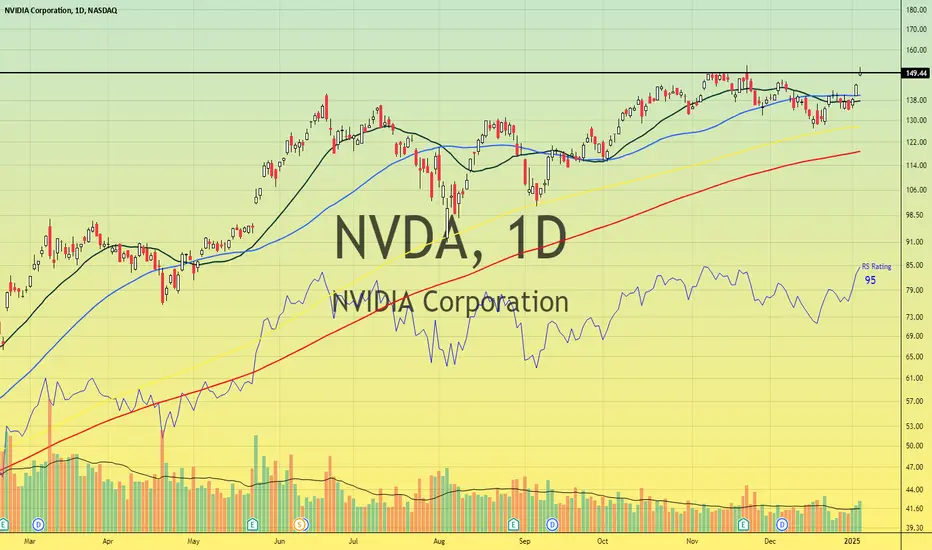
The King Roars AgainRS Rating of 95
Breaking out of key pivotal zone
Wall of Buyers displaying institution appetite
RTX 5000 Series debuted at a very friendly consumer price
Looking forward shows no signs of decelerating growth prospects for the Wall Street darling
I have reasons to believe this security price can increase in value
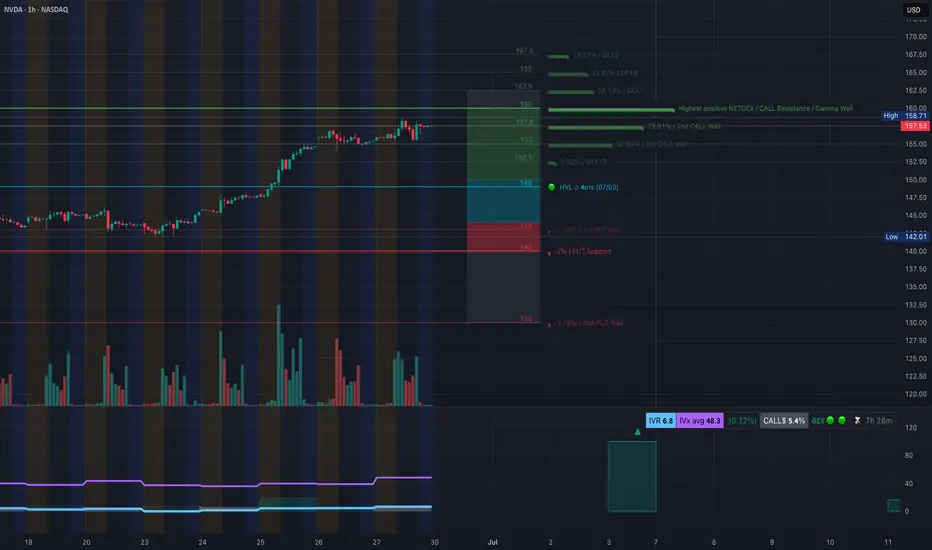
NVDA at Inflection Point: Reclaim $158 or Fade to $150?NVDA at Inflection Point: Reclaim $158 or Fade to $150? Monday Setup Ready 📉📈
🧠 GEX-Based Options Sentiment:
— The $158.71 level is the highest positive GEX zone and aligns with the 2nd CALL Wall. This is the strongest gamma resistance — the level to beat.
— $157.50 is the 3rd CALL Wall (7.99% GEX) and has acted as a ceiling — NVDA is currently pinned underneath.
— Below, $152.50 to $150 forms a GEX magnet zone, where price is likely to gravitate if weakness sets in.
— The $149 HVL zone also aligns with this gamma pocket, making it a strong downside target.
— Implied Volatility Rank (IVR) is very low at 6.8, which makes options cheap — ideal for buying directional calls or puts.
— Call flow shows a moderate bullish lean (5.4%), but nothing extreme. No signs of a major squeeze — yet.
🔧 Options Setup for Monday–Wednesday:
Bullish Trade Idea:
If NVDA breaks and holds above $158, consider buying a CALL debit spread, such as 158c/165c expiring July 3 or July 5.
Target zones would be $160 and $165 based on GEX7 and GEX6.
Stop-loss would be a move back under $157, especially on rising volume.
Bearish Trade Idea:
If NVDA fails to reclaim $157 and breaks below $155, consider a PUT or a PUT debit spread. 155p to 150p (Jul 3 expiry) would be the play.
First target is $152.50, followed by $149.
Stop if price recovers $157.50 with strong bid.
📉 Intraday Technical Breakdown (1H Chart):
The structure shows clear signs of weakening strength.
— NVDA had a confirmed BOS, but now it’s printing a CHoCH just under the trendline and inside a supply zone.
— Price rejected multiple times near $158.
— Volume spiked into the Friday close but did not confirm breakout — more likely to be profit-taking or gamma hedging.
— The short-term trendline has been broken, and bulls are defending the structure weakly.
📌 Key Intraday Levels to Watch:
— $158.71: Gamma ceiling and major supply zone. Break above this can lead to a squeeze.
— $157.00: Local resistance from Friday.
— $155.02: BOS level and key decision point.
— $152.50–150.00: Gamma magnet and thin volume shelf — likely destination if price breaks.
— $149.00: HVL zone and major demand.
✅ Thoughts and Game Plan:
NVDA looks vulnerable to a fade if bulls fail to reclaim $158 early in the session. It has rallied sharply the past week and is now stalling beneath gamma resistance. The CHoCH under trendline shows supply defending. If Monday opens flat or slightly weak and price stays under $157.50, I expect bears to press it toward $152.50 quickly, maybe even $149 by midweek.
But if buyers step up and push a reclaim above $158.71, the next gamma wall is at $160–$165 — that’s where a breakout can accelerate. In that case, the IV being cheap favors buying calls.
Be patient and don’t front-run Monday open. Let price confirm. The best edge here comes from reacting to the key levels — not guessing them.
Disclaimer:
This analysis is for educational purposes only and is not financial advice. Always do your own research, trade your plan, and manage risk accordingly.
How will NVDA react to the meeting between Canada and USA?Possible Upsides for NVIDIA
Pricing Power & Revenue Buffer
-If Canadian-sourced semiconductors face tariffs, NVIDIA could raise prices across its product line to cover margin impacts—shifting cost to customers.
Accelerated Supply Chain Shifts
-The threat (or reality) of disruptions can drive companies to prioritize U.S. or Taiwan-based supplies, where NVIDIA is deeply integrated, potentially shortening delivery cycles.
Competitive Advantage
-Rivals relying on affected Canadian inputs might see delays or cost increases—NVIDIA could gain market share in both AI datacenter and auto/industrial segments.
Risks & Downsides
Higher Costs for Hardware Buyers
-If tariffs increase the cost of critical components like chips or memory, end-users might delay purchases, potentially reducing NVDA’s sales volume.
Spillover Sentiment Hit on Tech Stocks
-Trade wars often cause broad tech stock sell-offs. As a high-growth leader, NVDA could see increased volatility, even if its business remains strong.
-Disclaimer: This analysis is for informational and educational purposes only and does not constitute financial advice, investment recommendation, or an offer to buy or sell any securities. Stock prices, valuations, and performance metrics are subject to change and may be outdated. Always conduct your own due diligence and consult with a licensed financial advisor before making investment decisions. The information presented may contain inaccuracies and should not be solely relied upon for financial decisions. I am not personally liable for your own losses, this is not financial advise.
NVIDIA"It’s clear that this stock is currently in a strong upward wave and could advance toward wave 5 of 3, targeting the $1,090–$1,350 range. After reaching this zone, it may enter a corrective phase as wave 4, which could bring a pullback to the $150–$250 range. Following that, the stock is expected to resume its main wave 5 rally, with targets between $5,000 and $7,200."

NVIDIA(NVDA) Jackpot – Thief Trading Blueprint for Fast Profits!🚀 NVDA Stock Heist: The Ultimate AI Gold Rush (Scalping/Day Trade Plan)
🌟 Hey there, Market Pirates! 🏴☠️💰
Thieves, Traders, and Money Makers—gather around! Based on the 🔥Thief Trading Style🔥, here’s our master blueprint to loot NVIDIA’s AI-fueled rally. Follow the strategy on the chart—long entry is LIVE! Our escape? Near the high-risk Resistance Zone. Overbought? Consolidation? Reversal trap? Bears are lurking, but we’re stealing profits first! 🎯💸
🎯 Entry (The Vault is Open!)
"Swipe the AI gold at any price—the heist is ON!"
Pro Tip: Use buy limits within 15-30min near swing lows/highs for pullback entries.
🛑 Stop Loss (Thief’s Escape Route)
SL at recent swing low (4H timeframe)—adjust based on your risk & lot size.
Scalpers/Day Traders: Tighten SL if stacking multiple orders.
🏆 Target 🎯: 165.00 (The AI Jackpot!)
📈 Why NVDA?
Bullish momentum from AI dominance, earnings hype, and institutional FOMO.
Tech sector strength + chip demand = THIEF’S PARADISE.
📰 Fundamental Heist Intel
Need macro trends, sentiment, and intermarket analysis? 🔗 Check our bioo for the full robbery toolkit.
⚠️ Trading Alert: News & Position Control
Avoid new trades during earnings/news—volatility kills heists!
Trailing SLs = Locked profits. Don’t get greedy!
💥 Boost This Heist!
👊 Hit "Like" & "Boost" to fuel our next raid. Every click = More stolen profits! 🚀💰
🤑 Stay tuned—more heists coming! NVIDIA today… what’s next? 🤫🐱👤

NVIDIA NVIDIA has tapped the target we setup few weeks ago, now we are waiting for the pullback.
Disclosure: We are part of Trade Nation's Influencer program and receive a monthly fee for using their TradingView charts in our analysis.
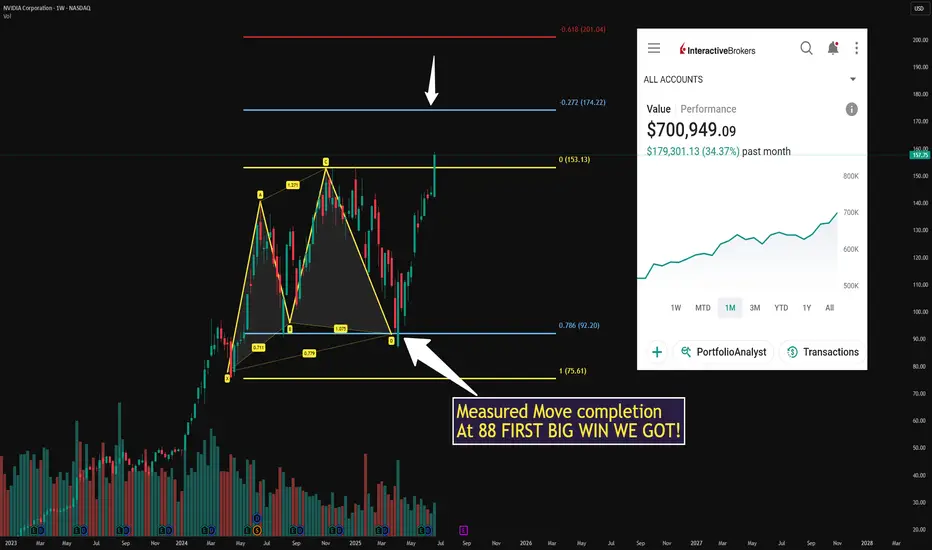
$NVDA ONCE IN A LIFETIME RARE Fibonacci HARMONICSNASDAQ:NVDA ONCE IN A LIFETIME RARE Fibonacci HARMONICS
NVDA is the NEW Fibonacci King the completion of the CYPHER was at 88 were I went long!
My Target is now 174 🎯up 200 grand on my account
I will ALERT here on the NEXT PLAY LOW RISK setup (NO CHARGE)
All I ask is DROP A 👍
Long Probably!Hello All. because of No Pre-Cluster, market will reverse on the Node on versa Cluster. be happy(wink)