NVIDIA CORP stock forum
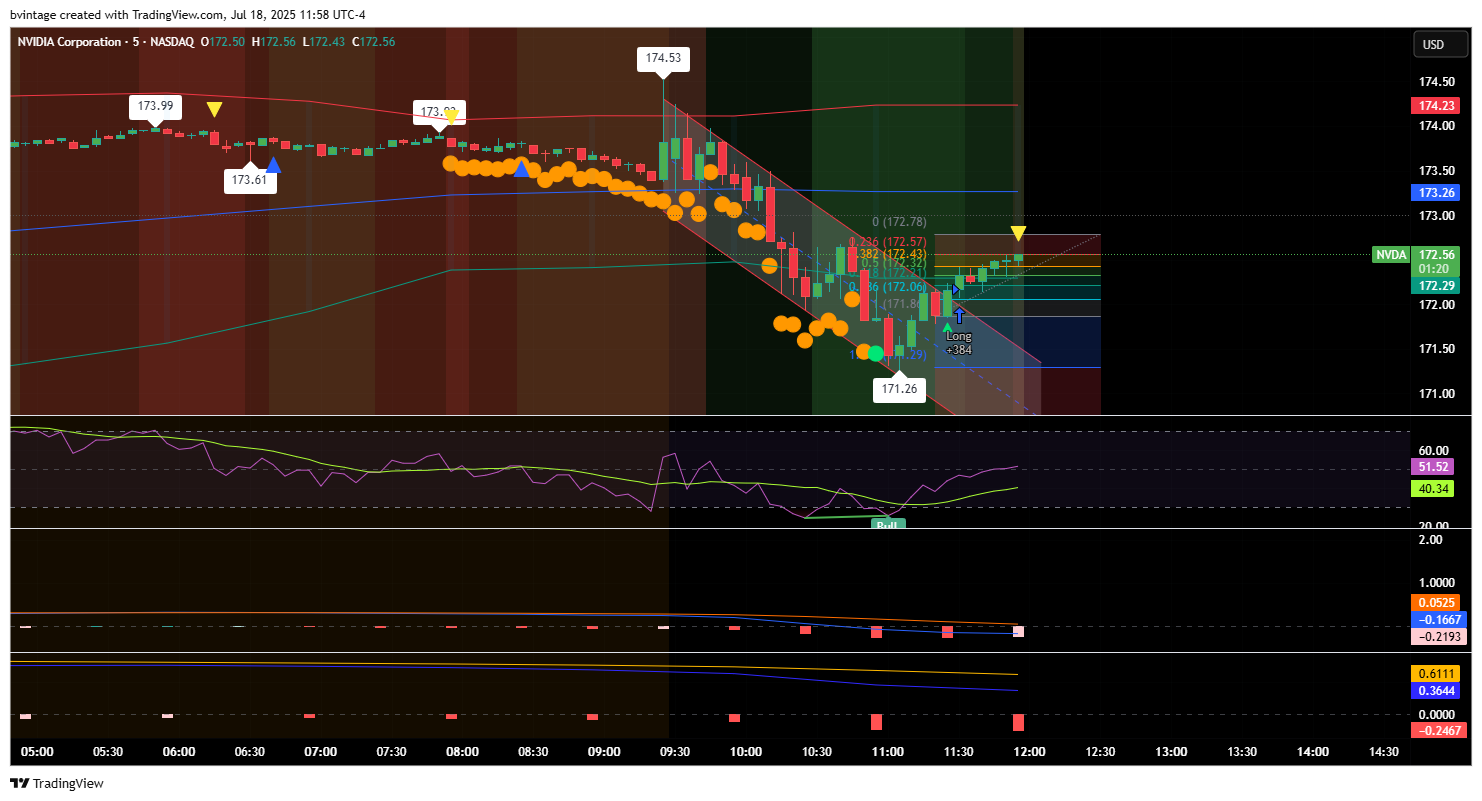
✅ Bullish Divergence Detected:
Price makes a lower low (around $171.86).
RSI makes a higher low → Classic Bullish Divergence.
"Bull" label confirms divergence is detected.
🧮 Step 1: Identify the Range for the Move
Swing Low (bullish divergence low): $171.86
Nearest Swing High Before Drop: $174.53
Height of Move: $174.53 − $171.86 = $2.67
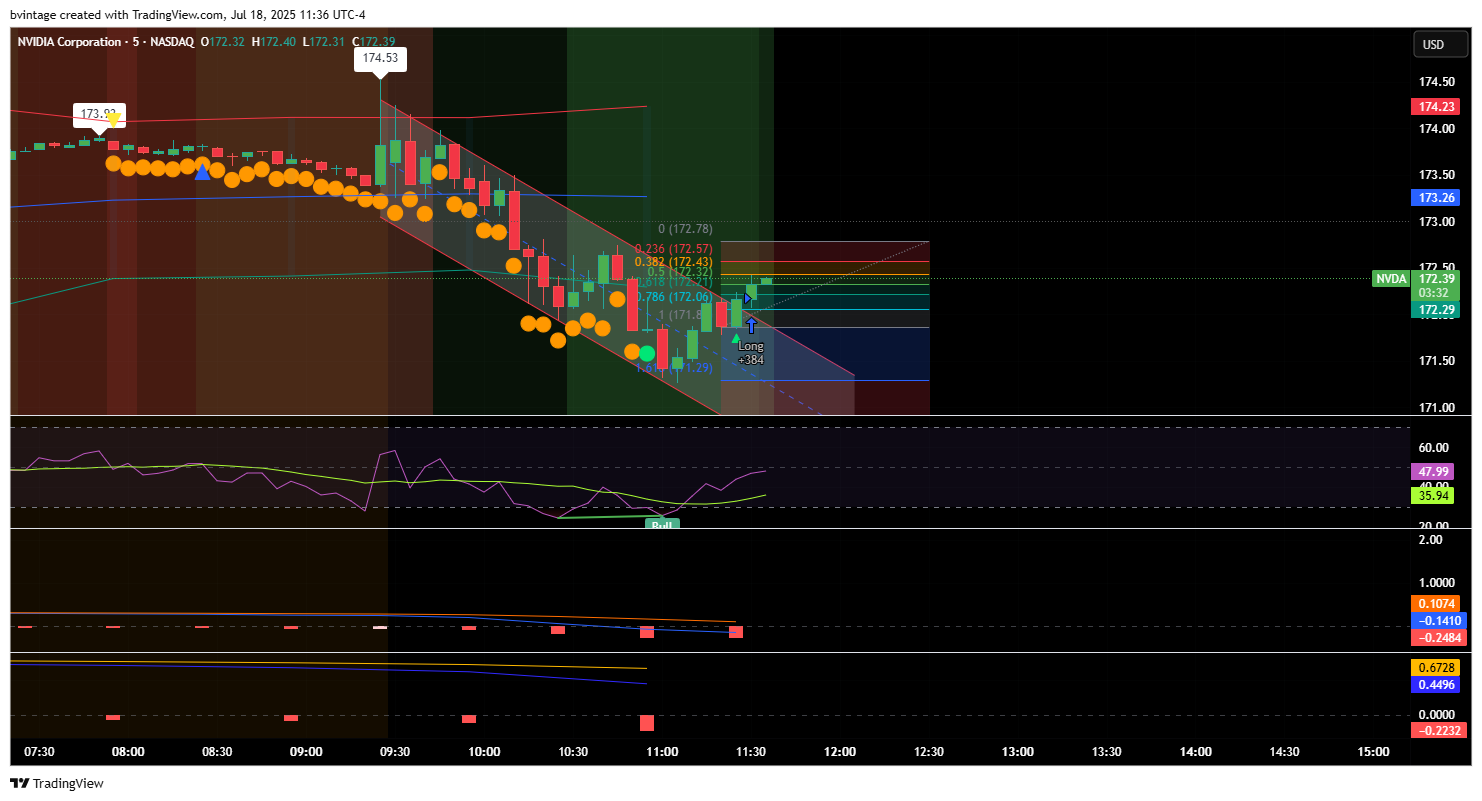
📈 Step 2: Project Upward Targets
🔹 Fibonacci Extension Targets (from low $171.86):
Extension Level Target Price
1.0x (Full move) $174.53
1.618x $176.82
2.618x $179.50 (approx.)
3.618x $182.18 (approx.)
These are shown in your chart via Fibonacci box:
You can already see 2.618 at $170.37 and higher levels above $174.53 too, if your tool was anchored higher.
✅ Conservative Bullish Targets:
If entering near $172.33:
Target Type Price
First Target (VWAP) $173.26
Full Recovery $174.53
1.618 Fib Target $176.82