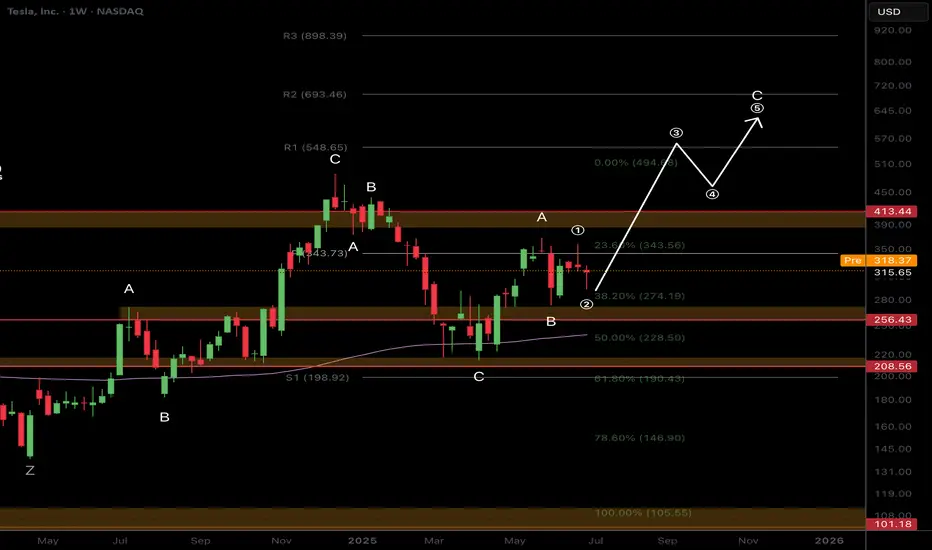
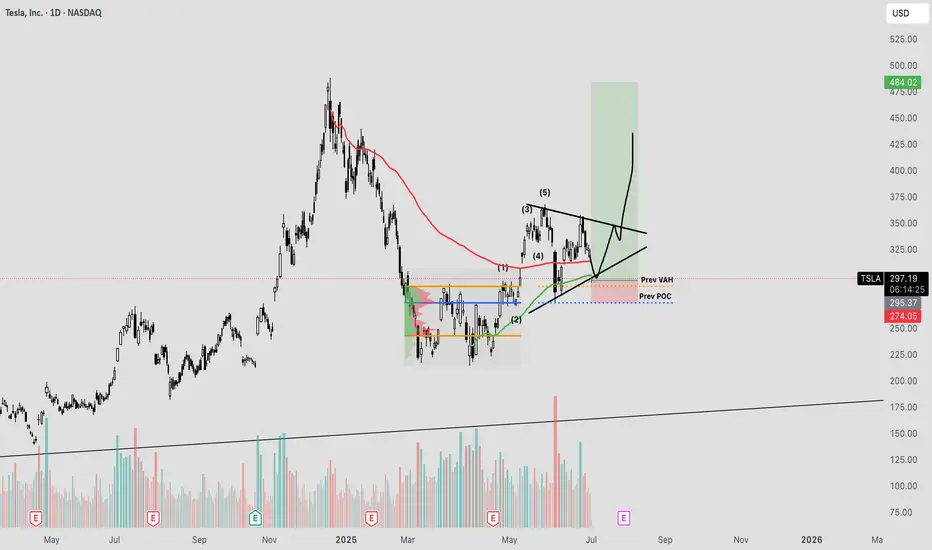
$TSLA Time to Fade or..?NASDAQ:TSLA (like NASDAQ:GOOG ) is standing out to me as bullish, yet, corrective Elliot Waves a higher degree series of ABCs appear to be underway.
A final wave C appears to be underway which would take price too all time highs in an expanded flat correction pattern. My count could be wrong and the interference could be from the increase it sentiment volatility connected to the US headlines lately and Trump posting on socials. Things may get back to normal after the summer and a clearer pattern may emerge.
Price is struggling to get past the weekly pivot point bullishly or the weekly 200EMS bearishly and is trapped within that range.
For now long term target is the R2 daily pivot at $693 as the higher probability is continued upside
Safe trading
TSLACO trade ideas
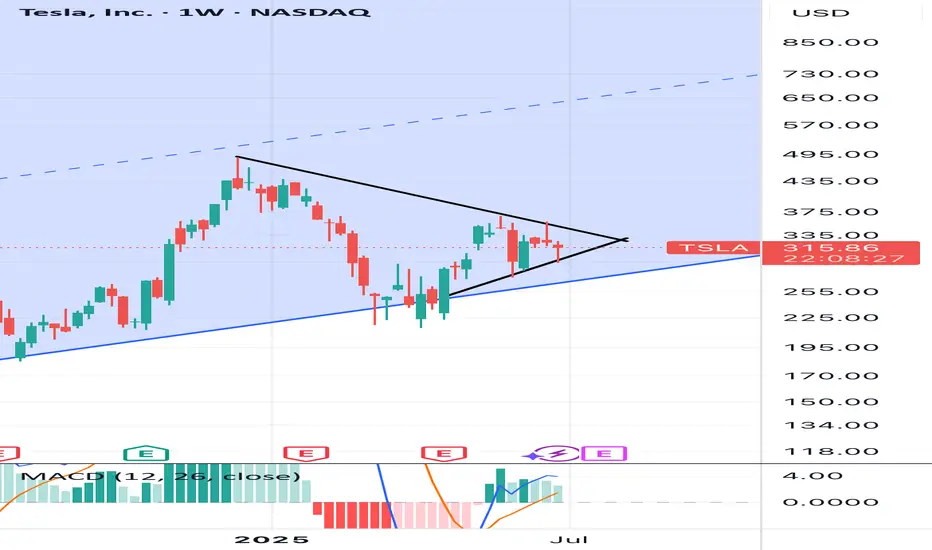
Tesla - This bullish break and retest!Tesla - NASDAQ:TSLA - confirmed the bullish reversal:
(click chart above to see the in depth analysis👆🏻)
Tesla recently created a very bullish break and retest. Therefore together with the monthly bullish price action, the recent rally was totally expected. But despite the short term volatility, Tesla remains bullish, is heading higher and will soon create new highs.
Levels to watch: $400
Keep your long term vision!
Philip (BasicTrading)

Big fat cup & handle on the weekly My instinct tells me today was the last dip buying opportunity before parabolic move. The daily chart is showing wedge consolidation and big institutions are buying. Elon just needs to focus
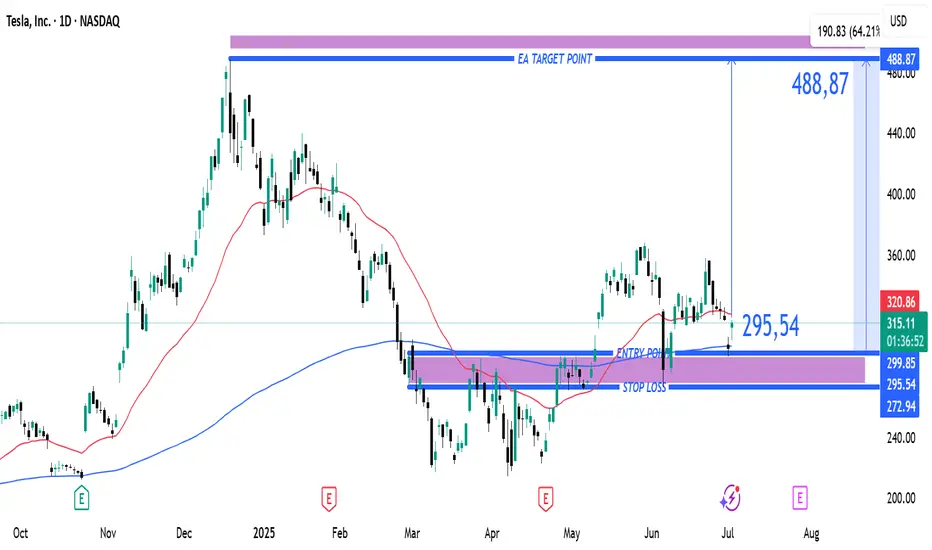
Tesla Bullish Breakout Setup: Entry at $295.54 Targeting $488.87Entry Point (Buy Zone): Around $295.54
Stop Loss: Between $272.94 – $295.54 (lower purple support zone)
Target (TP): $488.87
Current Price: $315.33 (as of the latest candle)
📈 Strategy Summary:
Setup Type: Long (Buy)
Risk-Reward Setup:
Reward: ~$193.33 per share (from $295.54 to $488.87)
Risk: ~$22.60 per share (from $295.54 to $272.94)
Reward:Risk Ratio ≈ 8.6:1 — a high potential payoff if the trade works out.
📊 Technical Context:
Support Zone: Price recently bounced off the support region (marked in purple).
Moving Averages:
Red Line (Short-Term MA): Price just crossed back above.
Blue Line (Long-Term MA): Price reclaimed this level — bullish signal.
Price Action: After a corrective phase, a possible reversal is forming at support, confirming bullish interest.
✅ Bullish Signals:
Bounce from support zone with a strong bullish candle.
Price closing above the 200-day MA (bullish trend resumption).
High reward-to-risk trade setup with clear stop loss.
⚠️ Considerations:
Confirmation with volume or a second bullish candle would add confidence.
Watch for earnings or macro events that could disrupt the trend.
Tight stop is essential to avoid drawdowns if the setup fails.
🔚 Conclusion
This is a well-structured long setup with a high potential reward. If price maintains above the entry zone and breaks recent highs, a push toward the $488.87 target is plausible.
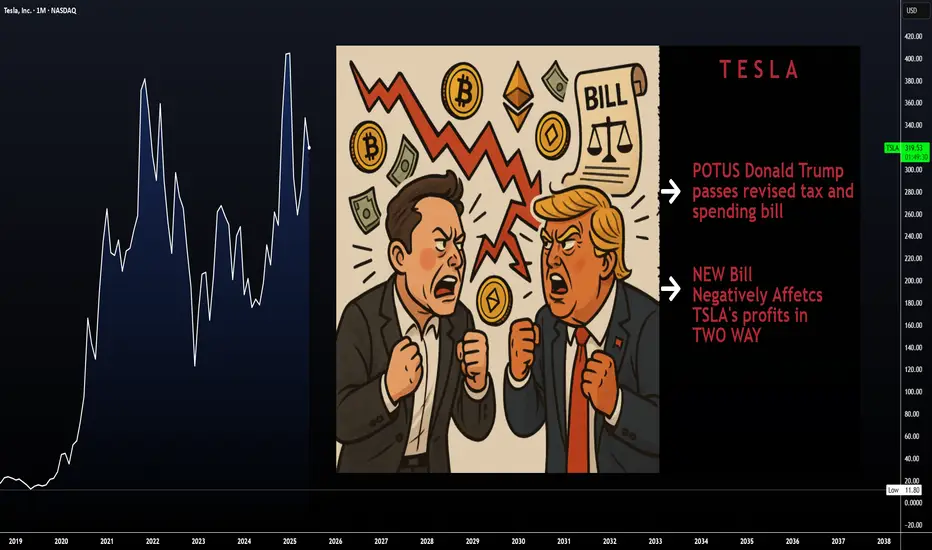
MUSK on TRUMP's Bill | "outrageous, disgusting abomination"Elon Musk’s sided against the latest Trump-backed tax-and-spending package, in a plot twist between the recent partners turned enemies.
Musk called the legislation a “massive, outrageous, pork-filled Congressional spending bill” and a “disgusting abomination,” publicly shaming senators and representatives who backed it.
With such a strong opinion against it one may wonder, is this going to negatively affect Tesla?
Together with this strong reaction, the price has already been trading lower for the past few days.
The administration has defended it as the “One Big Beautiful Bill,” insisting it will stimulate growth, even though Elon Musk warned the bill would swell the U.S. budget deficit by roughly $2.3–2.5 trillion over the next decade, calling the added debt “crushingly unsustainable”.
When I first read this, it made me think of Tesla's long generated “green credits”, which in 2024 alone, brought in roughly $2.76 billion. “green credits” (officially, zero-emission or regulatory credits) work by building more clean vehicles than required and selling the excess allowances to other automakers that need them to comply with emissions mandates.
Now I'm no expert on US policy, and so I roped in GPT to help me explain how this new bill implicates TESLA's profit:
Under the Senate’s “big, beautiful” tax-and-spending bill, Tesla’s regulatory-credit business faces two assaults:
❗ Repeal of CAFE- and ZEV-mandates
The bill would eliminate penalties for automakers missing Corporate Average Fuel Economy targets and roll back zero-emission vehicle mandates that currently force legacy manufacturers to buy credits if they fall short. Remove those penalties and mandates, and there’s no structural need for credits—undercutting the very market that funds Tesla’s $2–3 billion-a-year credit-sales business
❗ End of consumer EV tax incentives
By phasing out the $7,500 new-EV credit (and the $4,000 used-EV credit) within months of enactment, the bill dampens U.S. EV demand overall. A smaller EV market means fewer opportunities for Tesla to leverage fleet-wide ZEV regulations against higher-emitting rivals—further squeezing credit prices and volume
Bottom line: Without CAFE/ZEV obligations and with EV purchase subsidies gone, Tesla’s “green-credit” line—a major profit driver in recent quarters—would likely collapse, removing a key buffer against manufacturing and pricing pressures.
This could be the beginning of a bear market for Tesla lasting throughout the rest of the Trump administration.
________________________
NASDAQ:TSLA
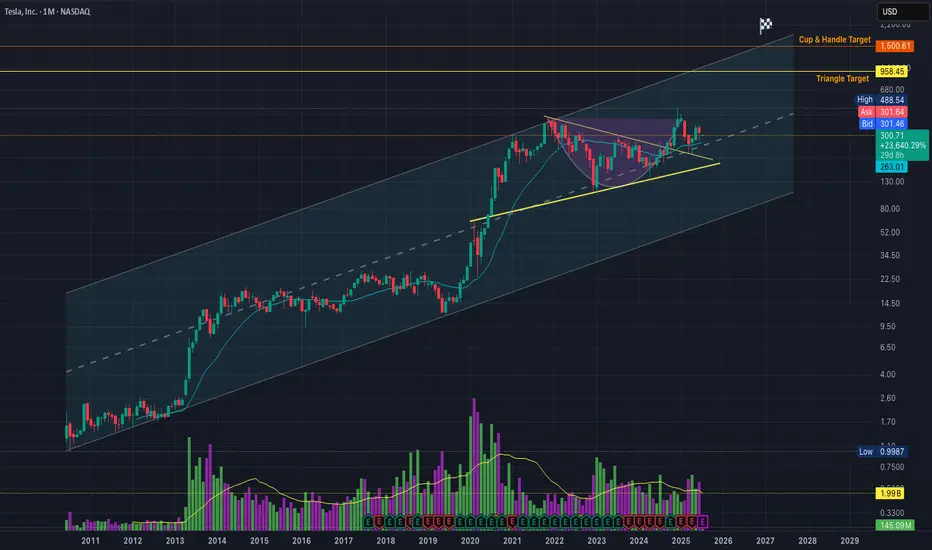
Adam & Eve on the Chart:Will They Bless Us with a $1,500 MiracleI don’t have much to say — it’s pretty straightforward.
We’ve got two potential structures on the chart:
✅ First, the symmetrical triangle that already broke out, aiming for a target around $958 to $1,000.
✅ Then we’ve got the “Adam & Eve” structure (gotta flex sometimes 😎), see it as a cup & handle pattern, aiming for a crazy $1,500 target. This one hasn’t broken out yet — but if the first triangle breakout plays out fully, it basically sets the stage for this one to break out too.
Some quick facts:
The bounce zone around ~$245 is a huge multi-timeframe confluence level.
Volume profile support is literally chilling right at $245.
Multiple moving averages are backing this move, even on lower timeframes than the "1M"
Triangle retest? Check.
0.786 fib support? Check.
(And to name a few)
Overall, the chart looks Fine to me.
Negative news might affect the short term, but the trend should stay intact.
Unless the macro changes.
That's it, that's the idea" - Good night !
Musk-Trump Feud Sends Tesla (TSLA) Shares DownRenewed Feud Between Musk and Trump Drags Tesla (TSLA) Share Price Lower
The US Senate yesterday narrowly approved Trump’s so-called “big, beautiful budget bill.”
Elon Musk, who had previously criticised the bill for potentially adding $3.3 trillion to the national debt, warned that Republican lawmakers who supported it would face political consequences. In a post on X, Musk wrote:
“Every member of Congress who campaigned on reducing government spending and then immediately voted for the biggest debt increase in history should hang their head in shame! And they will lose their primary next year if it is the last thing I do on this Earth.”
He also reiterated his intention to establish a third political force under the name “America Party.”
In response, President Trump issued sharp threats:
→ to apply federal pressure on Musk’s companies by revisiting existing subsidies and government contracts (estimated by The Washington Post at $38 billion);
→ to deport Musk back to South Africa.
The market responded immediately to this renewed escalation in the Trump–Musk conflict. Tesla (TSLA) shares fell by over 5% yesterday, forming a significant bearish gap.
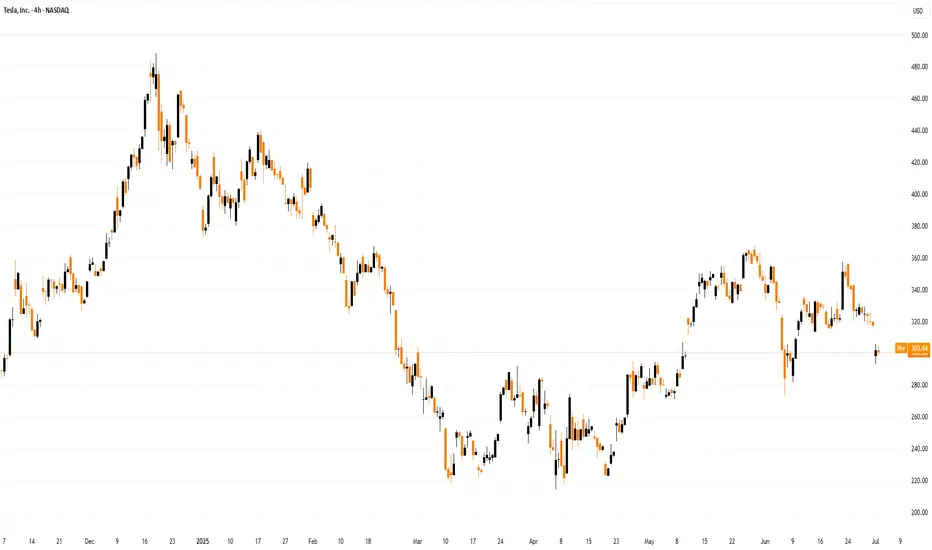
Technical Analysis of TSLA Stock Chart
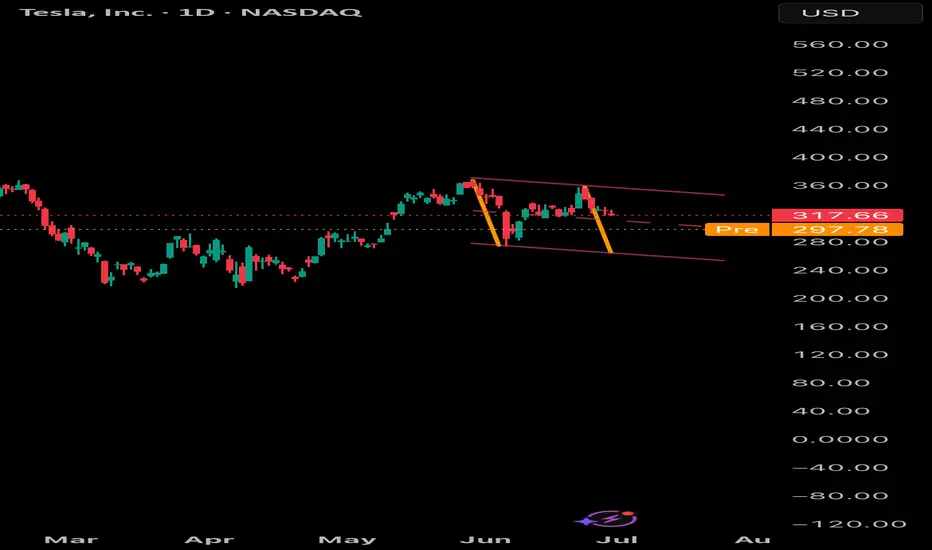
Eight days ago, we analysed the TSLA price chart, continuing to observe price action within the context of an ascending channel (indicated in blue). At that point:
→ In mid-June, when the initial Musk–Trump tensions surfaced, TSLA managed to hold within the channel. However, as of yesterday, the price broke below the lower boundary, casting doubt on the sustainability of the uptrend that had been in place since March–April;
→ The price breached the lower channel limit near the $315 level — a zone that previously acted as support. This suggests that $315 may now serve as a resistance level.
As a result, optimism related to the late-June launch of Tesla’s robotaxi initiative has been eclipsed by concerns that the Musk–Trump confrontation may have broader implications.
If the former allies refrain from further escalation, TSLA may consolidate into a broadening contracting triangle (its upper boundary marked in red) in the near term, ahead of Tesla’s Q2 earnings release scheduled for 29 July.
This article represents the opinion of the Companies operating under the FXOpen brand only. It is not to be construed as an offer, solicitation, or recommendation with respect to products and services provided by the Companies operating under the FXOpen brand, nor is it to be considered financial advice.
Better MACDWhat is the MACD?
The MACD (Moving Average Convergence Divergence) is a momentum and trend-following indicator. It’s based on the difference between two EMAs (Exponential Moving Averages) and helps spot:
Trend direction
Momentum shifts
Reversals
Entry/exit points
✅ Basic MACD Techniques
1. Signal Line Crossovers
Bullish Crossover: MACD line crosses above Signal → buy signal
Bearish Crossover: MACD line crosses below Signal → sell signal
🔸 Works best in trending environments, 200 SMA as a filter.
🔸 Combine with volume or trend filters for best results
2. Zero Line Crossovers
When MACD crosses above 0, the shorter EMA is above the longer EMA → bullish. This is typically the sign of a larger trend than crossovers.
When MACD crosses below 0, shorter EMA is below → bearish
🔸 Zero line = baseline momentum direction
🔸 Cross above = bullish trend confirmation
🔸 Cross below = bearish confirmation
3. Histogram Momentum
The histogram is often the first sign of a shift before a crossover happens.
Read it like this:
Histogram growing: Increasing momentum in that direction
Histogram shrinking: Momentum is fading
Histogram changing color (in many indicators): Potential reversal
🔸 Use histograms to get early signals, even before crossovers. Confirmed with volume surge and Price Action.
🔍 Advanced MACD Tricks
📉 4. Divergence Detection
Divergence occurs when price and MACD move in opposite directions.
🔸 Bullish Divergence:
Price makes lower lows
MACD makes higher lows
→ Hidden buying pressure, trend reversal likely
🔸 Bearish Divergence:
Price makes higher highs
MACD makes lower highs
→ Trend weakening, reversal likely
🔹 Confirm with:
RSI, when the lower timeframe RSI is oversold and the higher timeframe MACD is rising, then it's a good sign, and the opposite is true for bears.
Support/resistance zone: draw trendlines either on the volume or price and watch out for retests on the breakout.
Candlestick reversal patterns: some bearish patterns are bullish on indexes because of dollar cost averaging.

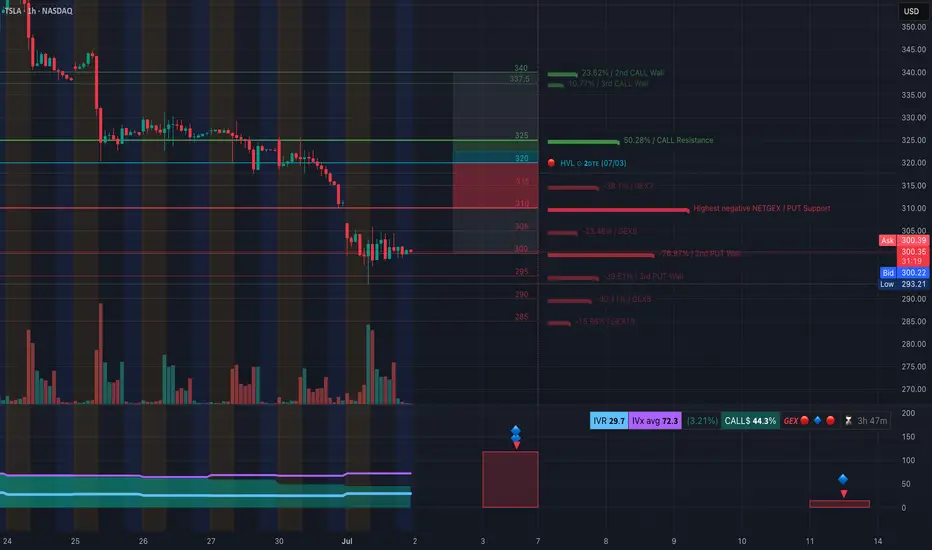
TSLA at the Edge of Breakdown? Here’s the Options PlayGEX-Based Option Strategy Insight:
TSLA’s GEX landscape reveals heavy negative Gamma Exposure lurking below $305. That’s a red flag — dealers are likely to short more as price falls, amplifying downside. The highest negative NET GEX zone sits around $310–315, right near the current price, indicating a major PUT support zone — if broken, could trigger a volatility spike.
* PUT Walls: Stack up at $310, $300, $295, with max pain potential down to $285–290.
* Call Walls: Far above at $325/337.5/340 — little gamma resistance above, but TSLA would need a strong reversal to challenge those.
📌 Options Sentiment:
* IVR is 29.7 (lowish), IVx avg is 72.3 → options pricing isn’t cheap anymore.
* Calls 44.3% vs Puts 55.7% → leaning bearish.
* GEX suggests downside acceleration under $300.
➡️ Trade Idea (GEX View):
If $300 fails, consider buying 295 or 290 PUTs (weekly or next week expiry).
Target $285–290 zone for exit.
Above $310 = exit.
1-Hour Chart Technical Setup (2nd image):
TSLA has been in a clear downtrend, marked by:
* Break of Structure (BOS) followed by lower lows.
* Price is hovering inside a potential accumulation zone, but has shown no bullish confirmation yet.
* Volume is weak, and we are still sitting under a steep downtrend resistance line.
📉 Bearish Play:
* Break below $300 = confirmation of continuation.
* Entry: $299.50–300.00
* Target: $293.21 > $290 > $285
* Stop: Close above $305 (tight).
📈 Bullish Risk:
* Only valid if price breaks $310 and flips the BOS area at $317.
* This could trigger a squeeze toward $320/325, but that’s lower probability for now.
Final Thoughts:
Until we reclaim $310+, TSLA leans heavy. GEX confirms dealer pressure below $300. Use tight stops and don’t chase — volatility will increase fast on a breakdown.
Disclaimer: This is not financial advice. Trade at your own risk and always confirm your thesis.
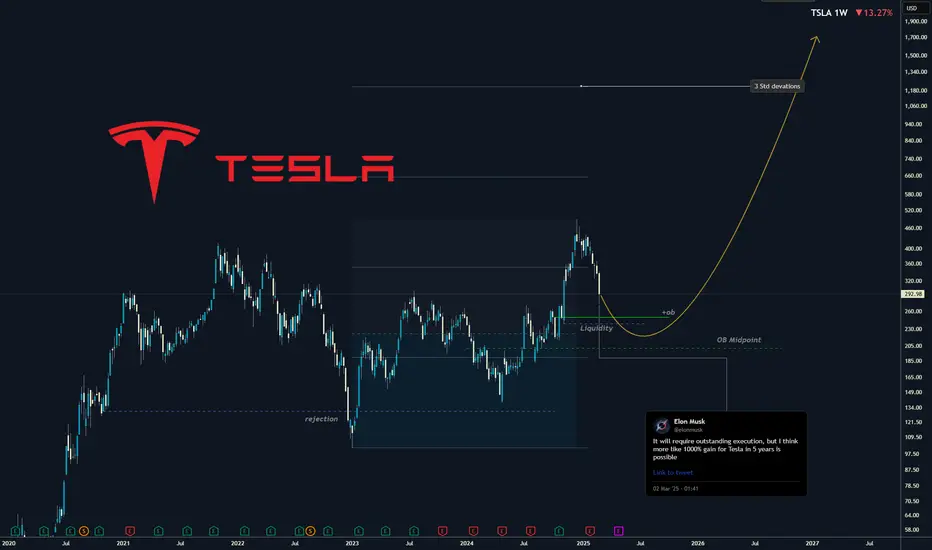
TESLA I Its not only EV Cars. Elon Musk predicting 1000% growthThis is not a short-term trade as you know from me on FX, Crypto and Indices. This is buy and hold investment. I got already good bag of share and Im still adding without trying to time if perfectly, but now I think its time to buy bigger positions.
Tesla is my 3rd biggest position after the Bitcoin and Strategy (MicroStrategy). Many people see it only as an EV cars company, but it's not all what they do, just read bellow to see why I see a huge potential in this company.
📍 Why Tesla is Considered a Top Investment
Tesla stands out as a leading player in the EV market, with a strong brand and a history of delivering innovative products. In 2024, it produced about 459,000 vehicles and delivered over 495,000 in the fourth quarter alone, showcasing its ability to meet growing demand Tesla Fourth Quarter 2024 Production, Deliveries & Deployments.
💾Financially, Tesla reported $97,690 million in total revenue for 2024, with the automotive segment contributing $87,604 million and energy solutions adding $10,086 million Tesla, Inc. Annual Report on Form 10-K for 2024. This diversification into energy, alongside investments in autonomous driving, positions Tesla for long-term growth, making it attractive for investors seeking exposure to future trends in sustainability and technology.
📍 What Tesla Does Beyond EV Cars
Beyond EVs, Tesla is deeply involved in energy solutions:
📍 Solar Products: Offers solar panels and solar roofs for clean energy generation.
📍 Energy Storage: Provides Powerwall for homes and Megapack for large-scale projects, helping stabilize grids and manage energy costs.
📍 Charging Infrastructure : Operates a network of Supercharger stations, increasingly open to other EVs.
Services: Includes vehicle maintenance through service centers and body shops.
📍 Robotaxi: Plans to launch a fully autonomous ride-hailing service in June 2025 in Austin, Texas, potentially opening new revenue streams Tesla's robotaxis by June? Musk turns to Texas for hands-off regulation.
📍 Tesla Optimus: Developing a general-purpose robotic humanoid for tasks like household chores or industrial work, which could lead to new markets.
This expansion into energy and services, along with unexpected ventures like Robotaxi and Tesla Optimus, enhances Tesla's role in the transition to sustainable energy and technology, offering benefits like grid stability and potential robotics applications.
The growth in the energy segment, with a 67% increase from 2023 to 2024, highlights Tesla's expanding role in sustainability, potentially attracting investors focused on long-term trends. Additionally, Tesla's commitment to innovation, particularly in autonomous driving technology, is noteworthy. The company is developing features like Full Self-Driving (FSD), which could open new revenue streams, such as robotaxi services, enhancing its investment appeal.
🤔I think Optimus and Robotaxi will exceed rapidly exceed their EV cars revenue. Elon musk is predicing over 1000% growth in 5 years. Which would be way above $2900 without stocks splits.
I m a bit conservative and I think we can go somewhere between 3 - 4 standard deviations.
Wishing you continued success on your trading journey. May this educational post inspire you to become an even better trader!
“Adapt what is useful, reject what is useless, and add what is specifically your own.”
David Perk ⚔
Pull-back Post Austin LaunchNot quite a dark cover cloud candlestick today but given how strong the Nasdaq was today and NASDAQ:TSLA slumped is a fairly pathetic price action on day 2 post Austin launch.
IMO a lot of shorts were on the sidelines until robotaxi commenced. They waited for the pop and now feel more confident in entering short since they were able to assess launch. Buy the rumor sell the news if you will...
Correcting below the pre-launch price back to the lower wedge trend line around low 300s is my target.
The price will drop to at least $230The price will drop to at least $230. after that can goes to $200. but i have to re-check at $230
If you are thinking of investing, this is not a good place to buy at all.
I recommend entering in the $200 range after getting the necessary confirmations.
If you would like to follow me to see the rest of my analysis.
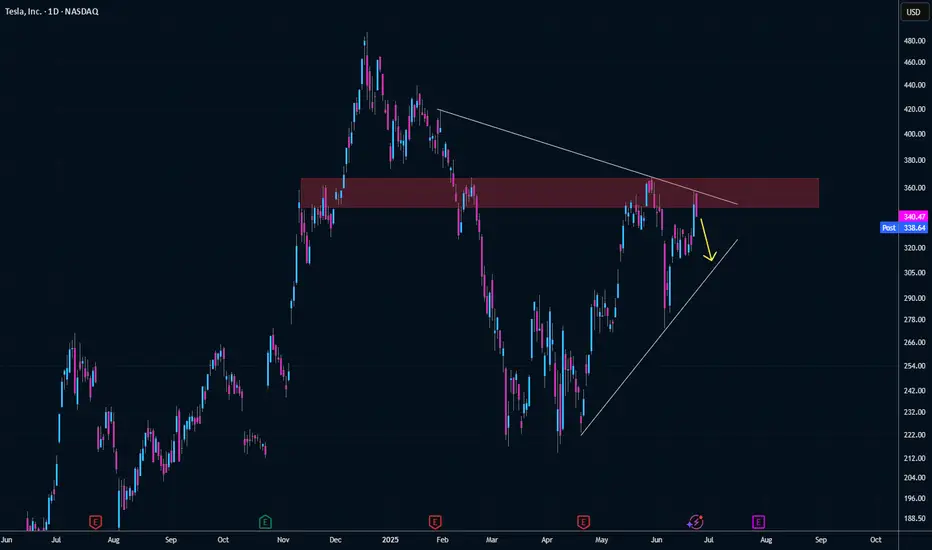
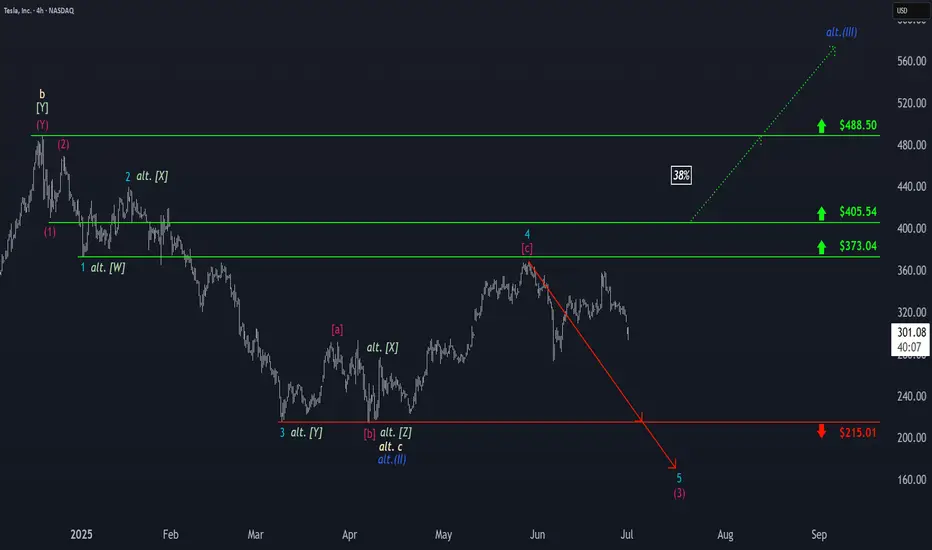
Tesla: Back on Track?Tesla has resumed downward momentum, aligning with our primary scenario and moving away from resistance at $373.04. As part of the ongoing turquoise wave 5, we expect continued selling pressure: it should break below the $215.01 support. This would complete magenta wave (3) of the current bearish impulse. A reversal back above $373.04 – and especially a breach of $405.54 – would force us to adopt the 38% likely alternative scenario. Under this count, the correction low of blue wave alt.(II) would be already in, and Tesla would now be rallying in wave alt.(III) .
📈 Over 190 precise analyses, clear entry points, and defined Target Zones - that's what we do.
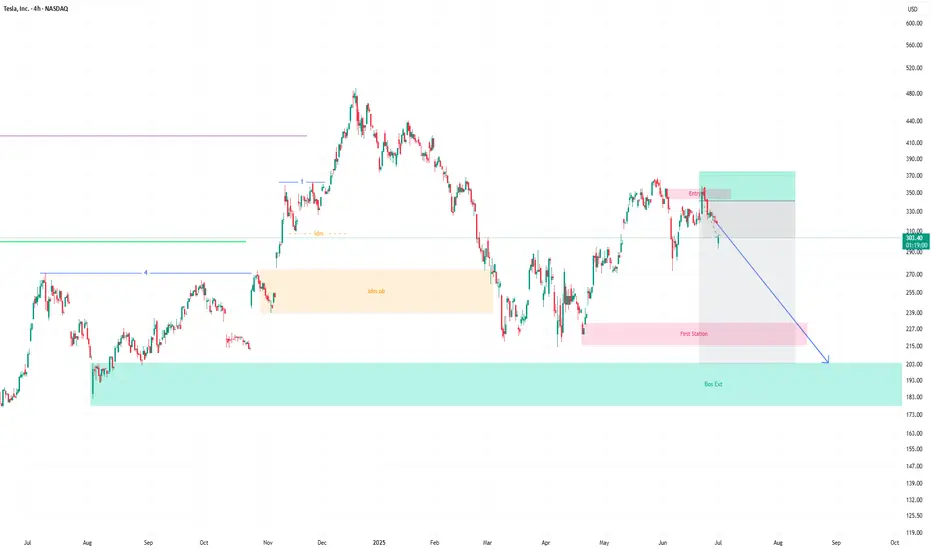
TESLA Lagging BehindA compelling reason to buy Tesla stock now—despite it being beaten down—is the asymmetric risk-reward setup driven by its depressed valuation relative to long-term growth potential. Sentiment is currently low due to concerns about EV demand, competition, and Elon’s distractions, but this pessimism is largely priced in. Meanwhile, Tesla still holds massive optionality: AI-driven autonomy, energy storage, and Dojo supercomputing. If even one of these verticals scales meaningfully, current prices may prove a generational entry.
At the moment, we are hitting some of my key support levels being the anchored vwap from the low , as well as the previous Value Area High range retest within the formation of this broader triangle, suggesting a potential continuation to the upside should we get a strong breakout.
I will be watching for further down side as the current risk is only approx 6-7% for a potential upside of 60%-70% , a massive Risk to reward.
Should this reclaim the downtrend vwap, it can be a strong sign of strength for this stock to move back to ATH's as tesla is massively lagging behind.
One more drop. Another dip incoming — I just hope we don’t establish below around 260, that would turn bearish.
If we drop down to 260, I’ll be looking to buy again.
Short setup TiqGPT MARKET NARRATIVE:
Analyzing the Tesla Inc. charts across multiple timeframes, we observe a consistent downtrend from the daily (1D) to the 1-minute (1m) timeframe. The price action shows a series of lower highs and lower lows, indicative of a bearish market structure. The 1D chart reveals a significant bearish momentum with recent candles closing near their lows, suggesting strong selling pressure. This trend is echoed in the 4-hour (4h) and 1-hour (1h) charts, where price has failed to reclaim higher levels, instead forming bearish continuation patterns.
The 15-minute (15m), 5-minute (5m), and 1-minute (1m) charts provide a more granular view of the selling pressure, with price consistently making new lows. The absence of significant bullish retracements across these lower timeframes indicates that liquidity is being taken rather than created, as sellers push the price downward without substantial opposition.
INSTITUTIONAL THESIS:
Institutions appear to be in a distribution phase, offloading shares which is evident from the sustained downward movement and lack of significant pullbacks. This suggests a continuation of the bearish trend with potential further downside.
LEARNING POINT:
The consistent lower highs and lower lows across all timeframes highlight a strong bearish momentum engineered by institutional selling pressure.
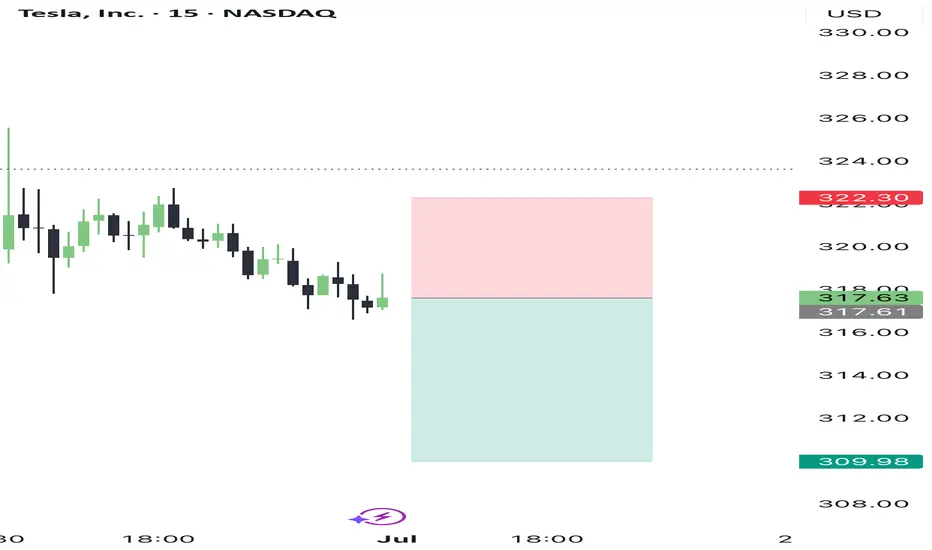
SIGNAL: WAIT
SYMBOL: TSLA
ENTRY PRICE: $317.60
STOP LOSS: $322.00
TARGET PRICE: $310.00
CONDITION: Sell on a slight pullback to $317.60, which aligns with recent minor resistance levels on lower timeframes.
RATIONALE: Calculated risk/reward ratio of 1:1.7 (Risk=$4.40, Reward=$7.60) does not meet minimum 2:1 requirement. Waiting for better institutional setup with improved risk parameters.
Momentum & Exhaustion: No signs of exhaustion in selling, with candles closing near lows.
Liquidity Behavior: Continued push lower without significant retracements suggests ongoing institutional distribution.
Pressure Analysis: Strong selling pressure evident from the lack of bullish counter-moves.
Context Awareness: Price is trending down with no significant areas of demand observed that could halt the bearish momentum.
STRATEGIES USED:
Multi-Timeframe Bearish Continuation
Distribution Phase Trading
URGENCY: HIGH
TIMEFRAME: Short-term
CONFIDENCE SCORE: 85%
RISK/REWARD RATIO: Risk=$4.40, Reward=$7.60, Ratio=1:1.7 (Below 2:1 minimum)
Risk = $322.00 - $317.60 = $4.40
Reward = $317.60 - $310.00 = $7.60
Ratio = $7.60 / $4.40 = 1.72
RECOMMENDATION:
The calculated risk/reward ratio of 1:1.72 does not meet the minimum requirement of 2:1. Therefore, the recommendation is to WAIT for a better risk/reward setup or further confirmation of institutional activity that could provide a more favorable entry point.
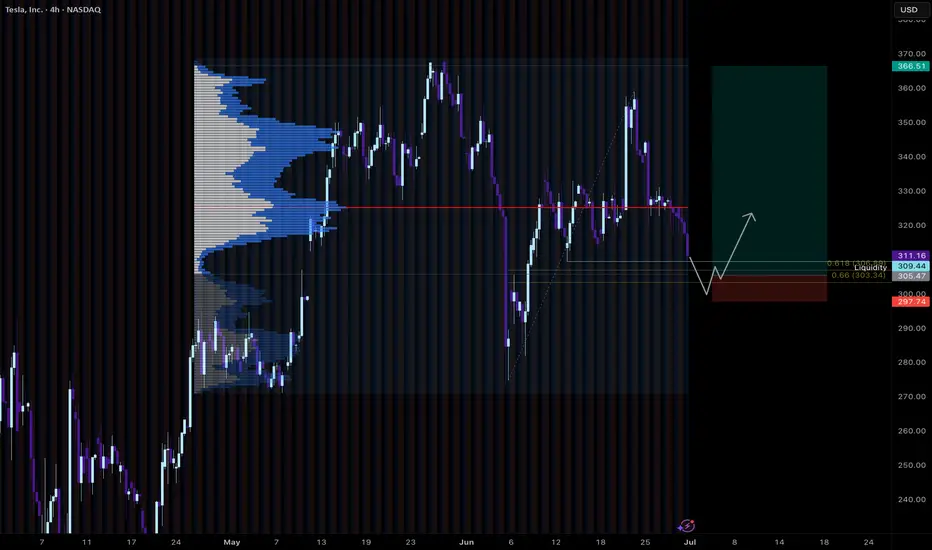
Tesla LongCurrently hanging around at the Golden pocket of the uptrend.
Would be interested in a long if we got a retrace to the whole move golden pocket, which sits on the current range VAL. Would also sweep liquidity from the recent lows.
Would need to see a good reaction to take the trade.
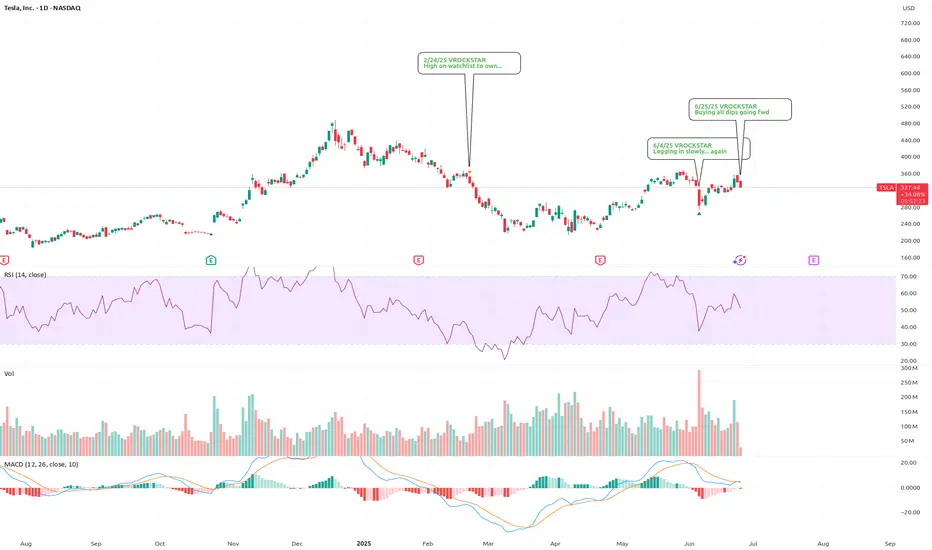
6/25/25 - $tsla - Buying all dips going fwd6/25/25 :: VROCKSTAR :: NASDAQ:TSLA
Buying all dips going fwd
- "successful robotaxi or not successful robotaxi"
- elon's clearly won the vision game
- scaling hardware (cars, infra, optimus, solar) is m-o-a-t
- so is a humanoid and robotaxi robotics company that doesn't burn cash worth a trilly in today's world if the upside is perhaps 5-10 tn in the coming decade (worst case) and your downside here is what? 30... 40... 50%? Is it more? unlikely.
- so "yes" we remain entering consumer recessy. yes "tsla" shares r not cheap. and that's for a reason.
- buy scarce paper.
- buying all dips here.
- i like the dec '27 deep ITM leaps. allows me to wrangle size with a bit more flexibility in the coming months.
- but this rocketship has yet to make any meaningful moves.
- $1,000/shr is the 2Y tgt.
V
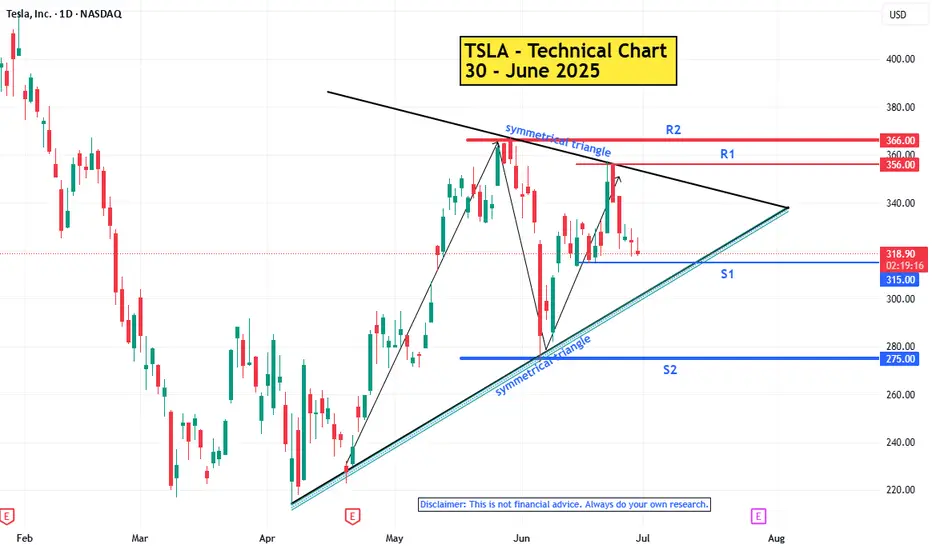
TSLA : Technical Analysis Report - 30 June 2025Trend:
The primary trend (big picture) is upward. Bullish momentum is weak.
Short Term Trend : sideways / consolidation. Regardless of the larger trend, momentum within a sideways range is typically neutral or flat, reflecting a temporary balance between buyers and sellers.
Pattern : Symmetrical Triangle Patte rn
A symmetrical triangle is like a market catching its breath. It's a temporary pause in a trend. Once the price breaks out of the triangle, it usually continues in the same direction it was going before. Until that breakout, it's a neutral pattern.
Key levels :
R2 - 366
R1 - 356
S1 - 315 -The price is facing the support 215.
S2 - 275
Tips for Trading
Wait for a confirmed breakout (e.g., a daily candlestick close above/below the trendline) to avoid false signals
-----------------------
Note :
If you’re interested in receiving detailed technical analysis reports on your selected stocks, feel free to reach out to me. I can provide you with customized reports covering trends, key levels, momentum, patterns, and price projections to support your investment decisions.
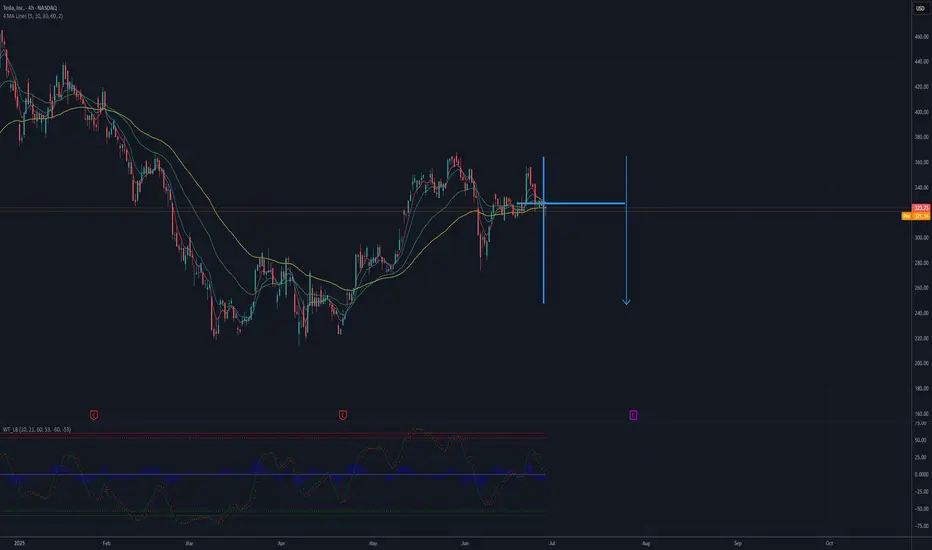
TESLA falling down to 250 USD?Tesla is consolidating in a tight range, showing bearish pressure near the lower boundary of the formation. Moving averages (MA 5/10/30/60) are flattening, indicating a loss of bullish momentum, while the Wavetrend oscillator has issued a sell signal (bearish crossover below the zero line). A downside breakout from this range projects a potential move toward the $250 level, as illustrated by the measured move. This bearish scenario gains validity if price breaks below the $315 support level.
Possible TP: 250 USD
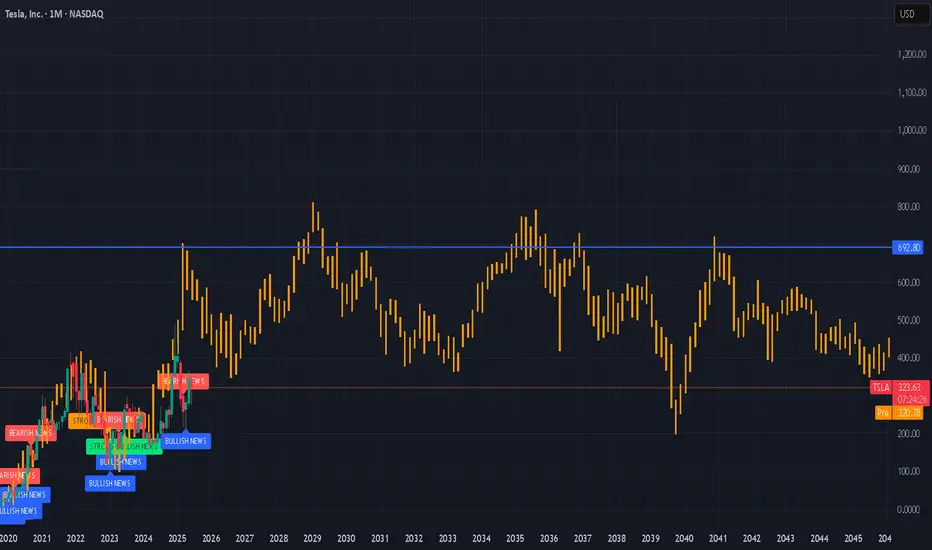
Tesla-Heading For A New ATH?NASDAQ:TSLA is looking good!
Robo-Taxi, Optimus Robots...and so more to come!
Tesla to $692 in the next years? Or months?
#stocks #tesla #stockmarket
Long-Term Growth Potential in the Face of Short-Term ChallengesCurrent Price: $323.63
Direction: LONG
Targets:
- T1 = $331.50
- T2 = $345.00
Stop Levels:
- S1 = $319.50
- S2 = $310.00
**Wisdom of Professional Traders:**
This analysis synthesizes insights from thousands of professional traders and market experts, leveraging collective intelligence to pinpoint high-probability trade setups. The wisdom of crowds principle suggests that aggregated perspectives from experienced professionals build a more balanced outlook on Tesla, reducing emotional biases and highlighting consensus opportunities in the market.
**Key Insights:**
Tesla is currently navigating through a challenging phase characterized by competitive pressures in both China and Europe. Recent macroeconomic headwinds, including rising interest rates and shrinking global spending on electric vehicles, have fueled concerns about short-term sales performance. However, analysts remain optimistic about Tesla's innovation leadership, particularly in AI-driven robotics, battery technology, and autonomous mobility development. The recent technical charts reflect a narrowing wedge formation, and a breakout above $354.78 could confirm renewed bullish momentum, offering significant upside potential.
**Recent Performance:**
Over the past few weeks, Tesla has experienced tight price consolidation, underlying near-term indecision among market participants. While its stock price remains below short-term moving averages, signaling bearish pressure, longer-term sentiment is bolstered by overall optimism in the technology sector. Additionally, fluctuations in deliveries and revenue from various regions continue to impact day-to-day trading sentiment, with the stock showcasing higher volatility during earnings updates.
**Expert Analysis:**
Market analysts exhibit cautious optimism surrounding Tesla. Short-term concerns linger about declining sales growth in legacy markets such as Europe and the loss of its dominant position in China due to rising competition from local manufacturers like BYD. However, whether Tesla can monetize its cutting-edge developments in AI, robotics, and autonomous driving remains a focal point of its long-term strategy. Analysts agree that while these initiatives may redefine the EV market over the next 5-10 years, revenue realization is expected to be slow and could dampen speculative enthusiasm in the immediate term.
**News Impact:**
Tesla recently announced the launch of its robo-taxi initiative, beginning trials in Austin, Texas, a move that challenges traditional mobility norms. While this innovation enhances Tesla's narrative as a disruptor in the industry, regulatory obstacles and scalability issues pose immediate hurdles that could delay market adoption. On the downside, Tesla saw declining deliveries in Europe and China, casting shadows over its near-term growth prospects in these critical regions. Investors should keep a close eye on upcoming earnings reports for clearer guidance on production schedules and delivery forecasts.
**Trading Recommendation:**
Based on recent technical consolidation and consensus expert views, traders are recommended to take a long position on Tesla with price targets of $331.50 and $345.00. The stock exhibits signs of medium-term upside potential if momentum aligns with broader bullish trends in the S&P 500 and technology sectors. Implement disciplined risk management with stop levels set at $319.50 and $310.00 to protect against unfavorable moves. Investing in Tesla provides exposure to a high-risk innovation-driven narrative; traders should evaluate their appetite for risk carefully before entering this position.

TLSA Catalyst Ranking and Market Update: June 2025Here's an updated/revised outlook for TSLA including all the primary
catalyst ranking and analyst ratings and overview of latest developments
🔋 1. EV Demand Growth
Strength: 9/10 → 9/10
Global electric vehicle adoption remains the dominant pillar. Tesla faces softer comp in Europe (–40.5% drop in May) wsj.com, but overall trend remains firmly upward. 🌍
🚗 2. Affordable Entry Level Model
Strength: 8.5/10 → 8.5/10
Tesla still on track to launch a < $25K EV in first half of 2025. Any delays or execution issues could pressure sentiment.
⚡ 3. Battery Cost & Margin Improvement
Strength: 8/10 → 8/10
Margins saw slight relief Q1, driven by cost cuts f, but macro headwinds persist.
🤖 4. Autonomy & Robotaxi Rollout
Strength: 7.5/10 → 8.5/10
Robotaxi debuted in Austin in June, sparking a ~10% one-day stock surge. Benchmark raised its target to $475/buy on the rollout—strong tailwind.
🚩 5. Competition
Strength: 7/10 → 6.5/10
Rivals like Xiaomi’s new YU7 are gaining ground. Tesla must maintain differentiation.
📉 6. Trade Policies & Tariffs
Strength: 6.5/10 → 6.5/10
Still relevant due to Tesla’s global footprint, though less front-page than before.
💰 7. Incentives & Subsidies
Strength: 6/10 → 6/10
U.S. IRA tax credit policies remain supportive; evolving eligibility remains a swing factor.
🛢️ 8. Commodity Costs
Strength: 5.5/10 → 5.5/10
Raw-material swings affect margins. Inventory hedges help but not wholly mitigate.
📈 9. Fed & Interest Rates
Strength: 5/10 → 5/10
A higher-rate environment still limits valuation multiples for growth-tier companies.
🎭 10. Musk Profile & Governance
Strength: 4/10 → 5/10
Analysts (e.g., Bradley Tusk) warn of being “massively overvalued” tied to Musk’s persona. Musk’s renewed focus on Tesla vs. other ventures (DOGE, SpaceX) will be watched.
________________________________________
🚀 Refreshed Catalyst Rankings
Rank Driver Score
1 EV demand growth 9
2 Affordable model 8.5
3 Battery costs/margins 8
4 Autonomy/robotaxi execution 8.5
5 Competition 6.5
6 Trade & tariffs 6.5
7 Regulatory incentives 6
8 Commodities 5.5
9 Fed Rates 5
10 Musk reputation/governance 5
________________________________________
📊 Latest Analyst Ratings & Targets
• Benchmark / Mickey Legg: Buy, target $475 (from $350) — cites robotaxi safety-first rollout, automation upside
• Wedbush / Dan Ives: Outperform, target $500 — labels TSLA as an “embodied AI compounder”
• Morgan Stanley / Adam Jonas: Buy, target $410 — bullish on AI/self driving positioning
• Cantor Fitzgerald / Andres Sheppard: Overweight, target $355 — optimism rooted in robotaxi and FSD rollout
• UBS / multiple: Sell, target $215–225 — skeptical on demand and valuations
Consensus snapshot (FactSet):
• Mean price target ≈ $311–$312
• Mean rating between Hold–Buy (~2.7/5)
________________________________________
🗞️ Recent Headlines
• “Tesla completes first fully autonomous Model Y delivery ahead of schedule”
• “Tesla robotaxis launch in Austin” boosting momentum
• “EU Tesla sales slump” May registrations down 40.5%
• “Tesla fires longtime insider as Europe slump deepens”
________________________________________
🔍 Summary Outlook
Tesla shares are navigating a volatile interplay of strong tech promise and unfolding execution risks:
• Overweight view (Legg, Ives): Robotaxi rollout and AI thrust fuel upside. Automation transition seen as transformative.
• Bullish base (Jonas, Sheppard): AI, FSD rollout, affordable model support core thesis.
• Skeptical view (UBS, Tusk): Slumping deliveries in Europe/China, heavy valuation, Musk's external focus seen as emotional dampener.
Upcoming triggers to watch:
1. Q2 delivery and production results (mid July).
2. Robotaxi rollout execution/regulatory clearance.
3. Margin trajectory as costs evolve.
4. FSD reliability and expansion in new markets.
________________________________________
✅ What This Means for You
• Bull case: Robotaxi + AI momentum may drive TSLA back toward targets in the $475–500 range.
• Bear case: Weak deliveries, macro and competition pressures could cap shares or trigger pullback toward prior support ($330–350).
• Neutral: Watch near-term delivery and autonomy news to shape next move.
