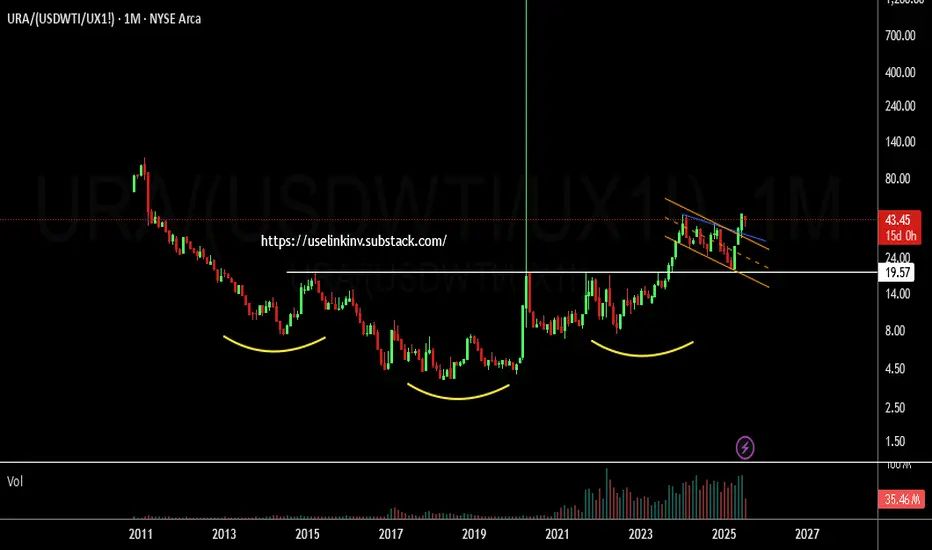
Uranium miners in relation to energy and adjusted for spot priceThe Miners keep making more and more money.!
They could become cash cows
URA trade ideas
Global X Uranium ETF: Positioned for Growth Amid Rising Nuclear Current Price: $37.51
Direction: LONG
Targets:
- T1 = $39.00
- T2 = $40.50
Stop Levels:
- S1 = $36.50
- S2 = $35.75
**Wisdom of Professional Traders:**
This analysis synthesizes insights from thousands of professional traders and market experts, leveraging collective intelligence to identify high-probability trade setups. The wisdom of crowds principle suggests that aggregated market perspectives from experienced professionals often outperform individual forecasts, reducing cognitive biases and highlighting consensus opportunities in Global X Uranium ETF.
**Key Insights:**
The Global X Uranium ETF (URA) is strategically positioned to benefit from renewed interest in nuclear energy as a critical solution for low-carbon energy goals. With nuclear power gaining traction globally as a stable and clean energy source, demand for uranium—the primary input for nuclear reactors—is projected to rise significantly. Recent price action shows the ETF consolidating in a pivotal range, indicating investor positioning ahead of a potential breakout, as bullish trends dominate sector sentiment.
One of the key factors supporting URA's potential is the structural supply deficit in the uranium market. This imbalance has been exacerbated by declining production in recent years, matched against increasing demand fueled by energy diversification strategies around the world. The ETF's portfolio composition, focusing on uranium miners and producers, offers direct exposure to this secular growth trend.
**Recent Performance:**
URA has displayed resilience above the $35 level over the last few weeks, consolidating gains amid temporary pullbacks in commodity markets. Despite some volatility in broader markets, the ETF has maintained a consistent upward trajectory, reflecting strong investor confidence in the uranium sector's long-term prospects. A recent test of the $37.50 level indicates strengthening support zones that could propel future moves higher.
**Expert Analysis:**
Professional analysts remain broadly optimistic about URA's potential, citing technical indicators and macroeconomic drivers backing its growth. Key resistance is identified at $39 and subsequently $40.50—levels that could trigger a sustained rally if breached. Technical support at $35.75 provides a risk-managed floor for traders, ensuring balanced positioning in case of short-term retracements. Furthermore, fundamental analysts highlight the operational leverage of uranium miners as the underlying commodity's price continues to recover.
**News Impact:**
Global energy policies emphasizing carbon neutrality have thrown a spotlight on nuclear power as a viable alternative to fossil fuels. Recent government commitments to expand nuclear capacity globally reinforce the bullish narrative for uranium demand. In addition, supply-side constraints due to limited mining activity and geopolitical factors are likely to sustain upward pressure on uranium prices, translating to healthy returns for URA investors.
**Trading Recommendation:**
Investors should consider a long position in URA, taking advantage of its exposure to a sector positioned for significant growth. Current technical levels suggest a bullish breakout toward $39 and $40.50, while stop levels at $36.50 and $35.75 ensure disciplined downside protection. As nuclear energy gains momentum in the global transition to sustainable energy, URA represents an attractive opportunity to capitalize on this transformative trend.
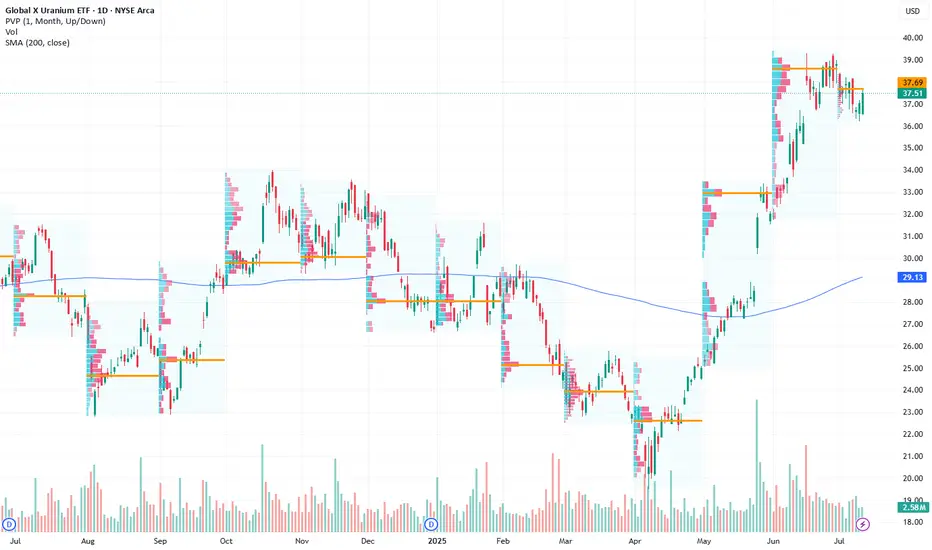
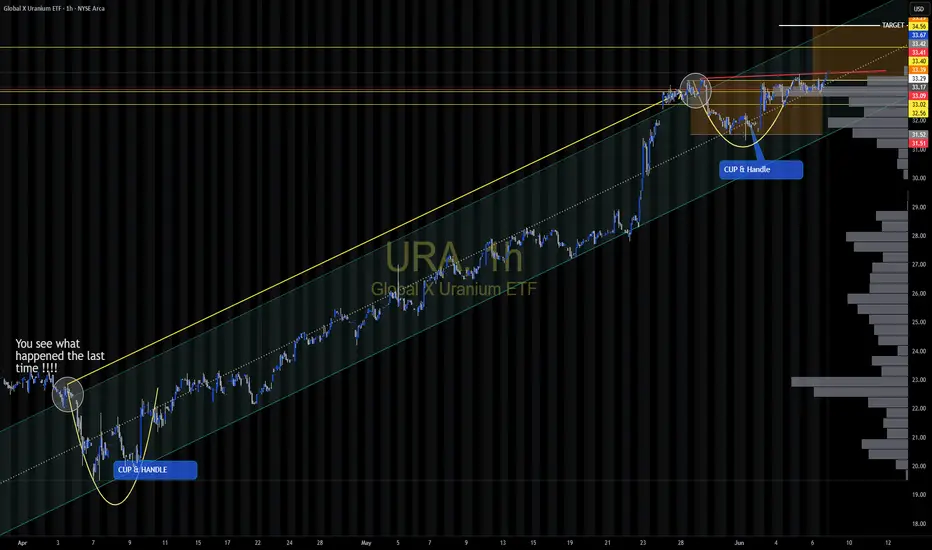
URA Long CallURA and CCJ are sitting at Volume Support and Darvas support levels.
Prices have also set up a minor low signal.
The trend has started to move to sideways, would would be confirmed today. Therefore, we need to be more aggressive in our stop loss and profit target. I like a move back up to the $38 level.
Entry $36.62
Stop Loss: 20% - Due to trend change.
Profit Target - $37.95
Uranium The Epic Explosion!Global uranium demand is up to rise about 28% by 2030, driven by clean-energy pushes, nuclear restarts (e.g., Japan), and advanced modular reactors
Kazakhstan’s largest producer, Kazatomprom, cut its 2025 production forecast by ~17% due to logistical hurdles and resource constraints
Iran signaled openness to discussions with European counterparts aimed at curbing its uranium enrichment levels. However, seasoned diplomacy and regional conflict issues complicate prospects for an agreement
Bottom line: Uranium markets are tightening due to production cuts and geopolitical risk, while long-range demand is gaining momentum thanks to nuclear expansion and emerging energy technologies.

This Just Went Nuclear - Explosive Move!Uranium prices have surged due to several key factors:
- Increased demand for nuclear energy – Many countries are expanding nuclear power to meet clean energy goals.
- Geopolitical tensions – Supply disruptions from Russia and Niger have tightened the market.
- Underinvestment in uranium mining – Years of low prices led to reduced production, creating a supply deficit.
- Government policies – The U.S. and other nations are prioritizing domestic uranium production for energy security.
- Rising uranium prices – Spot prices have climbed significantly, boosting mining stocks.
We are near some major resistance and expect some profit taking to occur.
Names Like NYSE:OKLO NYSE:SMR AMEX:URNM AMEX:URA NASDAQ:CEG should be on watch for a strong selloff.
URA at historic Support/Resistance level on WeeklyURA has hit the ~23.00 level. Since June 2021, the 23.00 level has provided resistance or support to URA 7 times, as shown by the yellow circles on the Weekly chart.
Entering a Long position with a upside target to another area of previous support and resistance at the ~27.00 area (green rectangle).
Price Stop: $22.00
Time Stop: 3 months.

URA - Looking Good for Major MoveThe URA base appears to be a major reverse head and shoulders formation with price projections into the 40s. The move thus far appears to be impulsive with wave 5 targets also shown at the 1 and 1.618 levels. Still appears to be under the radar

Utilities vs. Uranium: Is the Nuclear Sector Gaining Momentum?Introduction:
Utilities AMEX:XLU have demonstrated strong performance over the past year, often signaling a "risk-off" market environment where investors seek safety. However, the rise of artificial intelligence (AI) and its impact on market dynamics may be challenging this traditional narrative. Despite the evolving landscape, caution is warranted against assuming that "this time is different." A new factor to watch is the growing influence of the nuclear sector, particularly uranium stocks AMEX:URA .
Analysis:
Risk-Off Sentiment vs. New Trends: While utilities' strong performance typically signals a defensive market stance, the increasing focus on nuclear energy is drawing investor interest toward uranium stocks. The shift reflects a potential change in how market participants view traditional safe havens.
URA-to-XLU Ratio: The upward trend in the URA-to-XLU ratio over recent years indicates a growing preference for uranium stocks over traditional utilities. Even after a significant selloff earlier this year, the ratio formed a higher low, signaling resilience and maintaining its long-term uptrend.
Momentum Shift: The key focus now is whether this ratio can make a new high. If the URA-to-XLU ratio breaks above its previous peak, it would suggest strengthening momentum in the nuclear sector, indicating that this trend could have staying power and possibly reflect a shift in market preferences.
Conclusion:
As the market balances between traditional risk-off sectors like utilities and emerging trends in nuclear energy, the URA-to-XLU ratio serves as a critical indicator of shifting investor sentiment. A new high in this ratio would suggest that the nuclear sector's momentum is strengthening, with uranium stocks potentially leading the way. Do you believe this trend will continue? Share your insights below!
Charts: (Include relevant charts showing the URA-to-XLU ratio, the higher low formation, and potential breakout targets)
Tags: #Utilities #Uranium #NuclearEnergy #XLU #URA #MarketTrends #TechnicalAnalysis

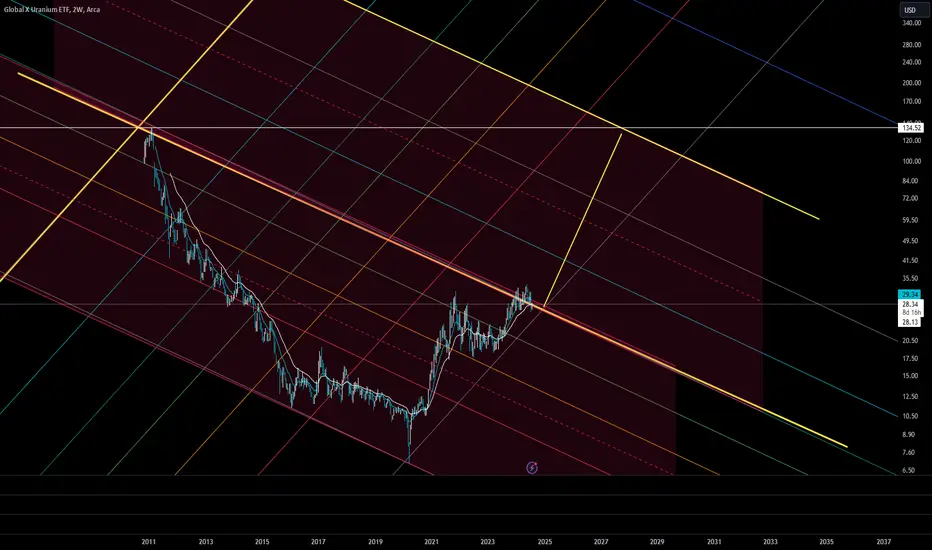
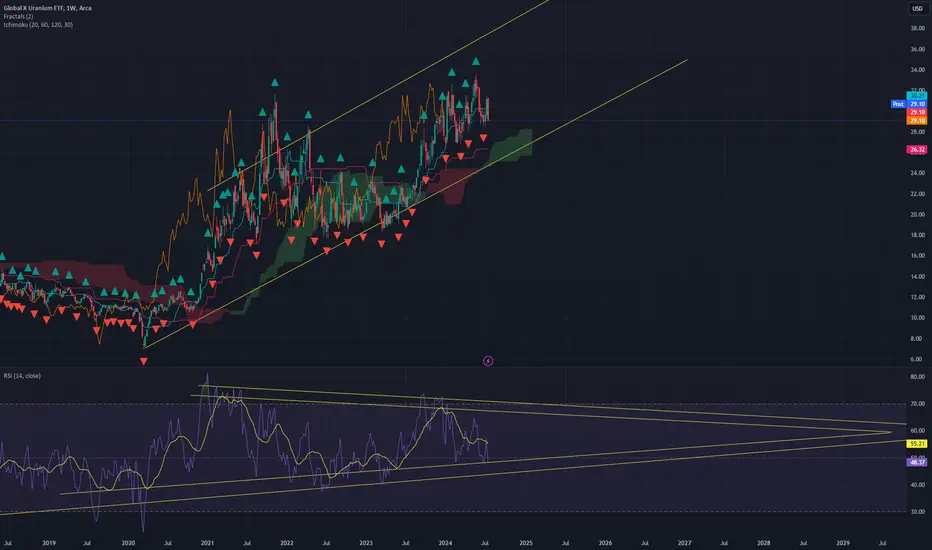
Incoming 50% collapse for Uranium?This is a forecast through until the summer of 2026.
On the above 3 week chart price action has enjoyed a wonderful 400% rise from the bottom. A number of reasons now exist for a bearish outlook.
1) Price action and RSI support breakouts.
2) Regular bearish divergence. Lots of it. 10 oscillators print negative divergence with price action.
3) Almost all tradingview ideas are currently “long”. Remember the majority of traders, almost 95% of them, will lose money.
Is it possible price action continues to climb? Sure.
Is it probable? No.
Ww

C-Wave for Uranium miners?it is possible, that we head lower into the 0.5-FIB region. URA still looks bullis and will resume the uptrend at some point.
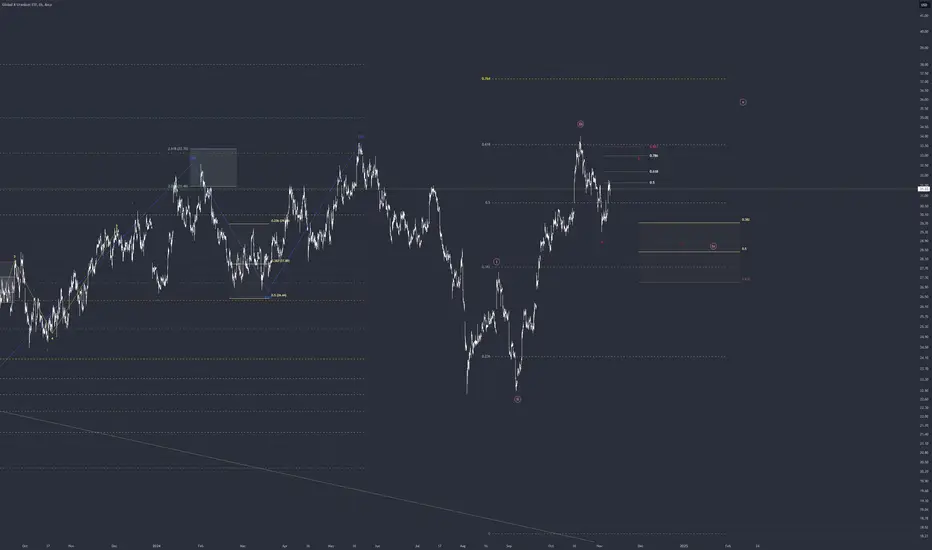
Nov 3, 2024 Best Scenario for URA by Mid-LAte 2025 >2X Nov 3, 2024
Best Scenario for URA
by Mid-LAte 2025
Minimum Return 1:2 Ratio (Double your money)
The uranium industry forecast for 2025
indicates a tightening market with rising
prices, driven by growing nuclear energy demand and potential
supply constraints.
This environment is likely to benefit
uranium producers and drive
increased investment in exploration and production

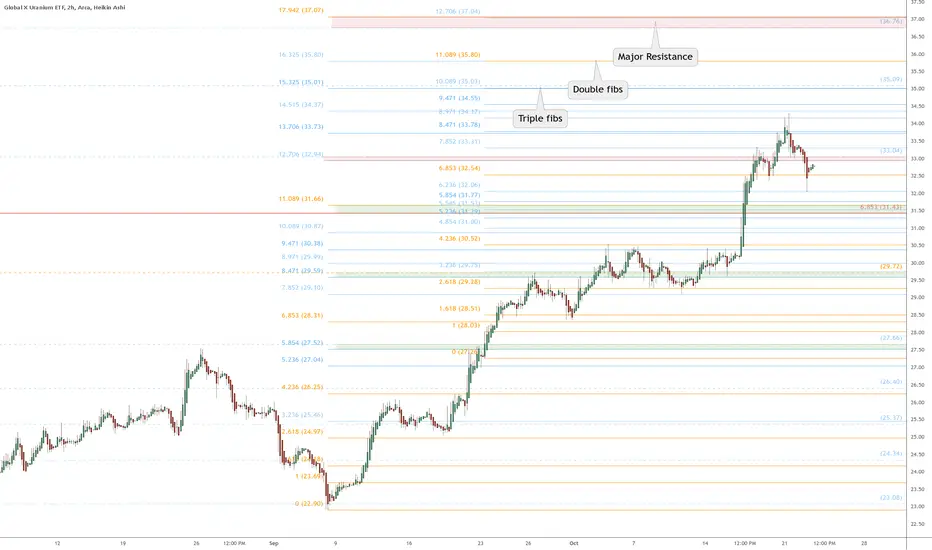
URA eyes on $31.44: Major Support to hold for $37 final targetFollowup to my plot looking for $31 break (click).
URA broke above a major zone with ease.
Likely to be retested for possible late longs.
Or look for Break-n-Retest of zones above.
$ 31.43 - 31.66 is Major Support that must hold.
$ 34.37 - 34.55 is the proven immediate hurdle.
$ 36.26 - 37.07 is the final target for this wave.
.
Previous Analysis:
.
See "Related Publications" below for other Uranium stocks
==================================================================
.
Uranium breakout $URA on MonthlyWe have a monthly ascending triangle that is above all EMAs and VWAPs. I am bullish and long on Uranium and think we'll see a breakout over 2025/2026.
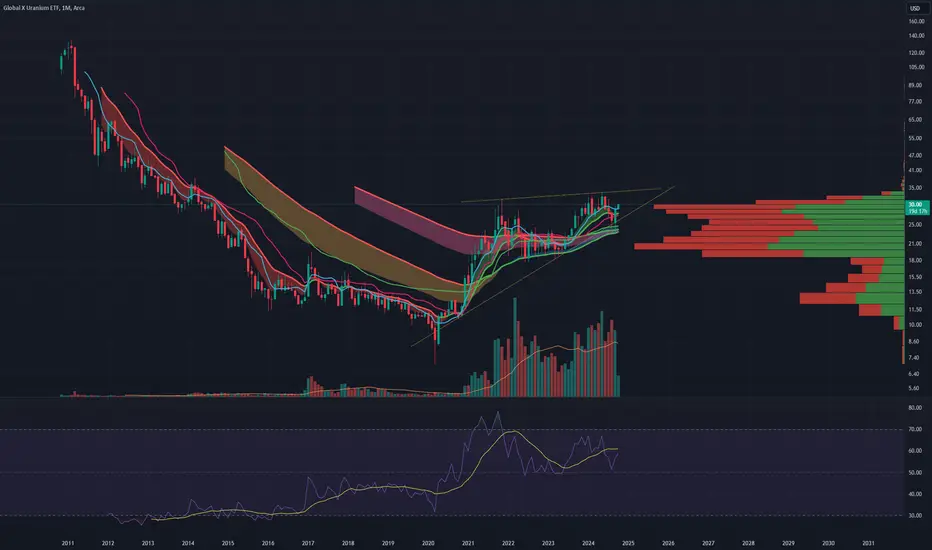
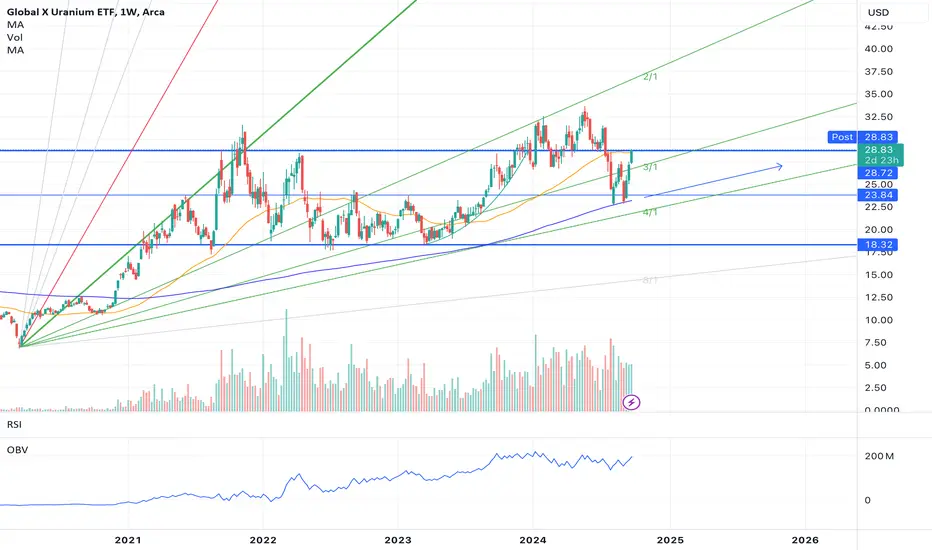
1-2 1-2 setupLoving this 1-2 1-2 setup here for a long term BnH. The 6% yield is just gravy. Double bottom tested the 200 WMA (blue line) and expect said MA to trend long term w/ what is shown as the 1/4 Gann angle.
I'm adding on any pullbacks here for a long term core position.
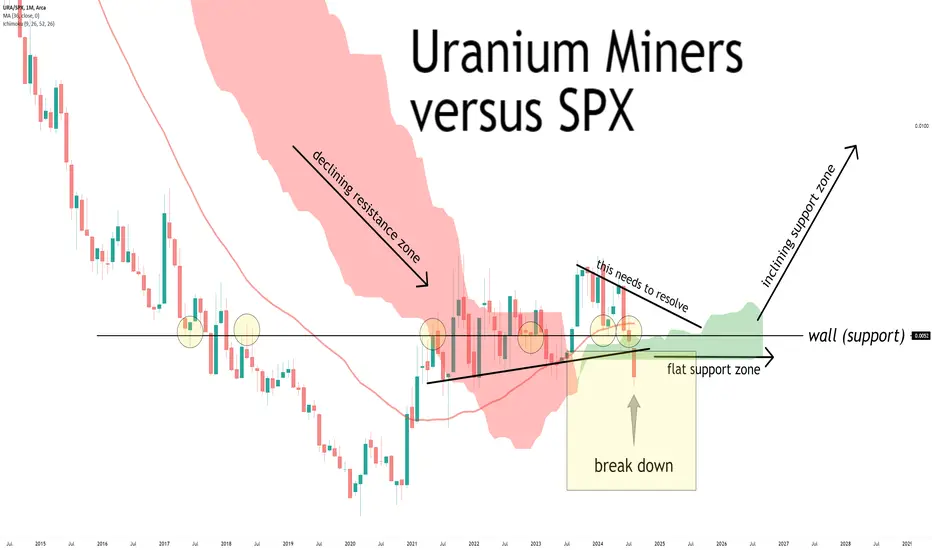
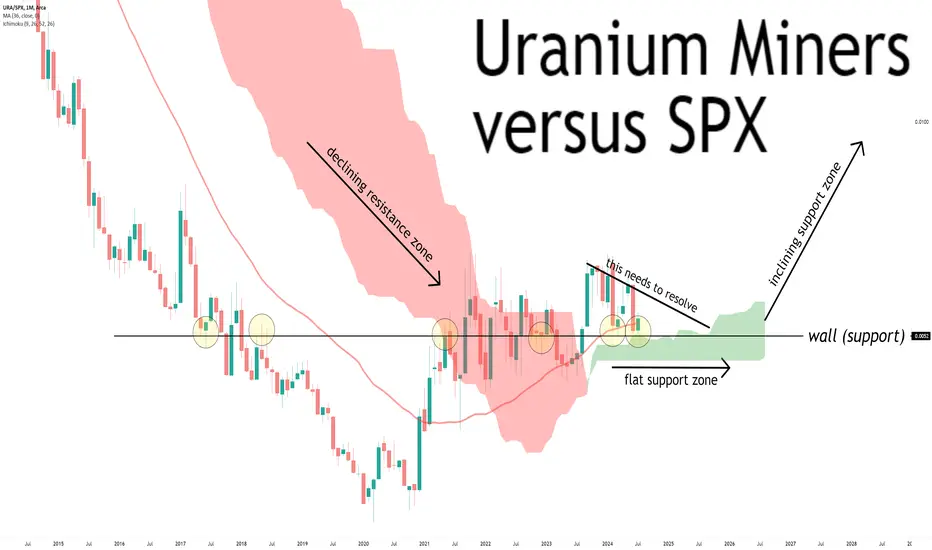
Uranium miners versus spx.For my uranium bull friends...
Sorry to be the bearer of bad news.
But this has happened to #uranium #miners versus #spx.
Not something you see in a bull era.
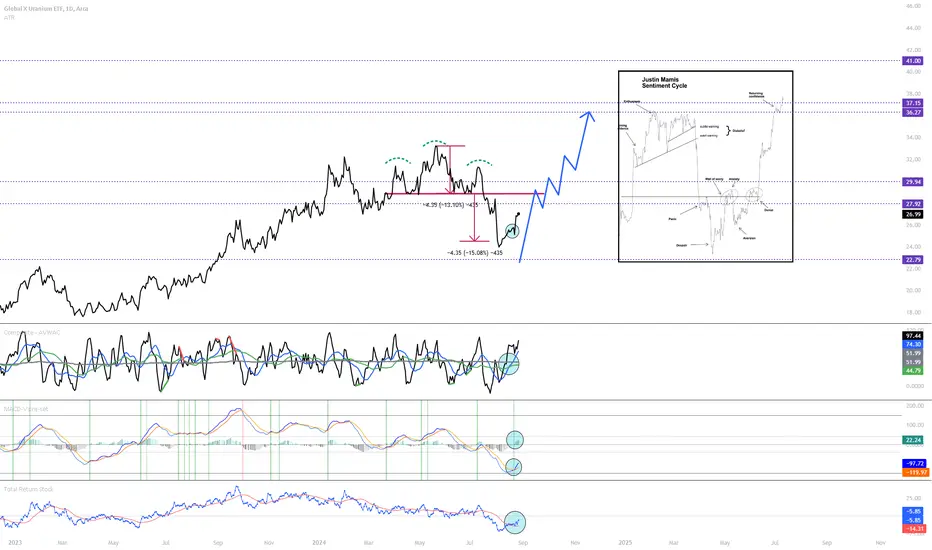
URA - Uranium OpportunityURA completed the full projected drawdown from the inverted head and shoulders. Purple lines are fib confluences using Connies method. The composite index shows favorable momentum. Volatility weighted MACD has a signal crossover. And Martin Prings concept of total return (rate of change + dividend)/(3 month commercial paper) has a signal crossover.
Uranium has consistently maneuvered through Justin Mamis sentiment cycle. We appear to have recently seen an aversion stage.
This is still an aggressive area for an entry and commodities require patience at this point in the cycle.
AMEX:URA
ura uranium Uranium is looking amazing. #stockmarket #Investor #uranium #ura AMEX:URA #myart #technicalanalyst ura
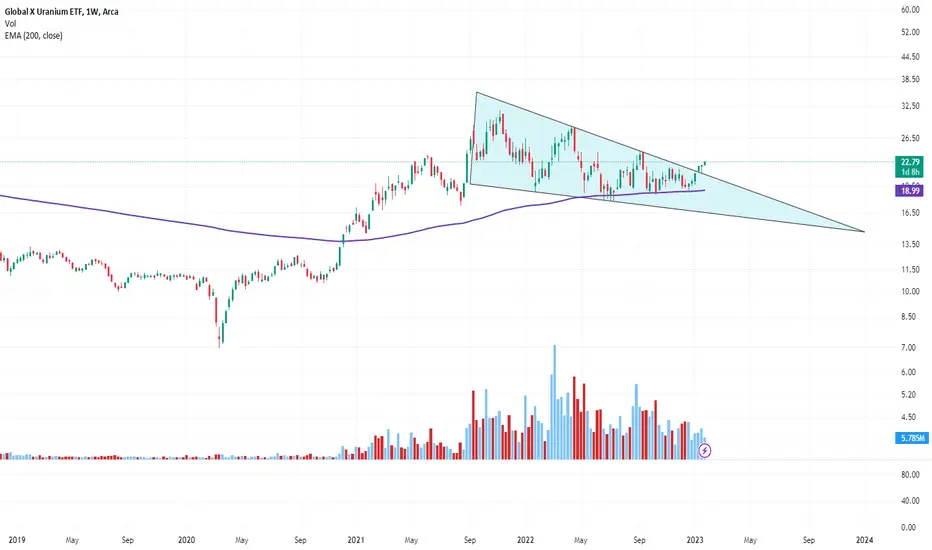
Uranium X ETF break out - BullishA descending wedge in an uptrend has led to textbook breakout with Uranium X ETF ($URA)
Could be a retest though at 20.50
Weekly chart has been used
Head and shoulders top?#uranium stocks AMEX:URA ETF look like a distribution top, and has now traded for three days below weekly EMA30. Could be the "get out while you still can" moment.
If head and shoulders, measured move is around $24.
#u308

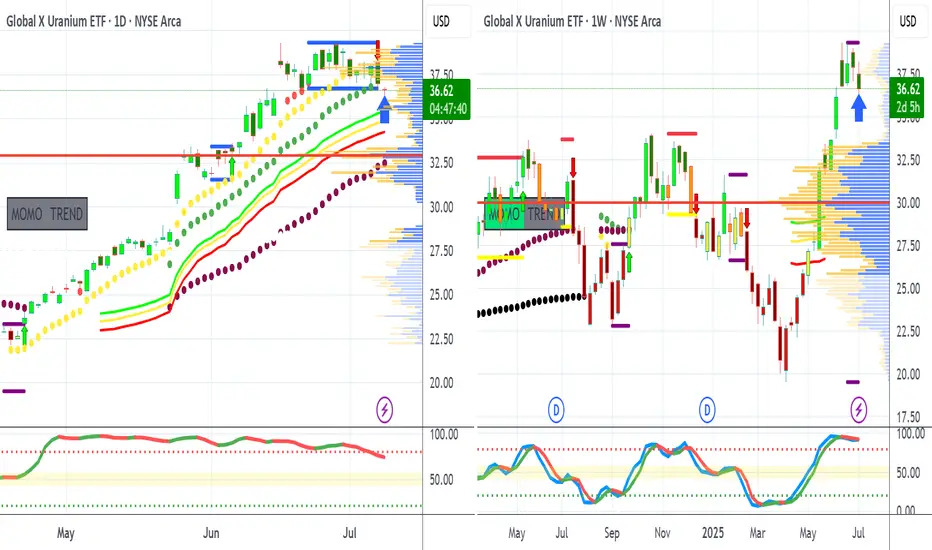
URA Riding the Tenken into a possible C-ClampI've been following the Uranium trade for a while now. I've seen comparisons to a slow moving crypto cycle. Even the personalities that follow it, trade it, talk about it have comparisons in being some larger than life personalities. It's been a fun own and follow for me.
I own a few individual companies, but of course there is correlation with the bigger companies and the large ETFs.
Taken a look at the Global X Uranium ETF here just to check and see how the market is tracking on a broader scale.
Still looking good on the cloud. Price riding the Tenken. It has opened up what I believe is a bearish C clamp to the Kijun. My thoughts are a healthy cool off before continuation. Fingers crossed. AMEX:URA
Uranium Miners have flat lined versus US Stocks.Uranium Miners have flat lined versus US Stocks.
When we get the next important move depends on how this resolves.
#ura #spx #uranium
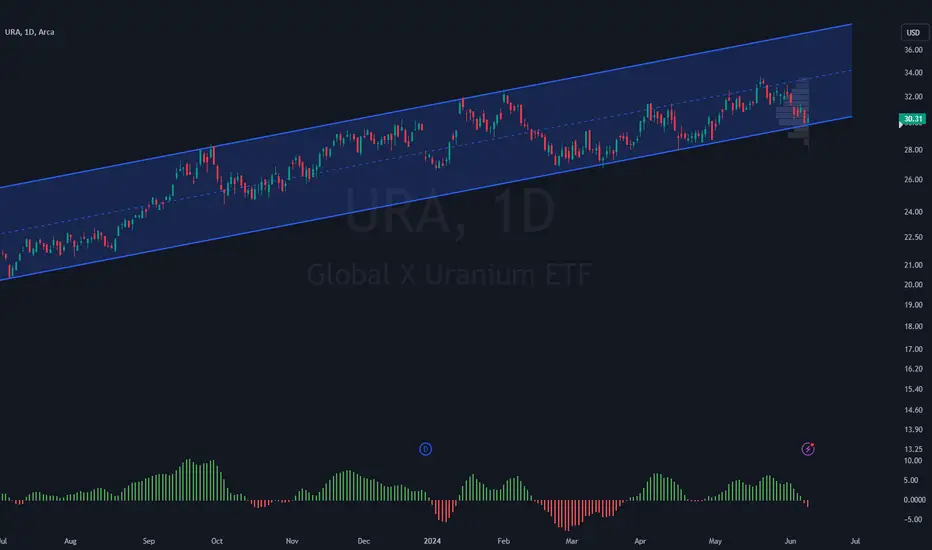
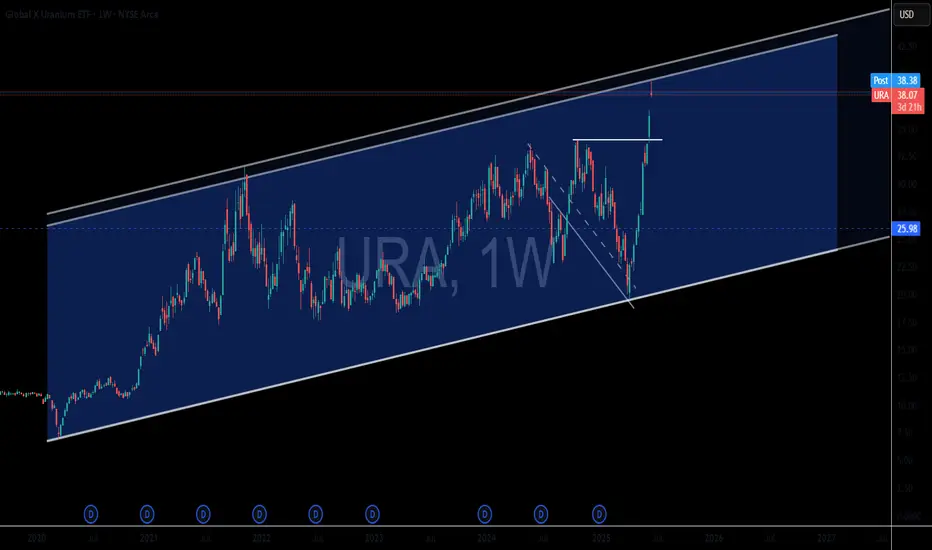
Shorting URA: 1+ Year Trend Channel BreakoutMonitor URA for a breakdown below the lower boundary of its ascending trend channel. If the price breaks out of the trend channel downward, look for a subsequent bounce back to the $30 price range to test the resistance level. Upon confirmation of resistance at $30, consider entering a short trade using put options to capitalize on the expected downward movement. This strategy aims to take advantage of a failed recovery within the channel, signaling a potential shift in trend.