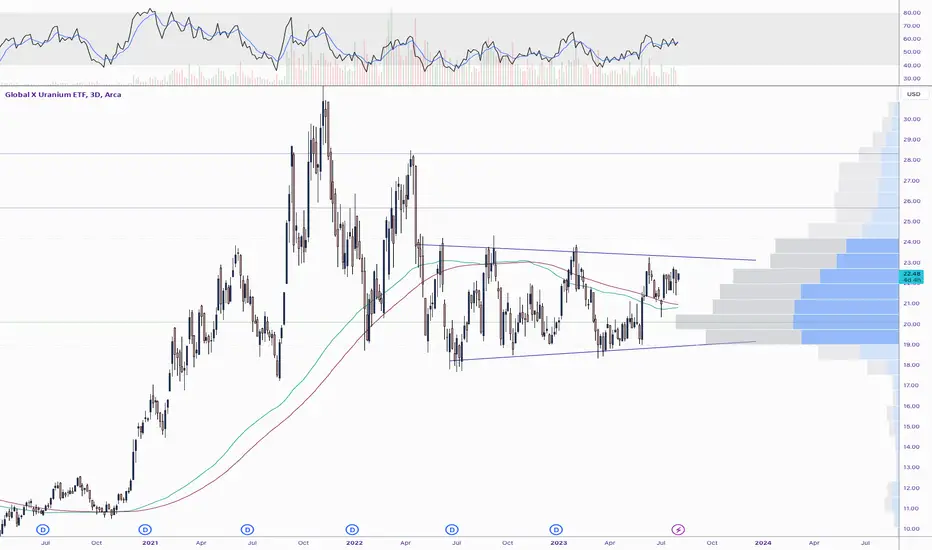
URA 3d, 2023 2H URA looking interesting for the second half of 2023. If there is a commodities resurgence in q3-q4 similar to what we are seeing with energy (see XOP, XLE) this is a viable candidate to make a move in the next coming months.
URA trade ideas
uranium miners v3DO NOT care about narratives, but DO care about price action.
Are you seeing what is happening in the URANIUM sector?!?
#uranium #gold #silver #crudeoil #inflation
notes
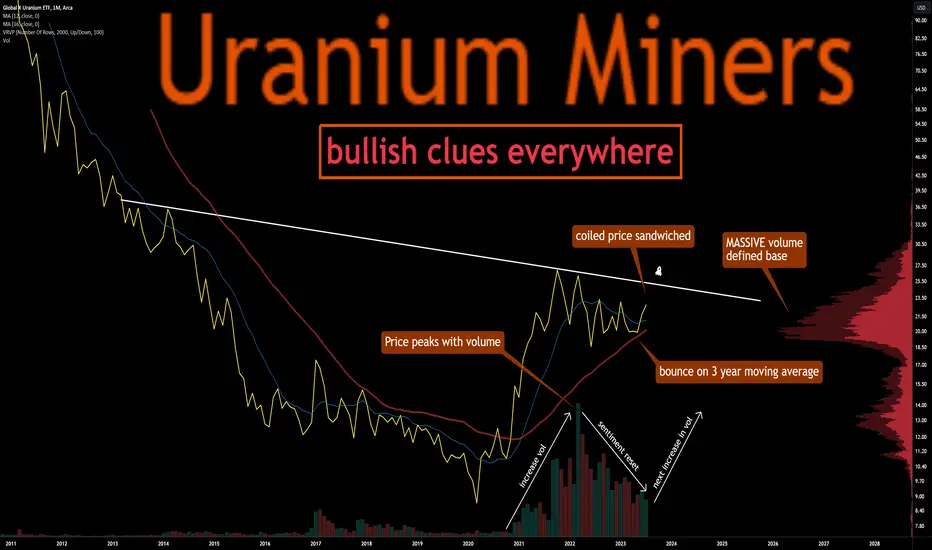
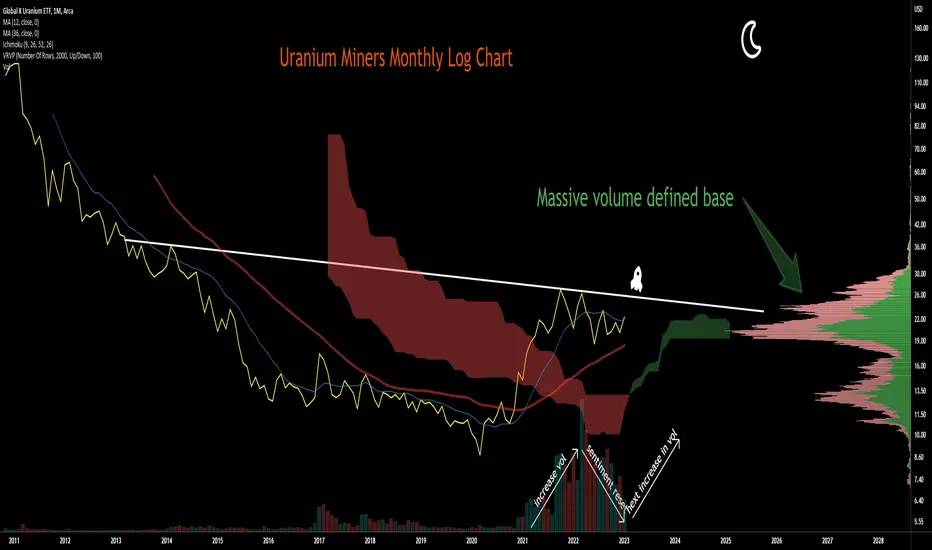
MASSIVE volume defined base
bounce on 3 year moving average
coiled price sandwiched
Price peaks with volume
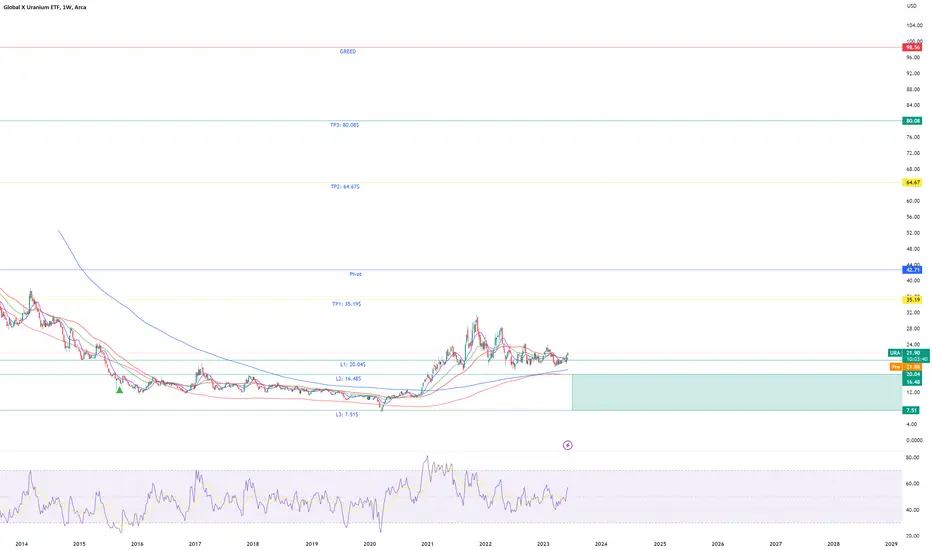
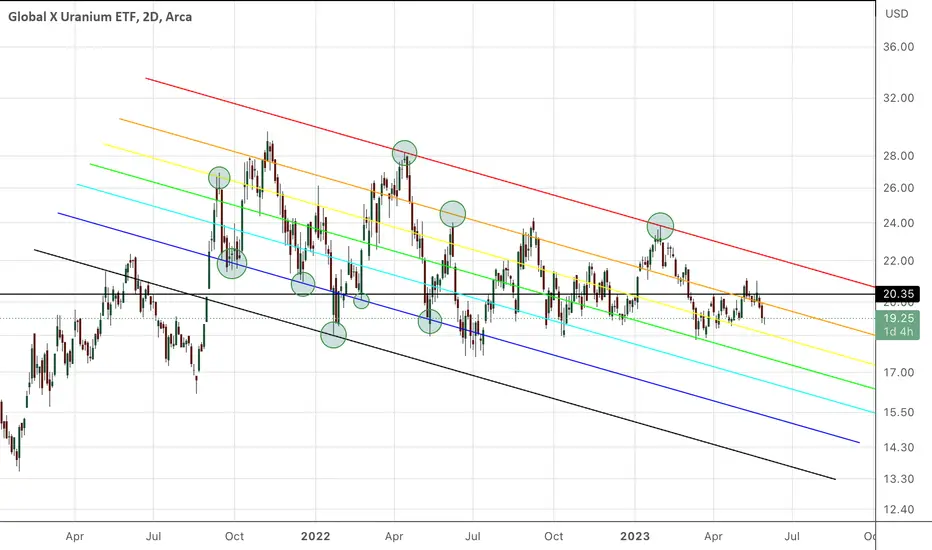
Levels of Interest $URA TA on levels of interest for AMEX:URA ETF.
Please note that this is a preliminary research paper and you should continue to do your own research (DYOR). Information about assets can change rapidly, and it's essential to stay updated with the most recent developments.
Notes on how I personally use my charts/NFA:
Each level L1-L3 and TP1-TP3 (Or S1-S3) has a deployment percentage. The idea is to flag these levels so I can buy 11% at L1 , 28% at L2 and if L3 deploy 61% of assigned dry powder. The same in reverse goes for TP. TP1: 61%, TP2:28% and TP3:11%. If chart pivots between TP's, in-between or in Between Sell levels these percentages are still respected. I like to use the trading range to accumulate by using this tactic.
Just my personal way of using this. This is not intended or made to constitute any financial advice.
This is not intended or made to constitute any financial advice.
FED Macro Situation Consideration:
All TP's are drawn within the context of a return to FED neutral policy. I do not expect these levels to be reached before tightening is over.
NOT INVESTMENT ADVICE
I am not a financial advisor.
The Content in this TradingView Idea is for informational purposes only, you should not construe any such information or other material as legal, tax, investment, financial, or other advice. Nothing contained within this idea constitutes a solicitation, recommendation, endorsement, or offer to buy or sell any securities or other financial instruments in this or in in any other jurisdiction in which such solicitation or offer would be unlawful under the securities laws of such jurisdiction.
All Content on this idea post is information of a general nature and does not address the circumstances of any particular individual or entity. Nothing in the idea/post constitutes professional and/or financial advice, nor does any information on the idea/post constitute a comprehensive or complete statement of the matters discussed or the law relating thereto. You alone assume the sole responsibility of evaluating the merits and risks associated with the use of any information or other Content on the idea/post before making any decisions based on such information.
URA bear fib channelURA 2D overlayed with bear fib channel. I’m predicting, based on the obv consolidation, that ura will break out and revert to spot
Uranium Miners v2Uranium miners have gone NOWHERE for 2 years now.
Being forgotten while bullish chart morphs into existence is good.
Sentiment reset.
notes
coiled price sandwiched between 1 & 3 year moving averages
below critical take off platform
Price peaks with volume
MASSIVE volume defined base
#uranium

URA still a little more downside for the next tradeRisk to reward will look quite good. and 40$ should be achieved.
After the breakout (the red dotted line)

Uranium down until at least 03-Jul-2023We are near the end of completing a complex correction consisting of several 3 wave structures. I'm labeling them A-B-C-D-E. It could also be abcXabc; but in any case the trend and prediction is down. I'd like to see the correction take as long as the impulse. July 3rd is at a minimum the same length of time.
Destination for wave E is in the green box
1. is after july 3rd
2. near the gap from early 2021
3. between the .786 and 1 fib
After target is reached, we should have a strong bull market for years to come

Uranium long ideaUranium has been consolidating for a while now. It has been going back and forth between HKEX:19 - HKEX:23 range. First TP is the white horizontal line at $21.4 and the second TP is at $23.22

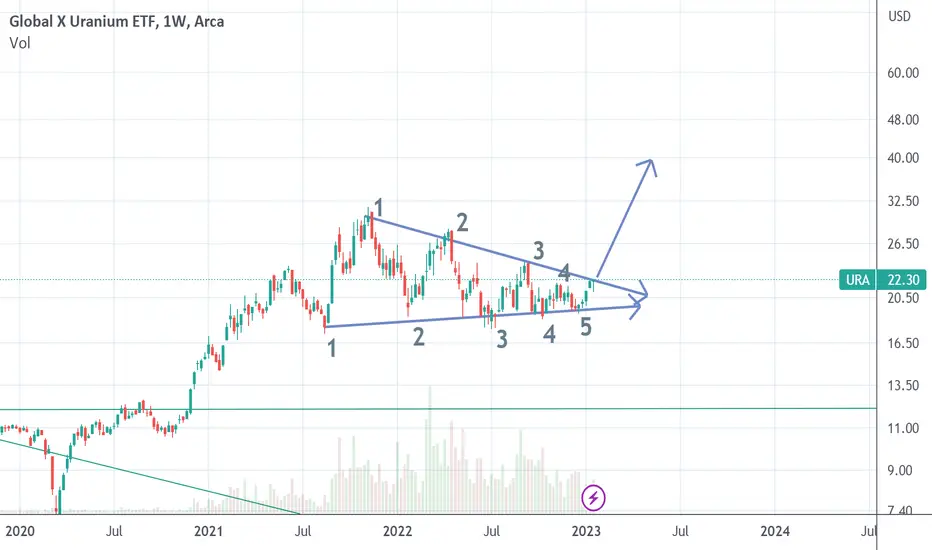
URA contracting triangleNearing the resolution. Could be the low. but..
It might as well retest point E (wave 4)

$URA Cup & handleNot financial advice.
$URA still on this downtrend wedge to fill gap at green area and at the same time long term will form a nice cup & handle for continuation on the bullish side.. be patient since has been almost 1.5 years forming the handle.
Like, share and subscribe.
Thank you!
Alex.

(URA) Uranium ETF Monthly OutlookExpecting a breakout in March/April 2023 as the price is beginning to touch spiral support. A sideways support structure is being built.
If the spiral is broken expect the orange spiral to act as support. Otherwise, price should begin to be attracted to the red overhead resistance spiral.
This is a long-term outlook.
Bullish: 46 is the next level of resistance (2023-2024), and once cleared 63-69 zone is on deck (2025-2027).
Bearish: Price fails the current support spiral, falls to $12, and then price works back to the green spiral.
Holding the current support spiral is key.

Uranium Miners ETF versus SPX#Uranium Miners versus #SPX with data adjusted for dividends.
The most behemoth of breakouts still ahead of us...


Bull Trap Forming...Many are sold on the fact the bottom is in here...However I think not (can I be wrong sure but probably unlikely), One of the main reasons is because the leg I have labelled A substructure of C terminated in 3wave structure which is not typical of a completed C wave (hence I do not believe the bottom is in - it's just half the move) and we're in the process of working on a B wave top before waterfalling down.

Long URA Uranium Miners Breaking OutUranium miners are breaking out of downward sloping resistance trend line. If the world is serious about going green then nuclear will have a big part to play and the world needs uranium.


Keep an eye on UraniumWill keep an eye on Uranium. It looks potencially promising. Need a bit more Volume and Bullish momentum to confirm. Will set my alerts.

URA Weekly convergence with 4 points and clear bullish candlesBullish Flag continuation
Buy at 22.28, Tight SL at 20.9 just below the last pinbar
Chance of another dip and false breakout back up for a second bullish entry.
Uranium Miners Monthly Log ChartTime for uranium and miners to launch is approaching...
#ura #inflation #fintwit #uranium
$URA back-testing trendline A successful back-test of this trend line could mean further upside. This is looking like a good long term commodity bet. Countries around the world are starting to see Nuclear as the best green alternative to coal. We are already using more Uranium that we are mining.


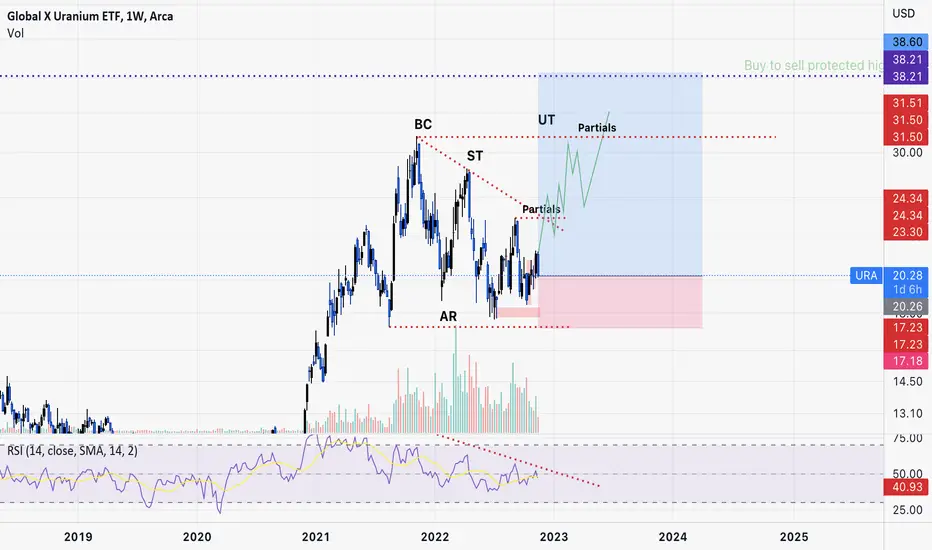
Buy URA. Target 38.32, stop at 17.18Fundamentals favor uranium and price action is showing transfer from weak to strong hands as complete. BC broke previous buy to sell. Stop is at 17.18 in case it wicks the buyers before shooting upward. The 3 recent peaks form a creek -->ready for liquidation.
Partials at 24.31 and 31.51