$AMD LongBands are super tight on $AMD. It's leading the market today up 4.29% while spy is barely breakeven .09%. Possible news meeting with China today
WH Sr. Adviser Hassett: I am absolutely expecting progress from US-China talks.
Progress from trade talks:
x.com
AMD trade ideas
AMD: Simple chart with potential futureAMD: Simple chart with potential future
The market is actually simple, not as complicated as you think — as simple as this naked chart. Most people refuse to learn these simple things, or deliberately complicate matters just to appear like a pro trader.
.
US STOCKS- WALL STREET DREAM- LET'S THE MARKET SPEAK!
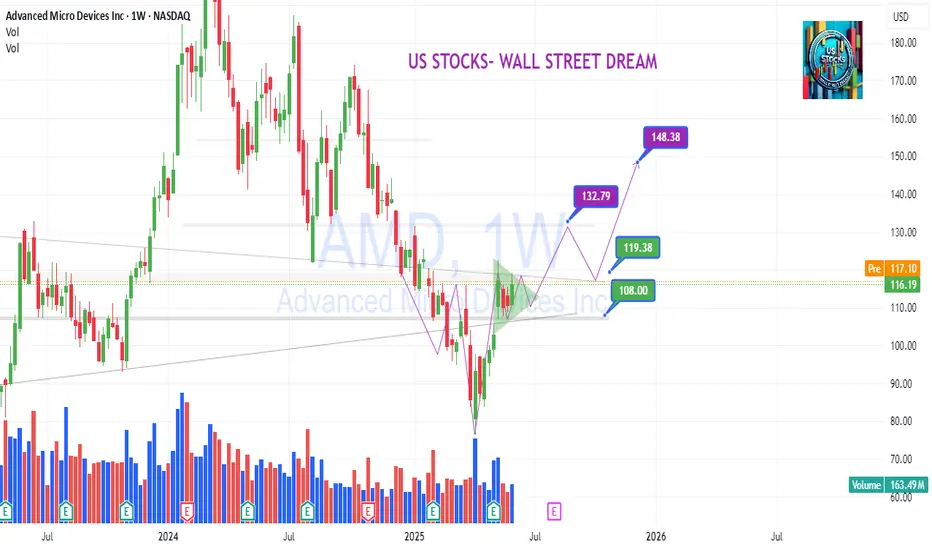
Inverted H&S on AMD BULLISH FOR MONDAY !!!! 150$USD JUNE END!!!Analysis of the Inverted Head and Shoulders
- Left Shoulder: The price first dipped, formed a trough, and then rebounded.
- Head: The stock dropped further, creating a lower trough than the left shoulder, followed by a recovery.
- Right Shoulder: A higher low formed, aligning with the left shoulder before the price moved upward.
- Neckline Breakout: The confirmation of this pattern comes when the price decisively breaks above the neckline (resistance level), suggesting a continued uptrend.
Potential Outcomes
- Bullish Breakout: Once the neckline is breached, a surge in buying pressure could push prices higher.
- Volume Confirmation: Increased trading volume at the breakout strengthens the validity of the pattern.
- Price Target: Traders often project the price increase by measuring the distance between the head and the neckline, then adding this to the breakout point.
Given the current price action, this setup could indicate a strong bullish continuation. However, market conditions and external factors should always be considered before making trading decisions.
If you want to refine this analysis or explore other scenarios, I'm here to dive deeper into key points! 🚀 Subscribe! TSXGanG
I hold a CCVM and MNC (Certificate of Competence to become a securities broker anywhere in Canada) and have been working as a trader for five years.
It’s a pleasure for me to help people optimize their trading strategies and make informed financial market decisions.
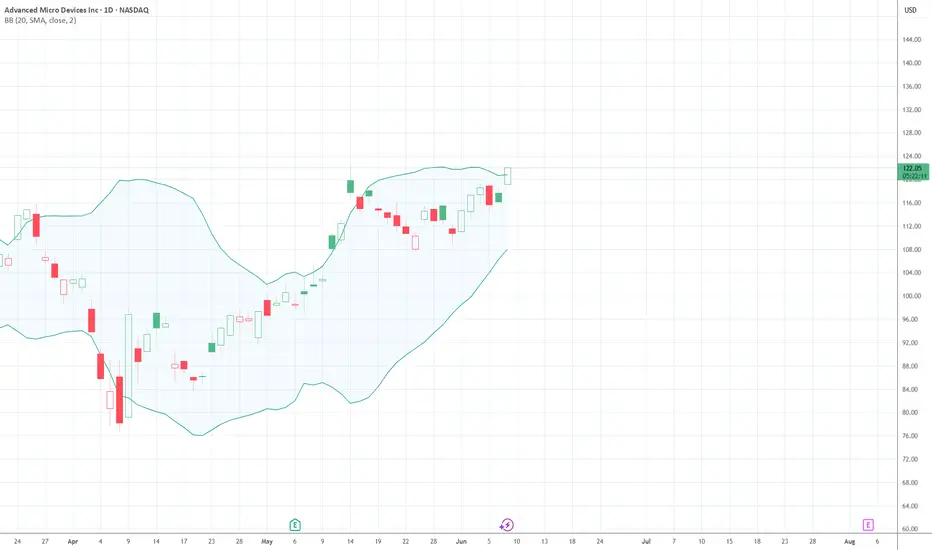
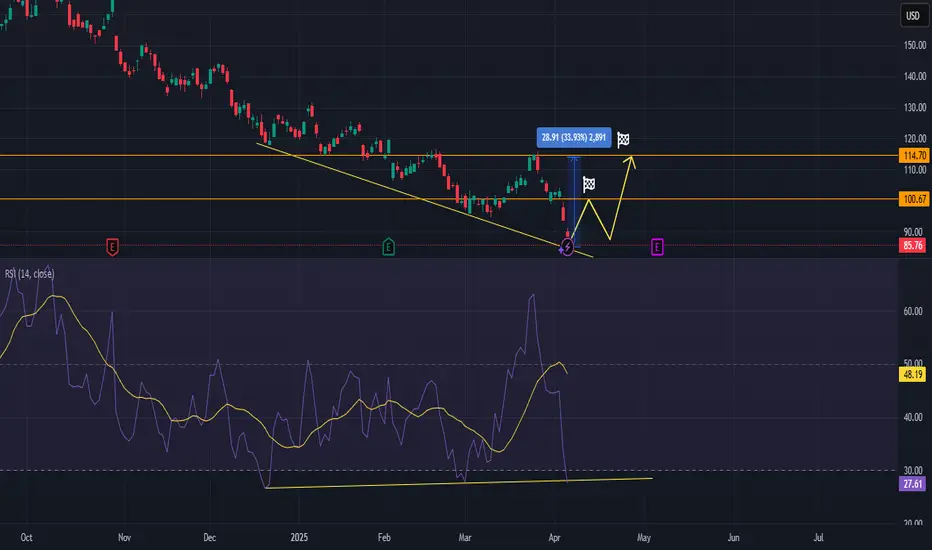
AMD - bulls have the ball nowhi traders,
Let's have a look at AMD stock on the 1D time frame.
AMD is very undervalued now.
It's also very oversold.
The stock market has been dumping hard but it may be a time to see a relief rally.
It's very likely that the bullish divergence and an oversold RSI on 1D time frame may lead to the bounce within the next few days / weeks.
I can't see it going much lower without giving us a solid bounce here.
2 targets are shown on the chart.
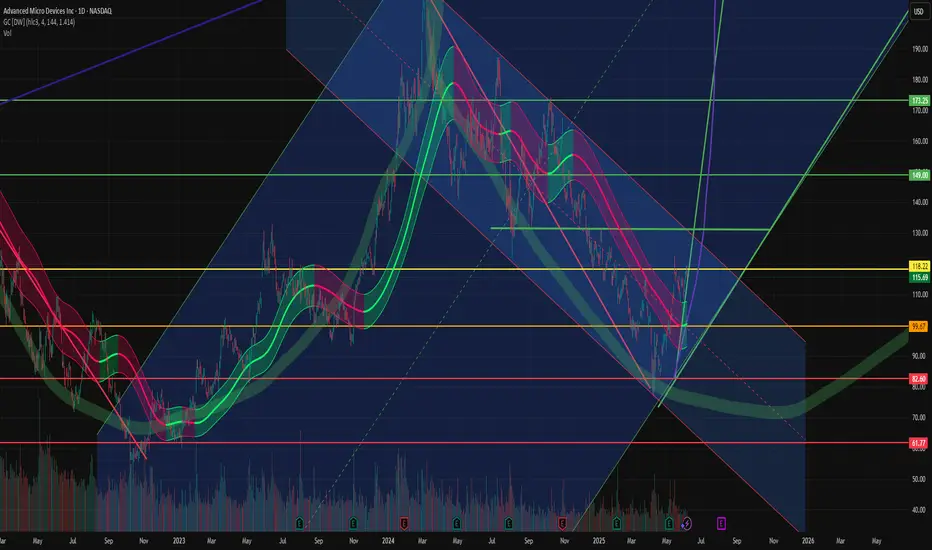
AMD will be bullish if we go higher than 128$ USD (CCVM)AMD (Advanced Micro Devices)
Stock appears to show signs of an imminent bullish recovery, according to several technical and fundamental indicators.
Technical Analysis TSX:AMD
- Current Price: $118.87, up 1.33%.
- Bollinger Bands: Indicate moderate volatility, with a trend toward the upper band.
- Trend Lines: A rising purple curve suggests a possible bullish recovery.
- Buy and Sell Zones: Annotations indicate strategic entry and exit points in the market.
Fundamental Analysis
According to the latest market analyses:
- Revenue Growth: AMD recorded a 36% increase in revenue in Q1 2025.
- Strategic Acquisition: The purchase of ZT Systems strengthens its position in data centers and artificial intelligence.
- Stock Buyback Program: AMD announced a $6 billion buyback, boosting investor confidence.
- Analyst Consensus: The average target price is set at $154.45, indicating significant upside potential.
Conclusion
Technical and fundamental indicators suggest that AMD may soon enter a bullish phase.
If you want to refine this analysis or explore other scenarios, I'm here to dive deeper into key points! 🚀 Subscribe! TSXGanG
I hold a CCVM and MNC (Certificate of Competence to become a securities broker anywhere in Canada) and have been working as a trader for five years.
It’s a pleasure for me to help people optimize their trading strategies and make informed financial market decisions.
AMD - Decision time on the downtrendAnother longer term spec I like. I am a little over weight and slightly down,
Watching for this long term downtrend to break to the upside or reject on the trend line as it has been doing.
probable rejection or a break and retest, we are at the decision point.
Do we reject and head down to retest the recent lows???

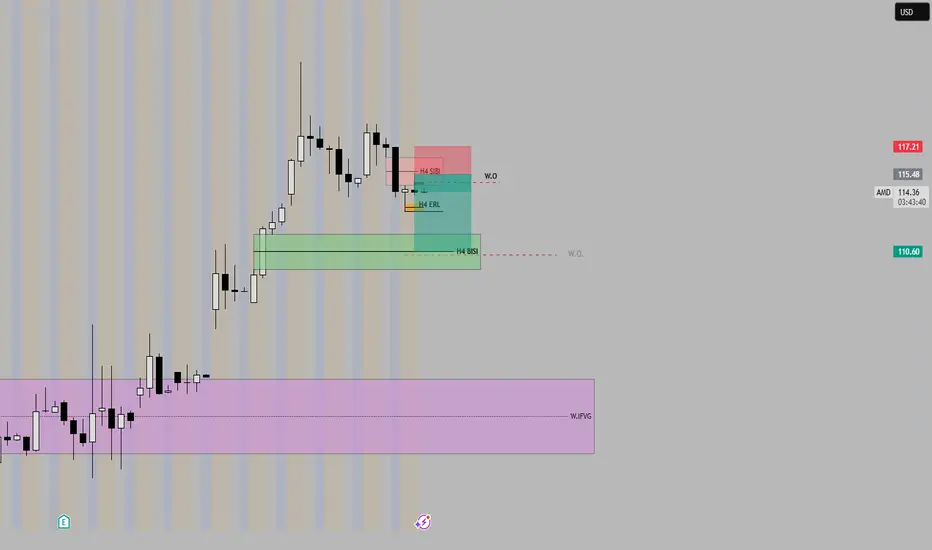
AMD: Short-term Upward PotentialAMD has continued to face downward pressure, preventing further progress in green wave . While this wave still has room to rise, its top should form below resistance at $141.16. Once wave completes, wave should follow—finishing the larger green impulse to the downside and completing the corrective structure of blue wave (II). This move is expected to conclude in our blue Long Target Zone between $62.82 and $35.19. That said, we continue to monitor a 30% alternative scenario: it suggests that wave alt.(II) has already bottomed at $76.12. In that case, AMD wouldn’t visit the blue zone but instead break out directly above the resistances at $141.16 and $174.98—marking the beginning of wave alt.(III).
📈 Over 190 precise analyses, clear entry points, and defined Target Zones - that's what we do.

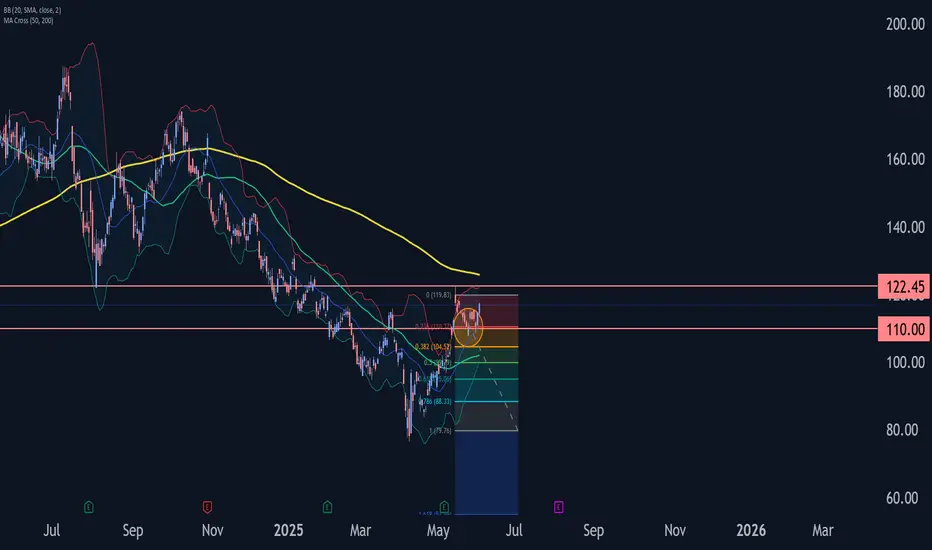
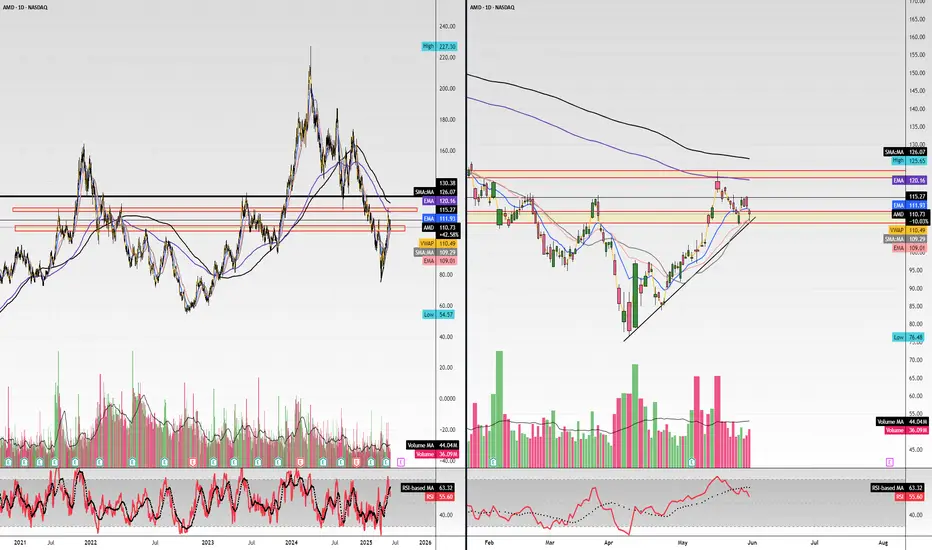
AMD Wave Analysis – 3 June 2025
- AMD reversed from the support zone
- Likely to rise to the resistance level 122.45
AMD recently reversed up from the support zone between the support level 110.00 (low of the previous correction (2)), the 20-day moving average and the 38.2.% Fibonacci correction of the upward impulse from April.
The upward reversal from this support zone started the active intermediate impulse wave (3).
AMD can be expected to rise to the next resistance level 122.45 (which stopped the earlier intermediate impulse wave (1) at the start of May).
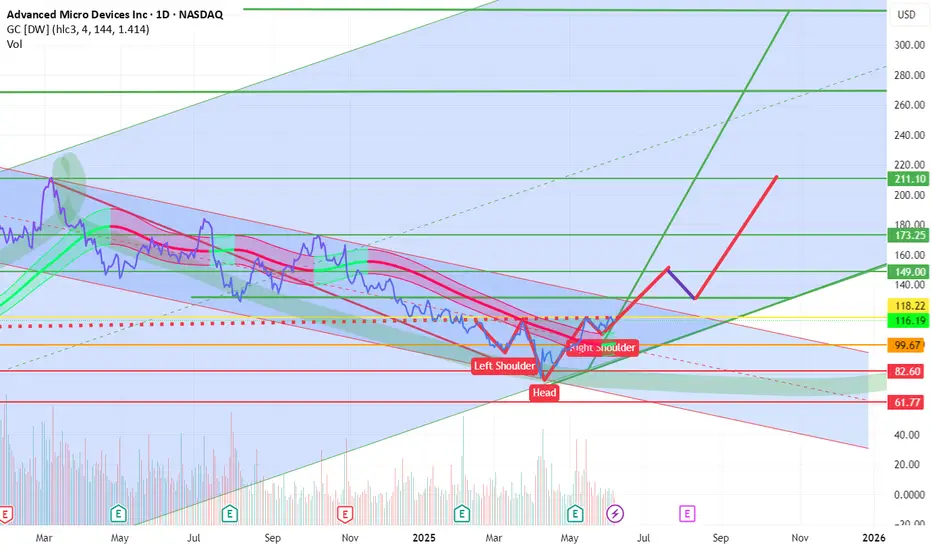
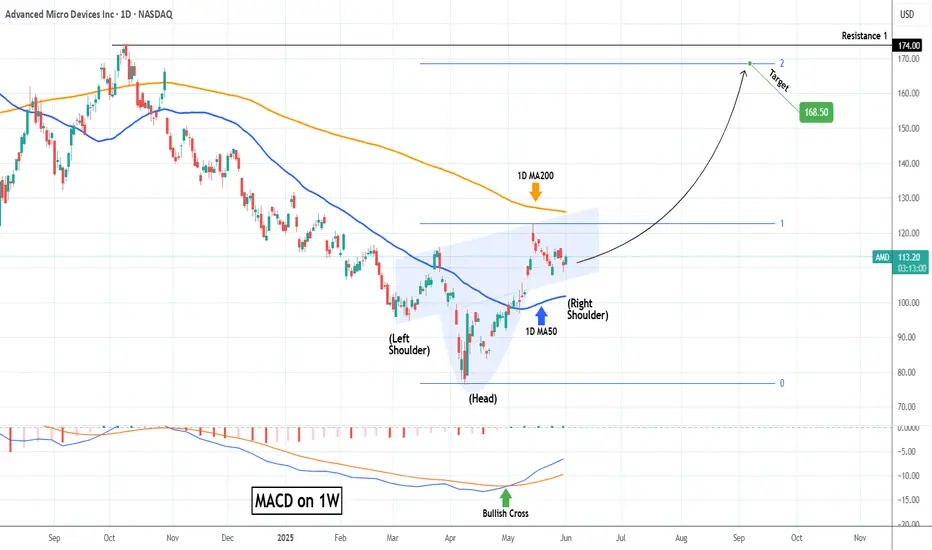
AMD Inverse Head and Shoulders waiting for massive break-out.Advanced Micro Devices (AMD) has entered a wide consolidation range within the 1D MA50 (blue trend-line) and 1D MA200 (orange trend-line) following the May 14 High. From a wider scale, this is technically seen as the Right Shoulder of an Inverse Head and Shoulders (IH&S) pattern.
This is generally a bullish reversal pattern and it is no coincidence that the Head was formed exactly on the market bottom (April 08). With the first long-term buy signal already given by the 1W MACD Bullish Cross, as long as the 1D MA50 holds, a break above the 1D MA200 would confirm the next rally phase.
Technically when the Right Shoulder break-outs take place, they target the pattern's 2.0 Fibonacci extension. That's now exactly at $168.50 and this is our medium-term Target.
-------------------------------------------------------------------------------
** Please LIKE 👍, FOLLOW ✅, SHARE 🙌 and COMMENT ✍ if you enjoy this idea! Also share your ideas and charts in the comments section below! This is best way to keep it relevant, support us, keep the content here free and allow the idea to reach as many people as possible. **
-------------------------------------------------------------------------------
💸💸💸💸💸💸
👇 👇 👇 👇 👇 👇
$AMD $120 retest then $130 push through. R/R looks incredible..Hello, NASDAQ:AMD Advanced Micro Devices, INC looks TASTY. I'm almost salivating. NASDAQ:NVDA may take a backseat and NASDAQ:AMD could start seeing monster upside. Something in my gut is telling me this name wants to GO. I'm looking at $120c for 6/20 and $130c for 6/20. This thing can launch.. it's hanging on an upside trendline, it may break but this $110 area may represent local support. Earnings report were good and after an abysmal 2024 after having highs and totally wiping them out hitting lows of $80, I think this could be the time for NASDAQ:AMD longs. It has taken the 20 day EMA/SMA over and now could curl to the 200 day EMA/SMA. 200 SMA is $126. This seems like a really good setup especially R/R here. Very cheap calls for a name that can see a 10-15% week.
WSL.
AMD breaking outAMD entered the 96 to 115 box like a rocket, and it is now showing a lot of strength after being dormant for a while.
The conditions are now there for a gradual run-up towards the 172 level. If it comes back below the 96 mark, I would argue that the movement has aborted.
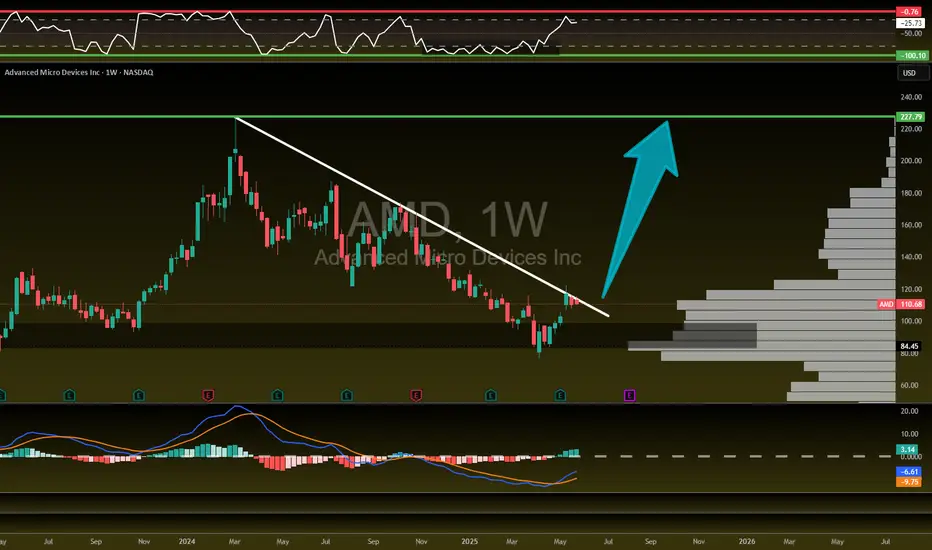
$AMD When, not IF! 105% UPSIDENASDAQ:AMD - It's not a matter of if, but when...🚀
Once this downtrend on the weekly is broken out of with a big fat engulfing candle we will launch off this volume shelf like a SpaceX rocket to mars!
All indictors are curling up and I think the time is coming for AMD to make their ascent higher and back to ATHs!
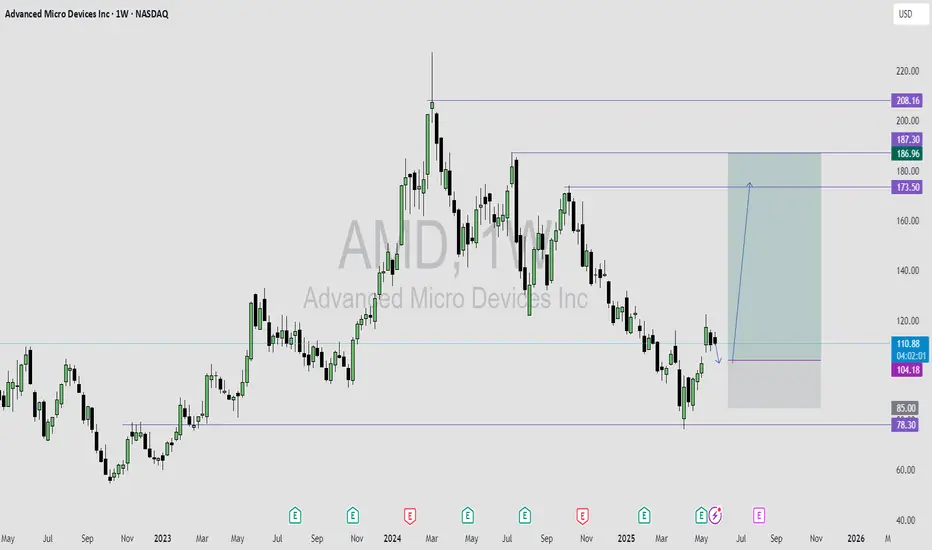
AMD LONG IDEA: AMD IS READY FOR A GOOD BULLISH RUNAMD is bouncing off the monthly time frame key level that is acting as support for price.
On weekly time frame and daily we had a shift in market structure from bearish trend to bullish.
I will be buying AMD on this retracement to the recent weekly gap created by price.
Once I see a good bullish price confirming that the retracement is over, i will enter for a buy trade.
My overall target is the 187 price level.
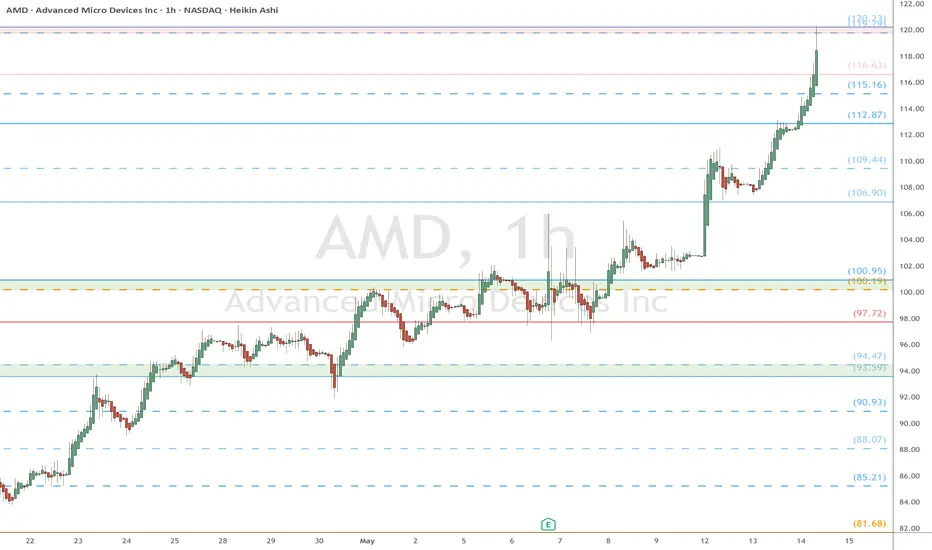
AMD heads up at $120: Buyback news spiked into ResistanceAMD recovering well and buyback news spiked it today.
Currently testing a key resistance zone $119.79-120.23
Look for a Dip-to-Fib to Break-n-Retest for long entries.
Quick View: $AMD-Strong bullish trend. on the 1h chart
- Bullish crossover on the dailly with pullback on the go
Watching $151 as key resistance.
Support → $106.50

Establishing Real-Time Price Action! 1). With Huge Wave 1, price typically will go to the previous high! 2). Buy corrective waves 2 & 4 Blue candles on smaller time frames! 3). Sell corrective waves ABC Black candles on smaller time frames! 3). Always use a FIB. tool for projections, based off a previous move! 4). Keep an eye on the gold line indicator, which is the liquidity provided by Banks for direction! 5). Check fundamentals, as Earnings were high, which pushes up price! 6). Establish a trend line based off the first two Candes! 7). Establish a relationship with Volume profile and Retail candles 8). Observe the multicolored Specialist line indicator, which reveals fair price! 9). Use this approach on any Instrument 10). Contact me for additional coaching!

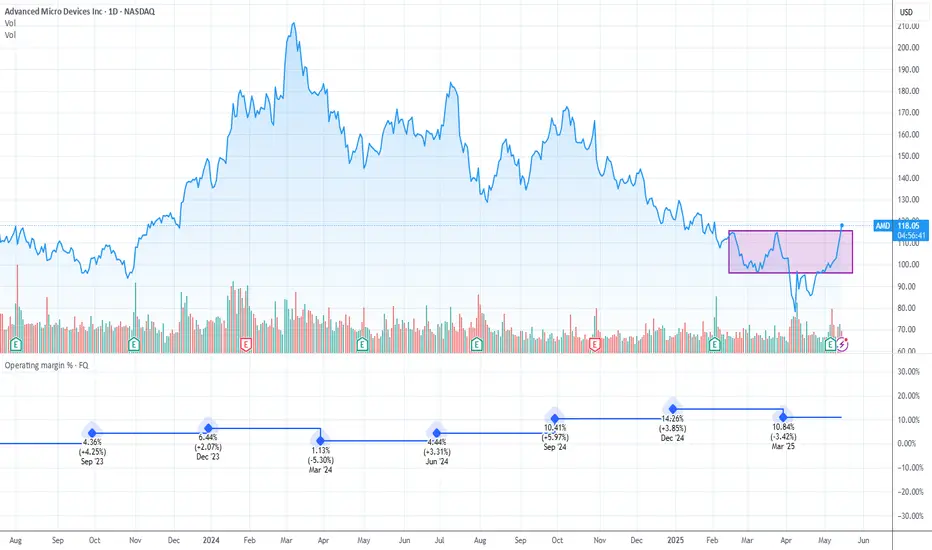
AMD: Short and Long Position IdeasThe current market structure indicates a potential bullish reversal within a broader descending channel. Following a previous decline of approximately 12.76% (−14.11 points), the price has staged a notable recovery, rallying 17.53% (+16.96 points) from a key horizontal support zone near 93.61. This area has historically acted as a demand zone, validating its significance with multiple touchpoints and a recent strong reaction.
Currently, the price action is approaching a critical resistance zone near 115.81, which also aligns closely with the upper boundary of the downward sloping blue channel. A sustained breakout above this resistance would constitute a technical breakout from the bearish structure and could signal a shift toward a medium-term bullish trend. In such a scenario, the next target would be the horizontal resistance zone around 120–122, supported by previous highs and structural confluence.
From a trade setup perspective, a long position could be considered on confirmation of a breakout and close above 115.81, with a target range of 120–122. A more conservative entry may be planned on a retest of the breakout level (115.81) as new support. Stop-loss levels could be strategically placed below the most recent higher low or the green support band near 105 to maintain a favourable risk-reward ratio. Conversely, failure to break above the resistance could trigger a reversion back to the mid-channel zone or retest of the 93.61 support level, favoring a range-bound or mean-reversion strategy in the short term.
Overall, the chart suggests a tactical bullish bias, contingent on breakout confirmation and broader market momentum.

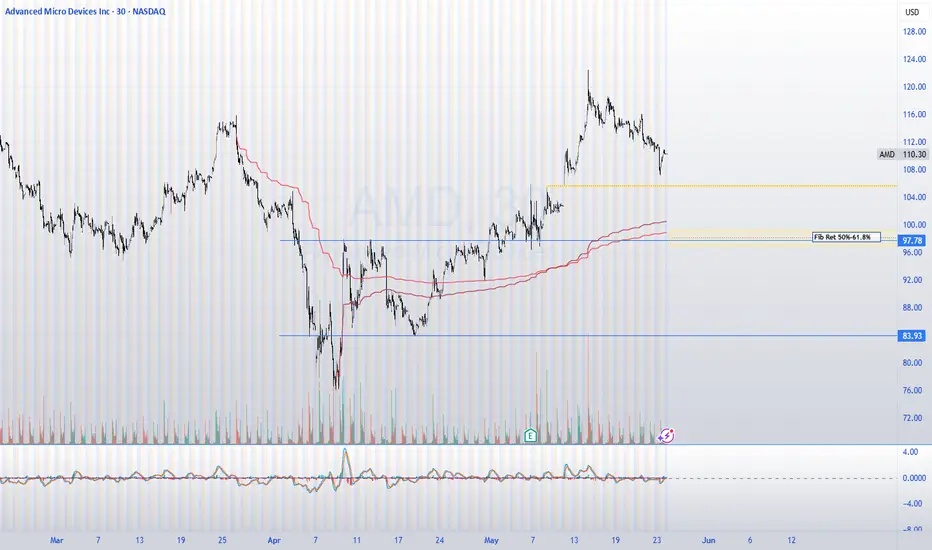
$AMDWatching NASDAQ:AMD closely tomorrow pre-market.
🔍 Key level: $105
✅ If it holds as support, expecting upside toward $112–$114 and possibly $120.
❌ If $105 fails, likely continuation of pullback toward the $100 area.
📐 That’s the 50%–61.8% Fib retracement zone — potential support for the next leg up.
Chart attached for visual reference.
#AMD #Stocks #Trading #TechnicalAnalysis #SupportResistance
AMD LONG IDEAAMD stock has been in a downtrend for a while. This is also confirmed with the awesome oscillator being in oversold region. However, there's a breakout of the downtrend. This is also supported with price breaking and closing above a support level. An aggressive trader or investor can buy at the current market price. While a conservative trader or investor can wait for price to pull back to the support level before buying.
The entry will be 101.70 while the stop will be 76.05 and the final target will be 226.77.
Confluence for this signal are as follows:
1. Awesome oscillator in oversold region
2. Awesome oscillator divergence
3. Downtrend breakout
4. Weekly bullish candle closing above down trend line and support level.
5. Price respecting uptrend
Disclaimer: This is not a financial advice. The outcome maybe different from the projection. If you can't accept the risk, don't take the signal.


AMD analysis What I’m seeing here is that the price made a false breakout below the 200 EMA, just like it did in the previous move back in early 2023. It dipped below, tricked a lot of people, then snapped back up strong.
Now it’s kind of repeating that same behavior another fake break below the 200 EMA and a bounce If history repeats we might see a similar upside move from here.
Just my personal view — not financial advice. Markets are unpredictable, so always be cautious.

AMD DAILY CHART NEEDS A WAVE 5 NORTH TO COMPLETE THE MOTIVE WAVECharts like the 27.8% Fib level even more than the 61.8 Golden Ratio! Also, the Bank Liquidity shown by the Golden line indicator is selling, so it's likely a market manipulation north on retail candles, creating a Bull-Trap on wave 5 before the drop! Since it's very risky at the moment to go Long, we're going Short at 127!

AMD Shorts?Already out of the intraday positions. Looking at this for possible short opportunity. The technicals are there to support the setup even though indices are bullish. Risk free on this trade and will take partials along the way, doesn't need to hit full TP. Indices retracements can favor this trade.