Coinbase Shares Rise Following Stablecoin Legislation ApprovalCoinbase (COIN) Shares Rise Following Stablecoin Legislation Approval
Shares in Coinbase Global (COIN) surged by 11% yesterday, making the company the top performer in the S&P 500 index (US SPX 500 mini on FXOpen).
The sharp rise was driven by news that the US Senate has approved the GENIUS stablecoin bill, which sets out a regulatory framework for the use of stablecoins — crypto assets whose value is pegged to another currency or financial instrument, such as the US dollar.
The bill (which still requires approval from the House of Representatives) would pave the way for banks, fintech companies, and other financial market participants to use stablecoins. This development acted as a strong bullish catalyst for COIN shares.
Technical Analysis of Coinbase (COIN) Share Price Chart
In our previous analysis of the COIN share price chart, we:
→ identified an ascending channel (shown in blue);
→ suggested that the COIN share price could rise towards the psychological level of $300.
That projection has played out — the price is now very close to the $300 mark. So, what comes next?
In a bold, optimistic scenario, buyers may hope for a continuation of the rally, with the share price pushing towards the upper boundary of the long-term ascending channel, especially following the recent news. In the medium term, the blue ascending channel may remain relevant, given the strong signal of improved cryptocurrency regulation in the US legislative framework.
However, we also note some vulnerability to a pullback, as:
→ the $300 level may act as significant resistance;
→ the price is approaching the upper boundary of the blue channel, which also shows resistance characteristics;
→ once the initial wave of positive sentiment fades, some investors may look to take profits, especially given the more than 20% rise in Coinbase (COIN) shares since the beginning of the month.
This article represents the opinion of the Companies operating under the FXOpen brand only. It is not to be construed as an offer, solicitation, or recommendation with respect to products and services provided by the Companies operating under the FXOpen brand, nor is it to be considered financial advice.
COIN trade ideas
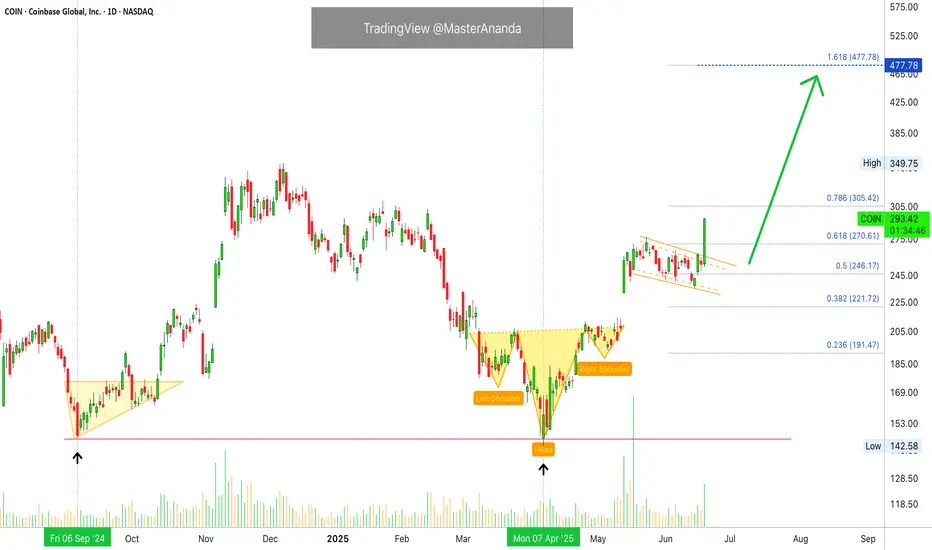
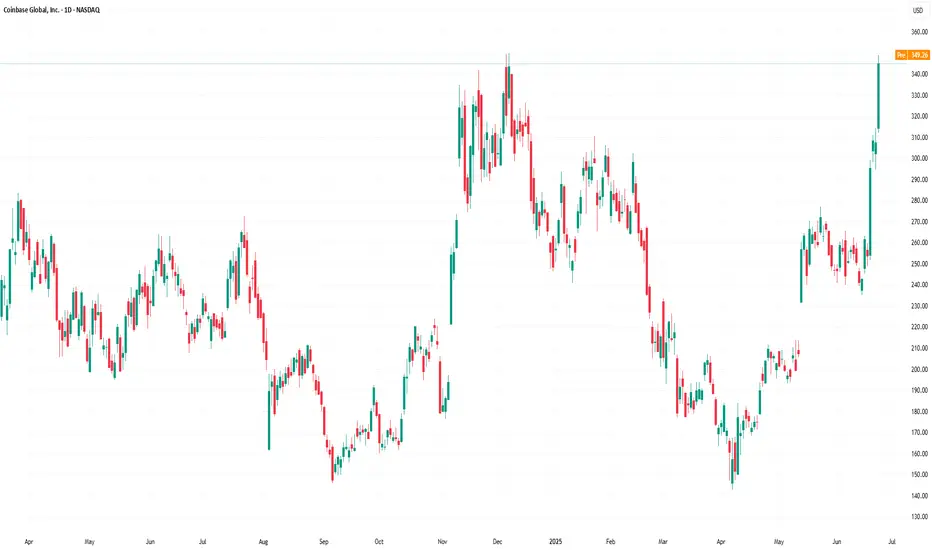
Coinbase Global Inc. Bullish Confirmed Confirms Bullish BitcoinCOIN's chart looks very similar to Ethereum. Today's action reveals something great; bullish confirmed.
Always, since this stock started trading, it has been moving as a unit together with Bitcoin and the entire Cryptocurrency market.
When Bitcoin is bullish, Coinbase is bullish.
When Bitcoin is bearish, Coinbase is bearish and vice versa.
Here we have a very strong, high volume bullish breakout on COIN. This means that Bitcoin, Cardano, Ethereum, XRP, Dogecoin, Avalanche and the rest of the Cryptocurrency market is about to break bullish really strong.
There was a low point 7-April 2025. The same with the projects I just mentioned above.
Here this 7-April low marks a double-bottom compared to September 2024. After this low, the recovery starts and we have a strong rise.
In late May, there is a price peak and we enter a consolidation phase, in this case a small retrace. The chart is identical to ETHUSDT.
After a strong higher low, some minor bearish action with no bearish pressure, Coinbase is going up. You can expect the exact same dynamic happening to Bitcoin and all the Altcoins. Bullish confirmed. The market will resolve green.
Today Coinbase hits the highest price since February 2025.
Namaste.
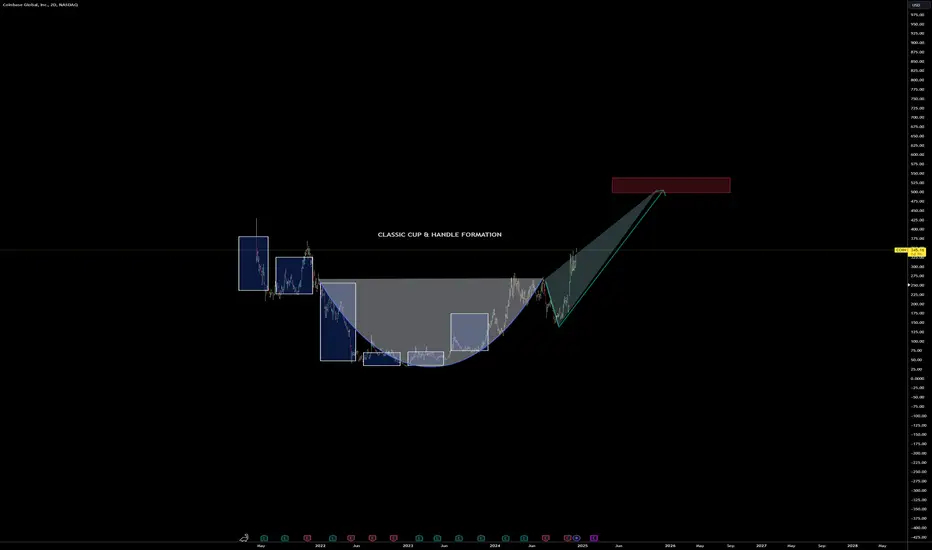
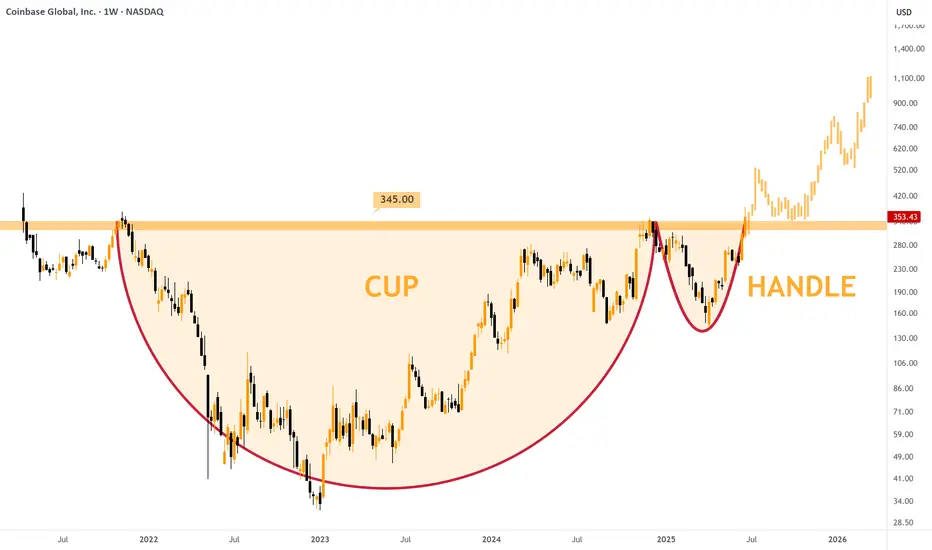
COIN- Cup and Handle FormationThere is more to this, but the basic formation is here. Other systems seem to also support the formation (such as Gann, and Harmonics).
There are a few 6 month candles overlaid in the entry to this that I was creating- illustrating the 6 month gains to form the cup. The handle portion did catch me off guard as we are typically use to seeing a cup form at the initial correction, but this one seems to have formed inside of the down move (very interesting).
Lets see how it works out. If true- its 50% gain on the bone here.
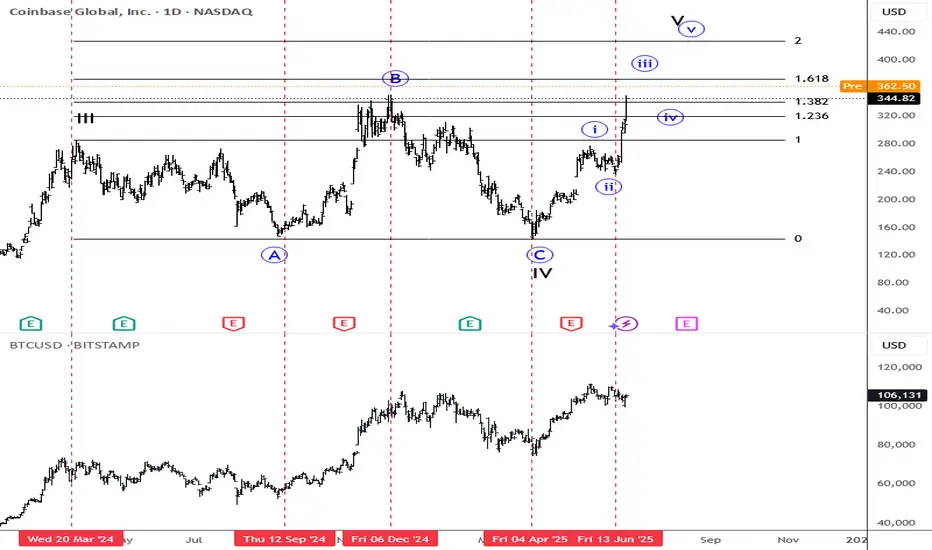
Coinbase Breaking Higher, Bitcoin To Follow Soon? Coinbase has been trading very nicely to the upside over the last two weeks, and it's now even breaking the previous highs from December in pre-market. This suggests we’re in a fifth wave, but even this leg should be structured by five waves, so there’s room for more upside—even above the 400 level. If we respect the past cycles and compare it with Bitcoin, then clearly Bitcoin is lagging here. Still, while Coinbase is in this bull run, sooner or later, Bitcoin should also join the strength.
Coinbase (COIN) Shares Hit Year-to-Date HighCoinbase (COIN) Shares Hit Year-to-Date High
As we reported six days ago, shares of Coinbase Global (COIN) received a strong bullish boost after the US Senate approved the GENIUS bill, which sets out regulations for the use of stablecoins.
As the Coinbase Global (COIN) stock chart shows, the rally is ongoing. Yesterday, the price surged by over 12%, once again becoming the top performer in the S&P 500 index (US SPX 500 mini on FXOpen).
Bullish sentiment is being fuelled by news that:
→ Two funds managed by Cathie Wood’s Ark Invest acquired around 4,200 Coinbase shares;
→ Analysts at Benchmark raised their target price for Coinbase Global (COIN) from $301 to $421.
Could the COIN share price continue to rise?
Technical Analysis of the Coinbase (COIN) Stock Chart
From a broader perspective, the COIN share price has formed an ascending channel over the past year (marked in grey), and only once — in reaction to news about Trump tariffs — did the price briefly fall outside of this channel.
Based on this, it is reasonable to assume that the developing intermediate rally (highlighted in blue) could reach the upper boundary of the grey channel. However, the psychological level of $350 — near the 2024 peak — appears to be a significant resistance point on this path.
It is possible that we will soon see this level act as resistance on the COIN stock chart, leading to the formation of a correction — which would seem appropriate after a nearly 40% price increase since the start of the month.
This article represents the opinion of the Companies operating under the FXOpen brand only. It is not to be construed as an offer, solicitation, or recommendation with respect to products and services provided by the Companies operating under the FXOpen brand, nor is it to be considered financial advice.
$COIN — Most Bullish Stock NowThe title of the idea is not lying, NASDAQ:COIN offers one of the most bullish charts I've seen on the stock market in a while - there is a HUGE Cup & Handle pattern.
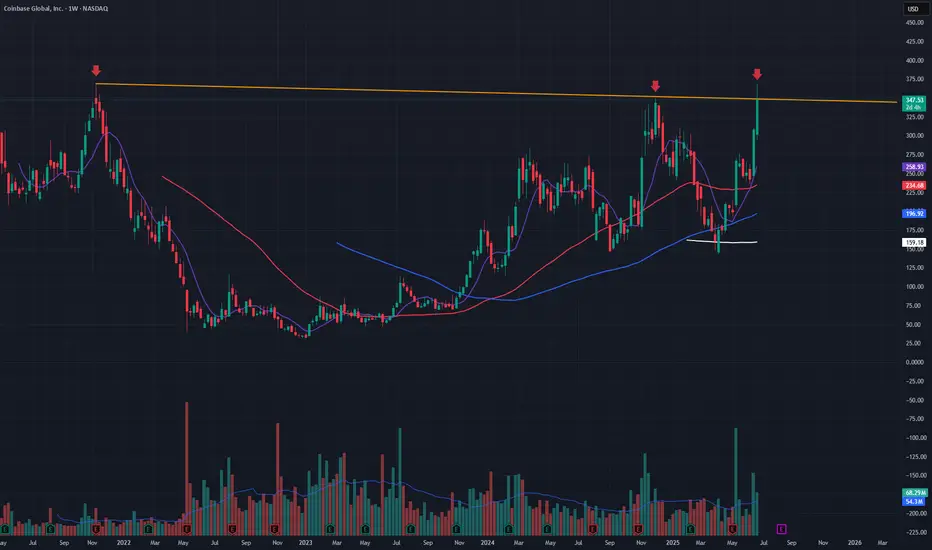
On the 1W charts we can see a multi-year rounding bottom that began in late 2021, followed by a clean handle consolidation and a breakout above the $345 neckline. The breakout of the $345 neckline implies long-term targets between $650 and $1,000 if momentum persists.
Fundamentals of the company suggest a sharp growth as well:
NASDAQ:COIN joined the S&P500 Index which attracted money from thousands of investors
Launch of Coinbase Payments, tapping stablecoin growth (USDC revenue up ~31% QoQ to ~$296M), perfectly fit for the narrative about stables in USA
Coinbase's most recent earnings show strong growth: in Q1 2025, the company generated about $2.0 billion in total revenue, reflecting a substantial 24% year-over-year increase
To sum up, I can find zero reasons why you shouldn't have this stock in your mid-long-term portfolio.
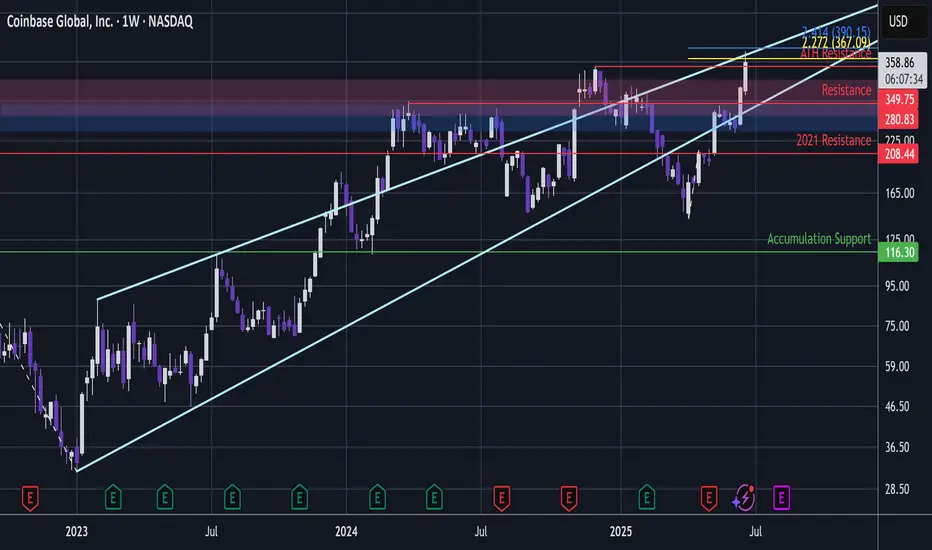
COIN - Looks Cooked, Let's Go ShortCOIN
Is suddenly slumping from a major point of high liquidity:
- It is above ATH resistance
- It is hitting a long term ascending trendline take from the first two significant peaks of the bull trend.
- It has pivoted within a reverse 2.272 Golden Window (up to 2.414) taking the 2 pivots at the base of the minor degree uptrend.
Coinbase has been on a significant rally in this area ahead of other Bitcoin Treasuries that have been corrective.
But if it gains momentum, then we may see some significant downside.
I entered a short and have may let it run a little if it made a new high;- this is a low margin entry 👍.
This analysis is shared for educational purposes only and does not constitute financial advice. Please conduct your own research before making any trading decisions.
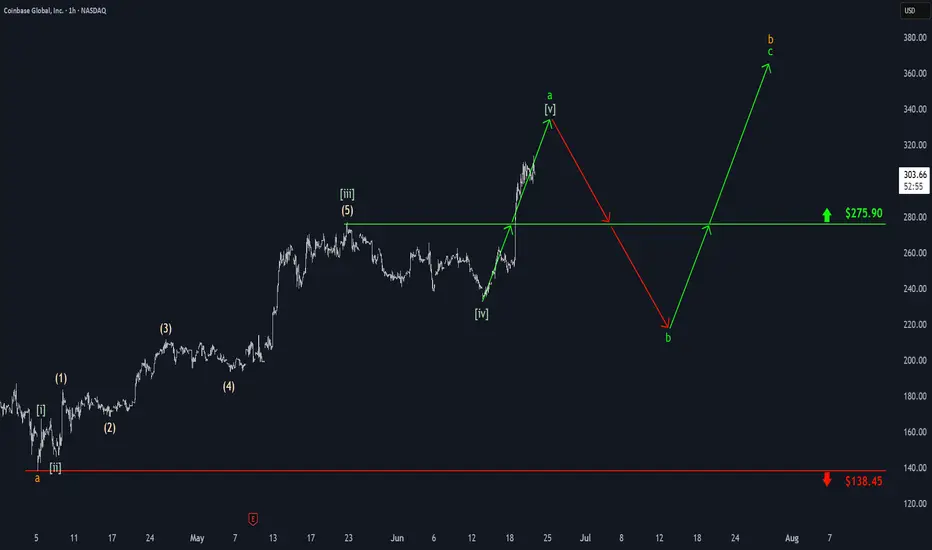
Coinbase: Surging HigherCoinbase has surged sharply above the $275.90 level, prompting us to consider green wave finished. Now, we see the stock advancing in wave , which still has more upside potential to finalize light green wave a. Afterward, we expect a corrective pullback in wave b, which may dip below $275.90, before green wave c resumes the advance, thus completing orange wave b distinctly above $275.90.
📈 Over 190 precise analyses, clear entry points, and defined Target Zones - that's what we do.
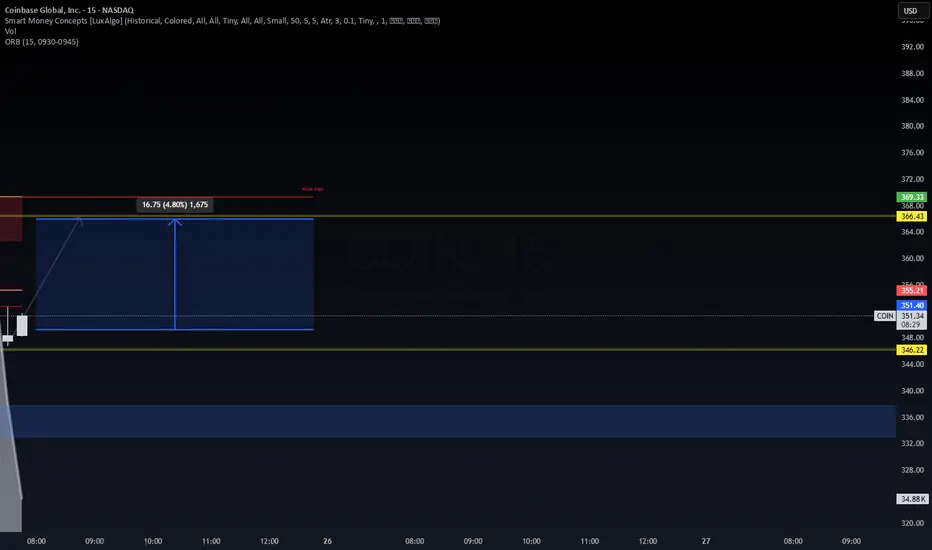
COINBASE 15-min Day Trade | Targeting 4.8% Upside IntradaySmart Money play in motion.
🔹 Entry Zone: ~$349.90 (ORB bounce + Fib retrace confluence)
🔹 Target: $366.43 (liquidity above weak high + 0.886 Fib zone)
🔹 Risk: Below $346.22 (prior BOS level)
📊 Setup Logic:
Volume spike post-ORB confirms demand.
Price retraced into golden pocket (0.618–0.786) with rejection wicks.
Fib symmetry aligns with intraday premium zone.
Clean 4.8% potential move with smart money footprint confirmation.
✅ Scalpers and day traders should monitor PA closely around 356–359 for possible rejection or continuation. Adjust stops as trade develops.
⚠️ Educational purpose only. Trade your plan, not hype.
#COIN #DayTrading #SmartMoneyConcepts #ORB #Fibonacci #VolumeProfile #PriceAction #CryptoStocks #WaverVanir #IntradaySetup #TradingView
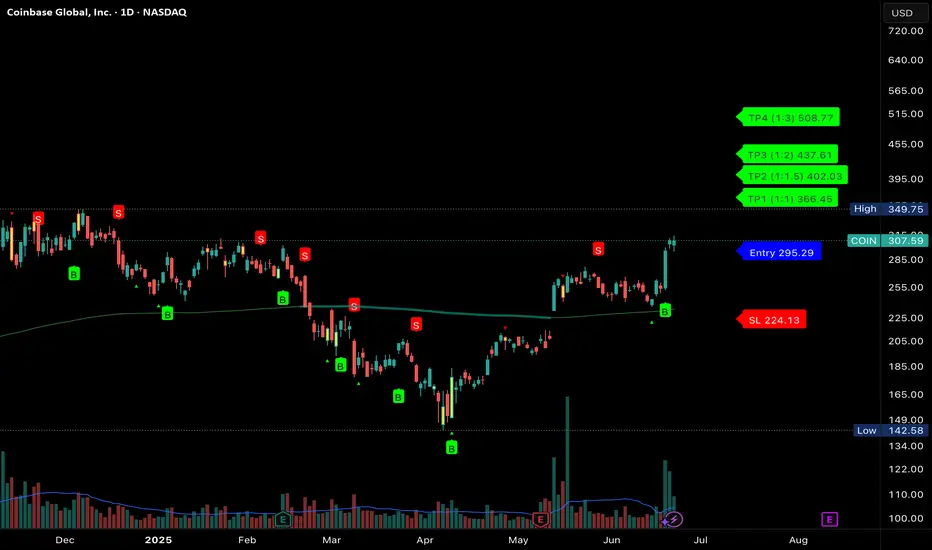
Coin base breakout on high volume Coin base is at the entry on the daily. With positive news in the market gives up bullish sentiment. Targeting TP3
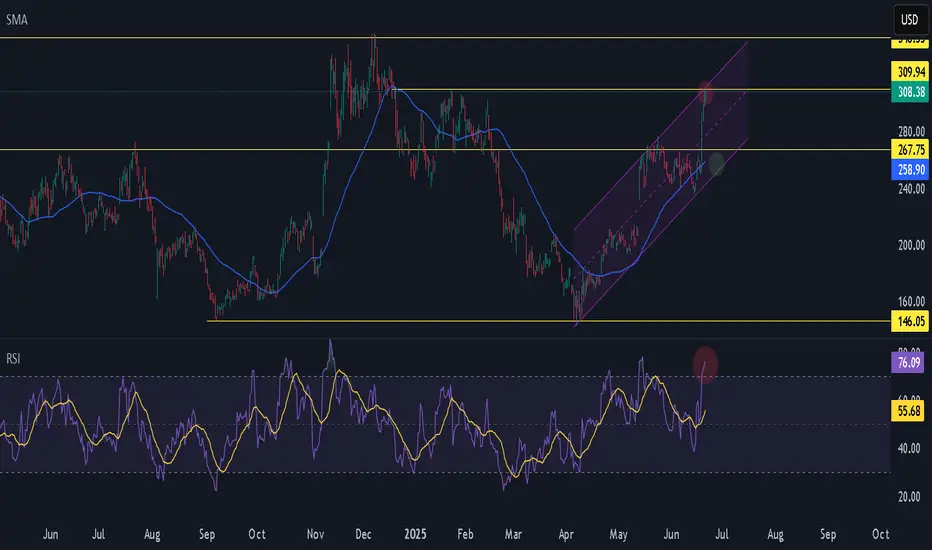
COIN Stock: Key Resistance Levels and Growth Catalysts AheadCoinbase (COIN) stock has been on a strong uptrend recently.
Technically , the stock is trading above the 50- and 200-day averages. The RSI level has reached 77, indicating that it has entered the overbought zone. In the short term, the $310 level stands out as a critical resistance. If this level is broken upwards, targets can be set at $348 and above. In possible corrections, $265 can be monitored as a strong support.
The “GENIUS Act” stablecoin regulation passed by the US Senate was a major catalyst for Coinbase, and the stock rose 16% after this news. In addition, the company obtained a crypto license from the European Union and expanded its services across the EU. It also made a strong entry into the derivatives market with the acquisition of Deribit. All these developments enable the company to grow its product diversity and global footprint.
Overall, COIN stock is technically strong and in a bullish phase, supported by fundamental data. '' Although there is a possibility of a short-term correction due to the high RSI '', the company's medium- to long-term growth story sends positive signals to investors. While the $250-$265 range can be monitored for buying, a strong rally may start if the $310 resistance is broken.
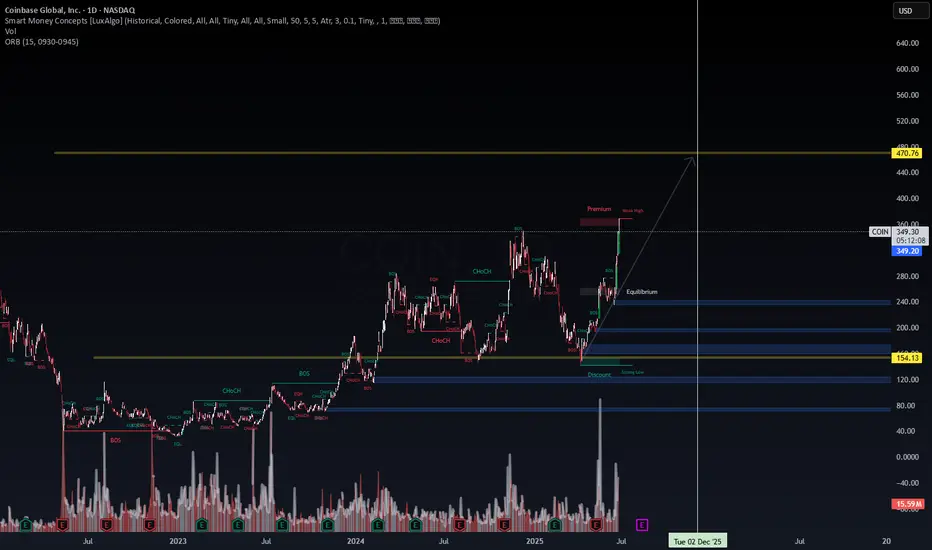
COINBASE (COIN) – Smart Money Accumulation Confirmed | Eyes on $The structure has shifted decisively.
🔹 Smart Money Concepts in Action
Price has reclaimed equilibrium, flipped BOS zones, and left behind a weak high in premium territory. Current PA suggests institutional accumulation with a clear intent to drive price towards inefficiency above $400, targeting the historical supply near $470.76.
🔹 Key Zones
Equilibrium: ~$240
Discount Zone (Demand): $154.13 - $200
Premium Zone (Supply): >$348
Volume Surge confirms conviction behind the breakout.
📌 Expect a reaction near $380–400, but if momentum holds, the liquidity vacuum toward $470 may get filled faster than most expect. Watch for continuation signals and manage risk accordingly.
💡 This is not financial advice – just tracking footprints of capital.
#COIN #Coinbase #SmartMoneyConcepts #SMP #VolumeProfile #VWAP #LiquidityGrab #TradingView #SMC #Equilibrium #BreakOfStructure #CryptoStocks #WaverVanir
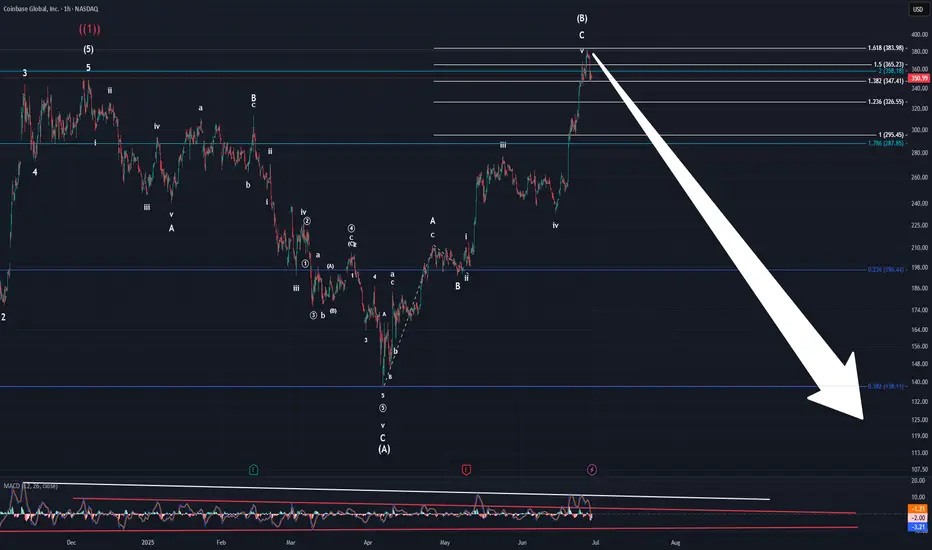
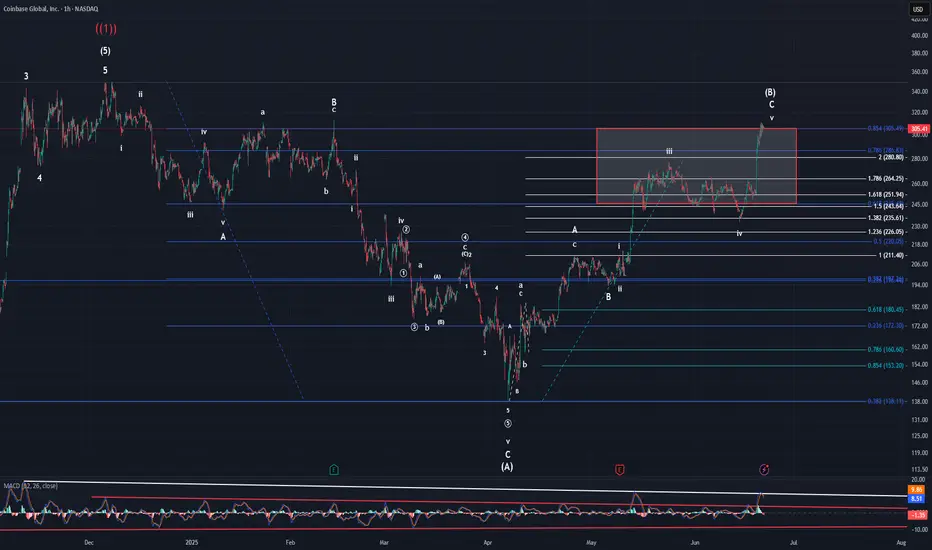
CoinbaseThere isn't much to add to my COIN analysis. Price hit just shy of the 1.618 and then reversed. Price dropped by almost 10% from that last high. This bodes well for the top being in and the irregular (B) wave pattern prevailing. We still have a lot of work to do to prove that is what is happening though. Until we can breach $277 followed by a breach of $232.85, we can't be for certain. Yes, we will have hints on the way down. However, these price points will be what confirms the pattern lower. As I said above, COIN has a lot of work to do to prove its intentions. This last move up I think is largely due to the end of the quarter, congressional legislation, and FOMO.
MACD is back to within the red trend lines and appears to be weakening to the downside. This shouldn't be too surprising given how far we fell last Friday. That move lower, has created a 3-wave move thus far. Another local low before starting a consolidation higher would create a 5-wave pattern bringing more clarity, but it isn't required.
Again, I don't want to see another high made above last Thursdays if (B) is to be correct. A new high itself doesn't invalidate an irregular (B), but it would cause me to become very skeptical of it.
When I said last week that COIN has a pivotal moment right in front of it, I wasn't kidding. It appears to have chosen a move lower for now, but it is not guaranteed to continue and we could always move higher again from here. Just be careful in whatever position you take, and use stops to protect your assets.
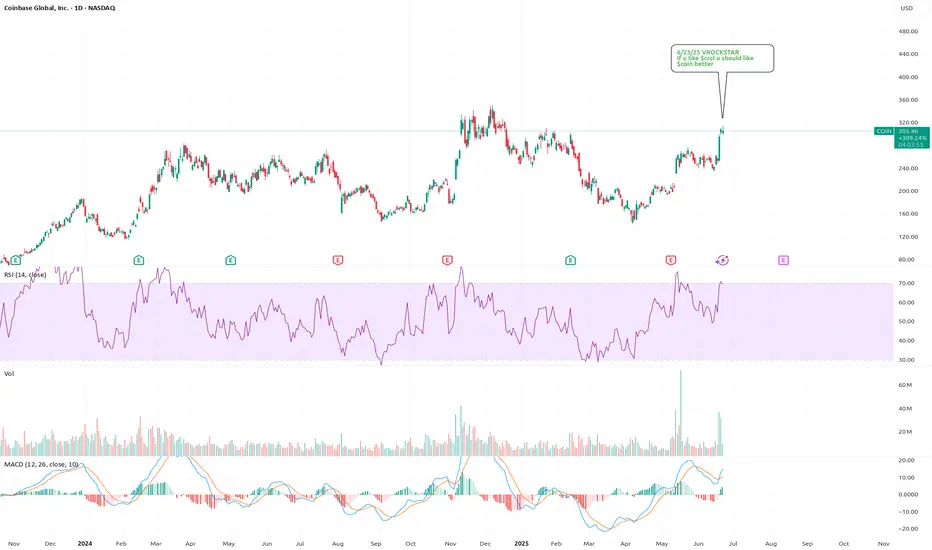
6/23/25 - $coin - If u like $crcl u should like $coin better6/23/25 :: VROCKSTAR :: NASDAQ:COIN
If u like NYSE:CRCL u should like NASDAQ:COIN better
- hard enough to own a lot of things long
- but NASDAQ:COIN basically keeps majority of the economics it generates w/ NYSE:CRCL 's chitstablecoin called USDC
- nevermind it's trading at a similar valuation with fin metrics that are literally MULTIPLES larger (3-5x) than NYSE:CRCL
- anyway.
- buy NYSE:CRCL at your own peril. and perhaps the more obvious pair here than even NYSE:FI would be long NASDAQ:COIN and short NYSE:CRCL (I have put this on FWIW)
- the idea would be to use NYSE:CRCL short profits to either move into cheaper NASDAQ:COIN or $obtc. if NYSE:CRCL continues to run, i'd guess the beta on NASDAQ:COIN is now going to catch a wind as well and IV is a whole lot cheaper (on the long side) and the nominal px's for each r roughly similar $300
- gl to all.
- stay frosty :)
V
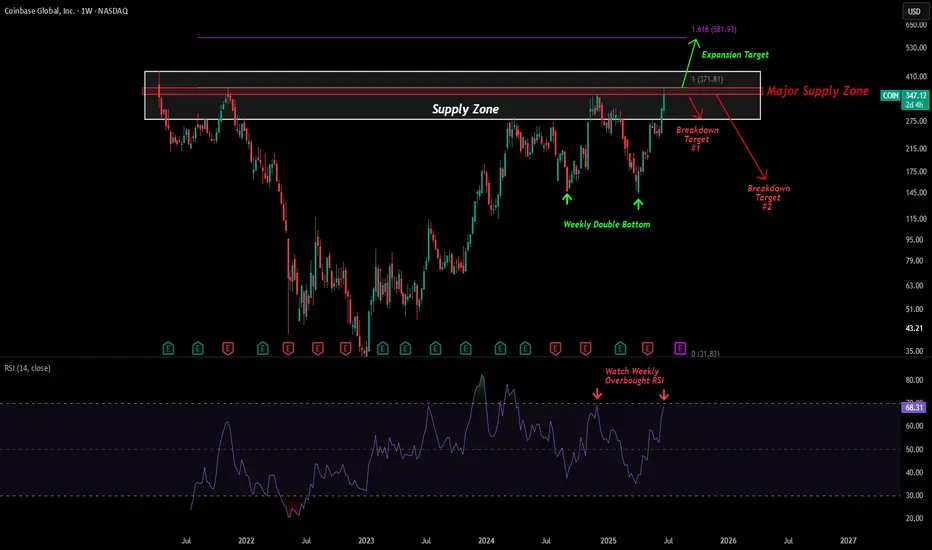
COIN - Entering Major Supply ZoneBig move from Coinbase — now pushing into a major weekly supply zone between $350–$370.
This zone has capped every rally since Q1 2022. Price tapped it during the 2024 crypto run and got rejected hard. Now we’re back — and weekly RSI is once again testing overbought territory.
This sets up two key scenarios:
*Scenario 1 – Breakout
A clean breakout above $370 would be significant. That level aligns with prior rejections and sits just below IPO highs near $430.
If $430 is cleared, the next target is the 1.618 fib extension near $580–600
This would likely coincide with Bitcoin pushing to new ATHs
*Scenario 2 – Rejection
If sellers defend this supply zone again:
Look for a pullback toward the $280 zone (bottom of the white box)
Lose that → next downside target is $160, just above the weekly double bottom that kick started the recent rally
*RSI is the wild card
Weekly RSI is knocking on the same level that preceded a 60% drop in late 2024. Last time we broke above it (early 2024), COIN rallied 90%.
Break or reject — the RSI will likely front-run the next move.
Circle Collapse - Will COIN follow? Circle stock has been on a wild ride lately
After a meteoric rise of over 700% since its IPO on June 5, it's now facing some turbulence:
- Today, the stock dropped nearly 16%, partly due to Cathie Wood’s ARK Invest selling $110 million worth of shares.
- Analysts are also sounding caution. Compass Point initiated coverage with a $205 price target—below its current trading price—citing rising competition in the stable coin space.
- Despite the dip, some still see long-term potential. A recent Forbes analysis explored whether Circle could hit $500 per share, driven by growth in USDC reserves and infrastructure revenue.

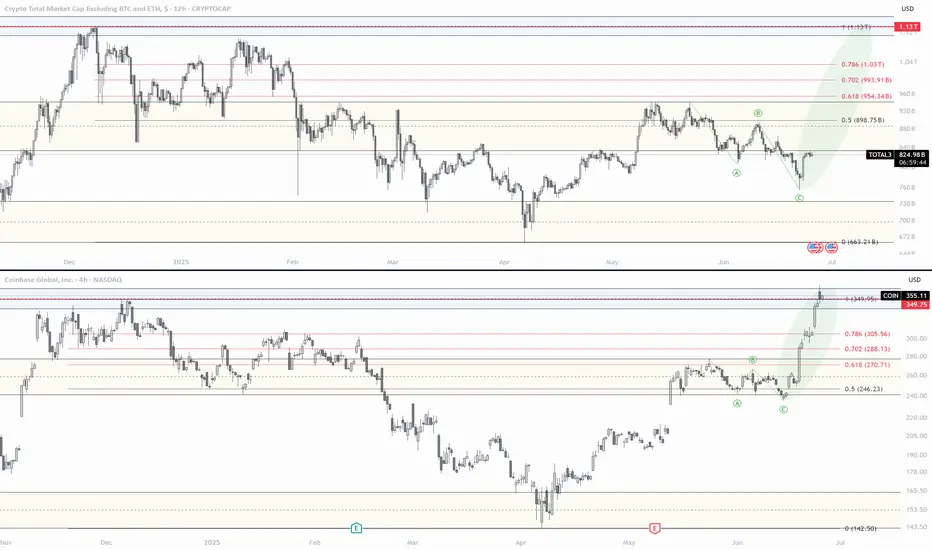
TOTAL 3 > Coinbase Leading IndicatorCoinbase (COIN) continues to outperform, with its chart pushing into new territory — just as TOTAL3, the index tracking the market cap of all crypto excluding BTC and ETH, edges closer to a breakout.
Coinbase overbought and into massive resistanceI've highlighted a major area of resistance on Coinbase going back 4 years to 2021. Was above the trendline earlier in the week and is now getting rejected. Good short opportunity. Will monitor this one. I just bought some CONI
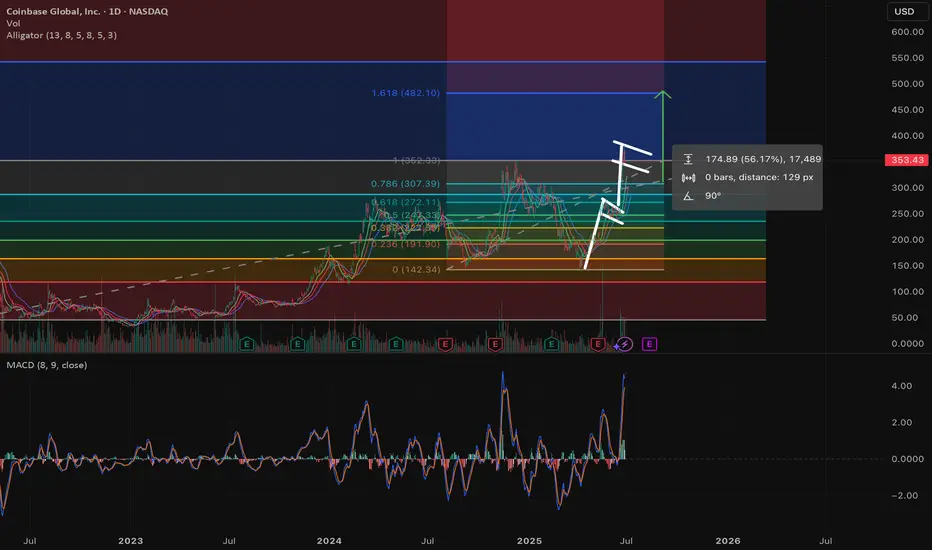
COIN Pullback or will lose steam ? Watch the levels for bouncesLet's dive into a technical analysis of Coinbase (COIN) stock with your requested indicators and patterns on a daily chart, as of Friday, June 27, 2025, at 9:27:54 PM PDT.
**Current Price & Performance:**
* **Last Price:** $353.297 (as of 4:00 PM ET on June 27, 2025)
* **Today's Change:** Down $15.779999 (-4.27399%)
* **Previous Close:** $369.21
* **Today's Range:** $346.66 - $372.50
* **52-Week Range:** $142.58 - $382.00
COIN has seen a significant run-up recently, up 44% in June, and was added to the S&P 500 in May, which has likely contributed to buying pressure from index funds. Today's session saw a notable pullback.
---
### **Bull Flag Analysis: Played Out & Potentially Forming**
A "bull flag" is a bullish continuation pattern that forms during an uptrend. It consists of:
1. **Flagpole:** A strong, sharp price increase (the "pole").
2. **Flag:** A period of consolidation, often a rectangular or parallelogram shape, with a slight downward or sideways slope, characterized by decreasing volume.
**The Bull Flag that Played Out:**
COIN has been in a strong uptrend in recent weeks and months, particularly in June. This sustained upward movement would have created multiple "flagpoles." As the stock consolidates after these sharp moves before continuing higher, those consolidation phases would represent the "flags."
Given COIN's significant increase of 44% in June and reaching near its 52-week high, it's highly probable that **a series of bull flags have played out** during its ascent. Each time COIN had a strong upward leg, followed by a brief period of sideways or slightly downward consolidation (the flag), it then broke out to the upside, continuing the overall bullish trend. This pattern aligns with its recent performance.
**Another One Potentially Forming:**
Today's 4.27% drop, coming after COIN hit multi-month highs, could be the *start* of a new "flag" formation.
* **New Flagpole:** The sharp run-up through June to the recent high of $382 can be considered the latest "flagpole."
* **Potential Flag:** The current pullback to $353.297 (and intraday low of $346.66) could be the initial phase of consolidation that forms the "flag." For this to be a classic bull flag, we would expect:
* **Consolidation:** The price to trade within a relatively tight, slightly downward-sloping or sideways channel for a few days or weeks.
* **Decreasing Volume:** Volume to typically decrease during this consolidation phase.
* **Breakout:** A subsequent breakout above the upper trendline of this consolidating channel, ideally on increasing volume, to signal the continuation of the previous uptrend.
**Right now, the pattern is very nascent.** It's too early to confirm a new bull flag, but the recent strong rise followed by a pullback fits the initial characteristics. Traders would be watching for the consolidation and then a clear breakout.
---
### **Williams Alligator Strength (Daily Chart)**
The Williams Alligator indicator uses three smoothed moving averages:
* **Lips (Green Line):** 5-period SMMA, shifted 3 bars forward.
* **Teeth (Red Line):** 8-period SMMA, shifted 5 bars forward.
* **Jaw (Blue Line):** 13-period SMMA, shifted 8 bars forward.
**Interpretation:**
* **Strong Trend ("Eating"):** When the lines are fanning out and ordered (Green > Red > Blue for an uptrend, or Blue > Red > Green for a downtrend), the Alligator is "eating" and the trend is strong.
* **Consolidation ("Sleeping"):** When the lines are intertwined or very close together, the Alligator is "sleeping," indicating a non-trending market.
**COIN's Alligator State:**
Given COIN's powerful rally through June, the Williams Alligator was undoubtedly in an **"eating" phase, with its mouth wide open upwards (Green line above Red, Red above Blue)**. This signifies strong bullish momentum.
Today's significant pullback (-4.27%) likely caused the **Lips (green line) to cross below the Teeth (red line)** or at least move very close to it. This indicates the Alligator is beginning to "sate" itself or move towards a "sleeping" phase.
* **Strength:** While the *overall* trend, as indicated by the wider separation of the Teeth and Jaw, might still be considered bullish on a slightly longer timeframe, the *immediate strength* as signaled by the Lips is weakening. The Alligator is likely no longer as aggressively "eating" upwards as it was.
* **Weakening Momentum:** The crossover of the Lips below the Teeth is a short-term bearish signal, suggesting a loss of immediate upward thrust. If the Red line also crosses below the Blue, it would confirm a more significant shift to a neutral or bearish trend.
---
### **Confluence of Two Fibonacci Retracements from Different Top/Bottoms**
Fibonacci retracement levels are typically drawn between a significant price high and a significant price low (or vice versa) to identify potential support and resistance levels. For confluence, we look for areas where different Fibonacci levels from *different* swings align, creating stronger price zones.
Let's consider two potential significant swings for COIN based on its recent price action and 52-week range:
**1. Recent Major Swing:** From 52-Week Low to Recent High
* **Low:** Approximately $142.58 (52-week low)
* **High:** Approximately $382.00 (recent high)
Applying Fibonacci retracement to this major upward swing:
* **23.6% Retracement:** $(382.00 - 142.58) * 0.236 + 142.58 = \$199.14$
* **38.2% Retracement:** $(382.00 - 142.58) * 0.382 + 142.58 = \$233.15$
* **50.0% Retracement:** $(382.00 - 142.58) * 0.500 + 142.58 = \$259.98$
* **61.8% Retracement:** $(382.00 - 142.58) * 0.618 + 142.58 = \$286.82$
**2. More Recent, Shorter-Term Swing:** From a recent consolidation low to the recent high
Let's consider a recent short-term low before the final push to the recent high. One source points to a swing low of **$294.56$ (June 23) to a high of $382$ (June 26).**
Applying Fibonacci retracement to this shorter-term swing:
* **23.6% Retracement:** $(382.00 - 294.56) * 0.236 + 294.56 = \$315.21$
* **38.2% Retracement:** $(382.00 - 294.56) * 0.382 + 294.56 = \mathbf{\$327.97}$
* **50.0% Retracement:** $(382.00 - 294.56) * 0.500 + 294.56 = \mathbf{\$338.28}$
* **61.8% Retracement:** $(382.00 - 294.56) * 0.618 + 294.56 = \mathbf{\$348.60}$
**Confluence:**
The current price of COIN is $353.297.
Looking at the second, shorter-term Fibonacci retracement, the **61.8% level at $348.60$ is very close to today's intraday low of $346.66$.** This indicates that this specific Fibonacci level acted as a significant support level today.
While there isn't a direct "confluence" where a 38.2% from one swing aligns perfectly with a 50% from another right at the current price, the fact that the **61.8% retracement from the most recent significant upward impulse ($294.56 to $382.00) provided strong support today** is a key observation.
**Significance:**
* **Recent Support:** The price tested and rebounded from the 61.8% retracement level of its most recent significant rally, which is often considered a strong reversal point for a healthy pullback within an uptrend.
* **Confirmation for Potential Flag:** If this level holds, it reinforces the idea that the current pullback is a "flag" in formation rather than a full trend reversal.
---
### **Overall Summary for COIN:**
* **Bull Flag:** COIN has experienced and completed several bull flags during its ascent. The current pullback from the $382 high could be the formation of **another bull flag**. For confirmation, watch for consolidation within a defined range and a subsequent breakout.
* **Williams Alligator:** The Alligator, which was "eating" aggressively during the recent rally, is now likely showing signs of **sating or sleeping** as the Lips (green line) cross below the Teeth (red line) due to today's pullback. This indicates a weakening of immediate bullish momentum and a potential period of consolidation or correction.
* **Fibonacci Confluence:** The price found strong support at the **61.8% Fibonacci retracement level ($348.60) of its most recent significant swing ($294.56 to $382.00).** This is a critical level for bulls to defend if the overall uptrend is to continue.
**Outlook:**
COIN is currently undergoing a healthy pullback after a strong run. The bullish underlying trend remains, supported by its S&P 500 inclusion and analyst optimism. However, the technical indicators suggest a period of consolidation or further retracement is likely. The $348.60 Fibonacci level will be crucial. If it holds, it increases the likelihood of the current pattern being a bull flag for another leg up. A break below it could lead to deeper retracements.
As always, remember that technical analysis provides probabilities, not certainties. Combining this with fundamental analysis and managing risk is crucial for any investment decision.
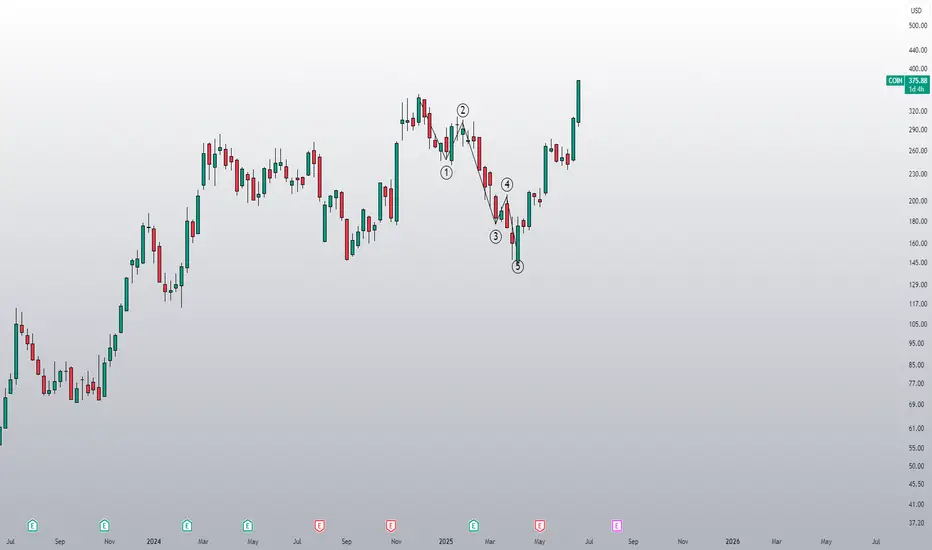
CoinbasePrice technically speaking has a full 5 waves with this latest move higher off the $240 low. I don't believe the micro-waves 4 & 5 are done yet though. MACD has reversed and looks to be heading down now, so I think that wave 4 will be kicking off starting Monday. Technically speaking, thus pattern could be complete, but my gut tells me that it is not. It is already overextended as it has breached the 0.854, but I still believe this is intermediate (B) due to the preceding price action.
In short, my primary is we get a slight move lower for 4 and then another slight high for 5 of v of C of (B). The ALT is that we head lower from here kicking off (C).
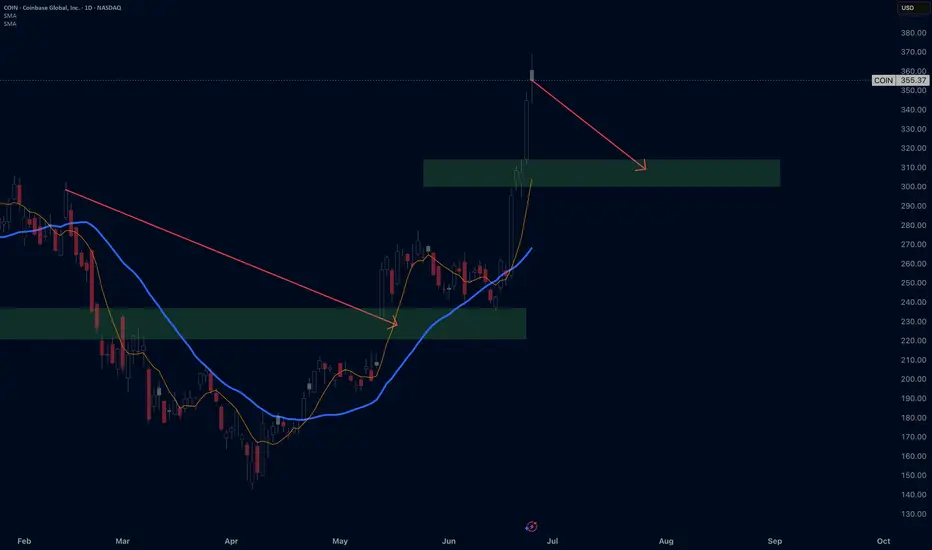
Short COINBASE $COINPlease do your own analysis, i am not responsible for your losses. Trading is risky.
This is daily candle, so when will it happen will take time, 1month or 1.5 month...can't know that.
Please don't tell me you traded and lost, you have to be careful.
The price will drop to the target green area..
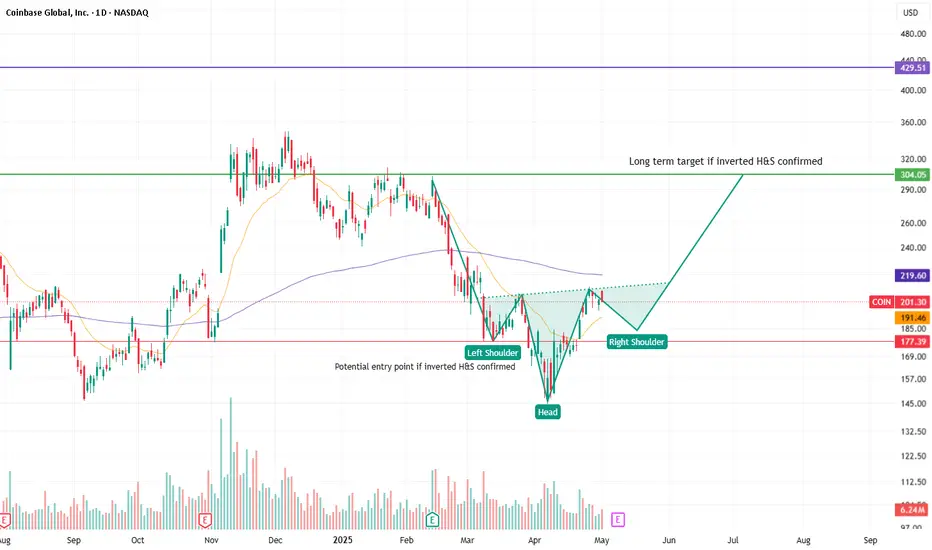
COIN potential +40% move up this year Potential inverted Head&Sholders forming with target to 300$ zone. But, before moving up it shall retrace a little bit.
Not financial advice, only for learning purpose published.