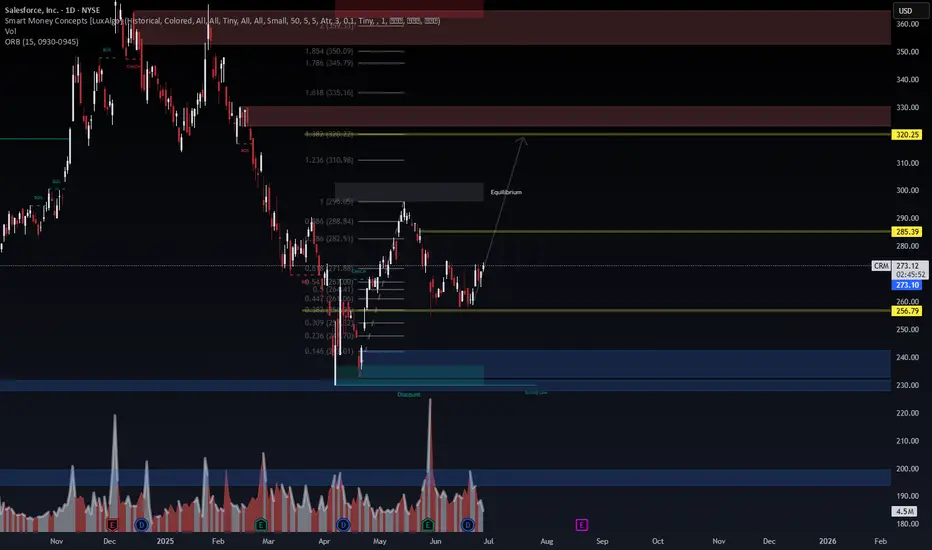
CRM: Bullish Imbalance Fill in Progress | Targeting Equilibrium 🧠 Salesforce (CRM) shows a clean price reaction from the 61.8–66% retracement zone after bullish CHoCH and internal BOS confirmations. Our Smart Money model detects a re-accumulation beneath prior imbalance zones, with a potential run toward the equilibrium range at ~296–320.
📍 WaverVanir Trade Pla
Next report date
—
Report period
—
EPS estimate
—
Revenue estimate
—
6.47 USD
6.20 B USD
37.90 B USD
931.17 M
About Salesforce
Sector
Industry
CEO
Marc Russell Benioff
Website
Headquarters
San Francisco
Founded
1999
FIGI
BBG00YFGCYP8
Salesforce, Inc. engages in the design and development of cloud-based enterprise software for customer relationship management. Its solutions include sales force automation, customer service and support, marketing automation, digital commerce, community management, collaboration, industry-specific solutions, and salesforce platform. The firm also provides guidance, support, training, and advisory services. The company was founded by Marc Russell Benioff and Parker Harris in 1999 and is headquartered in San Francisco, CA.
Related stocks
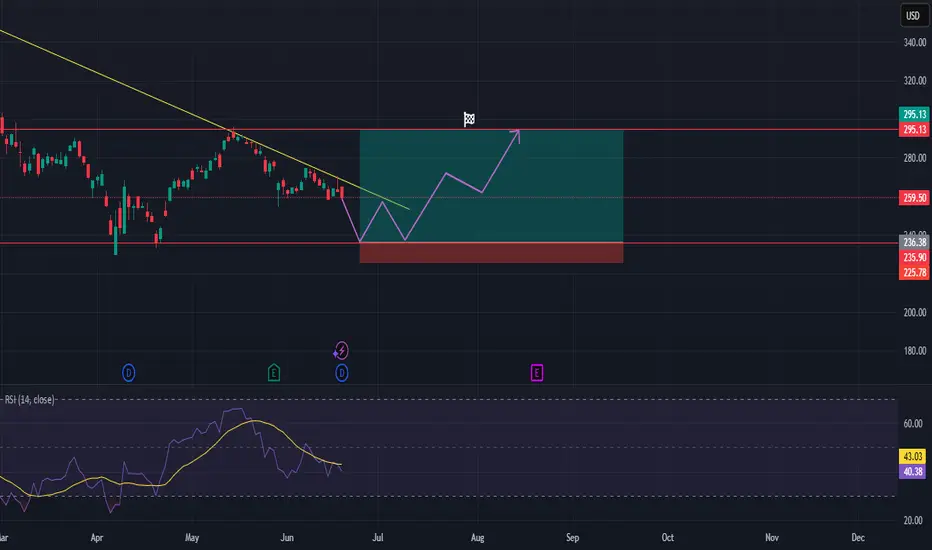
CRM long positionHi traders,
Let's have a look at 1D Salesforce, Inc chart.
The stock is currently in a short-term downtrend, but it's approaching a previous support zone.
We expect 1 more dip to retest the lows from April 2025. With this dip , the RSI should revisit an oversold condition.
The target is the resist
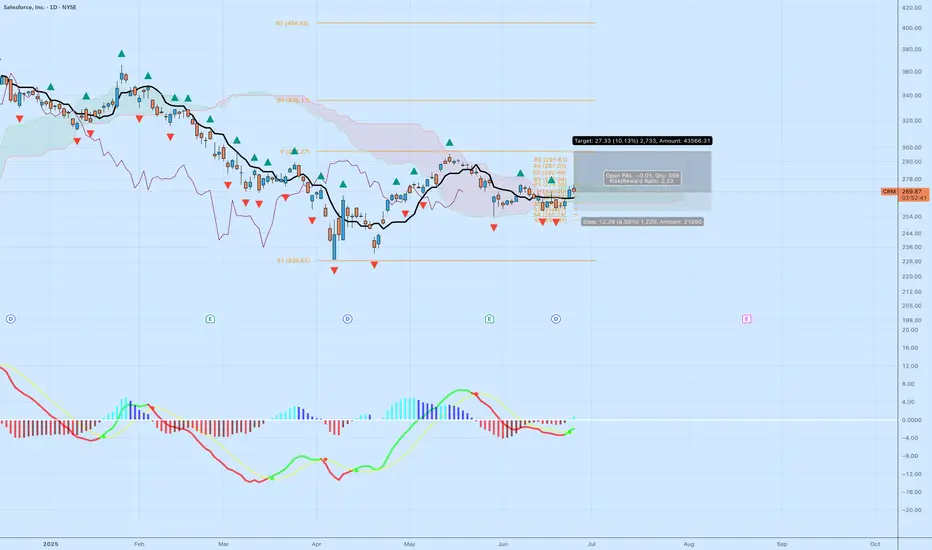
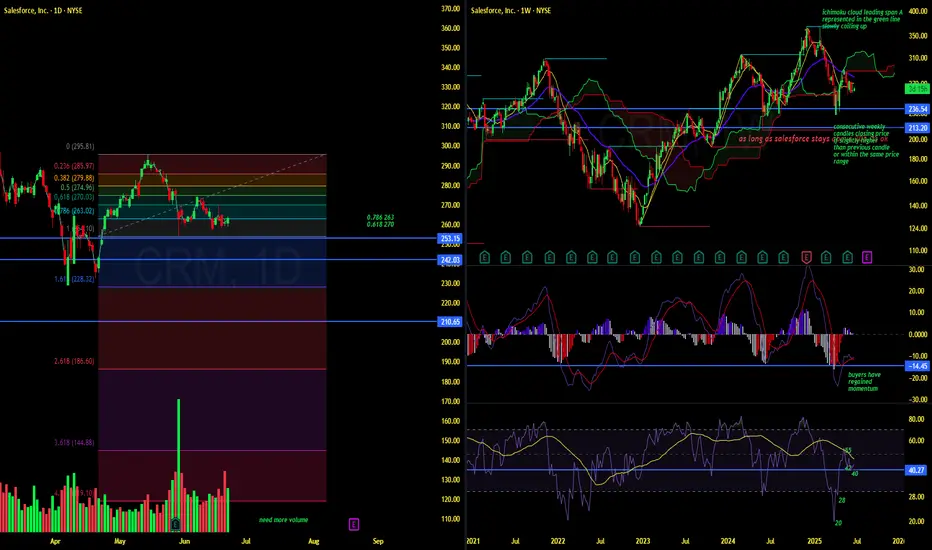
$CRM Long Setup – Coiling at Support with Breakout PotentialSalesforce ( NYSE:CRM ) is consolidating just below the Ichimoku Cloud and building a base around the $265–$270 zone. The MACD is showing early bullish crossover signals with momentum starting to shift, and the price action suggests a coiled spring setup. After multiple tests of the $265 area and a
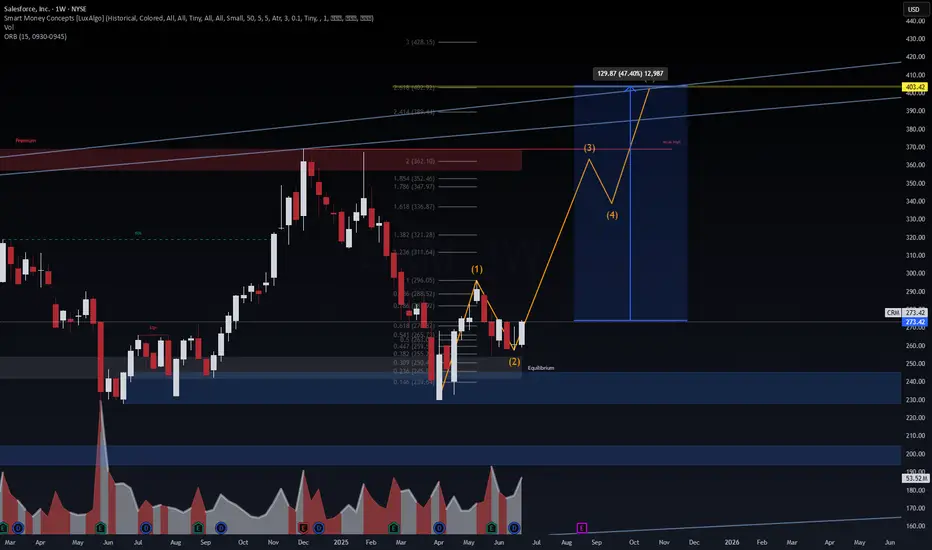
CRM: Wave Structure Analysis. WaverVanir International LLC · CRM Weekly Outlook · Published June 28 2025
Ticker: CRM | Chart: Weekly
🔹 Catalyst
• Q2 FY26 earnings on August 27 2025 after market close (TipRanks, 2025)
• Dreamforce conference mid September 2025
🔹 Macro Environment
• Fed likely to hold rates at July 30 mee
A force to be reckon with.CRM
The attached image will be of the daily and the weekly timeframe.
On July 2024 of last year the monthly candle of July 2024 had a high of 264.52. Currently in line with closing price of 263.41 today 06/24/25. Will price react the same way a year prior when volume from buyers picked up. The
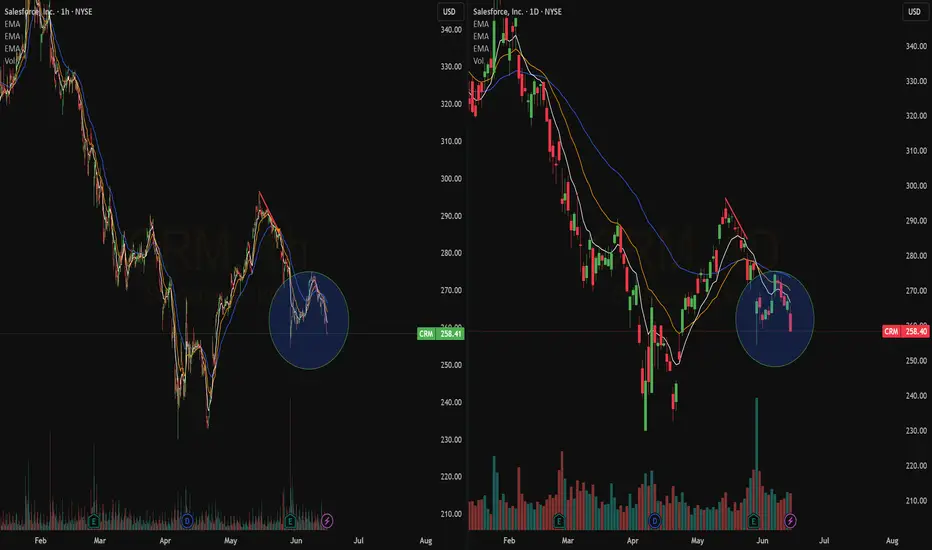
Quick View: $CRMDaily -> Bearish crossover with pullback on the ema 50
Hourly-> New bearish crossover
Watching for a #TopSwing Setup on the Daily Chart
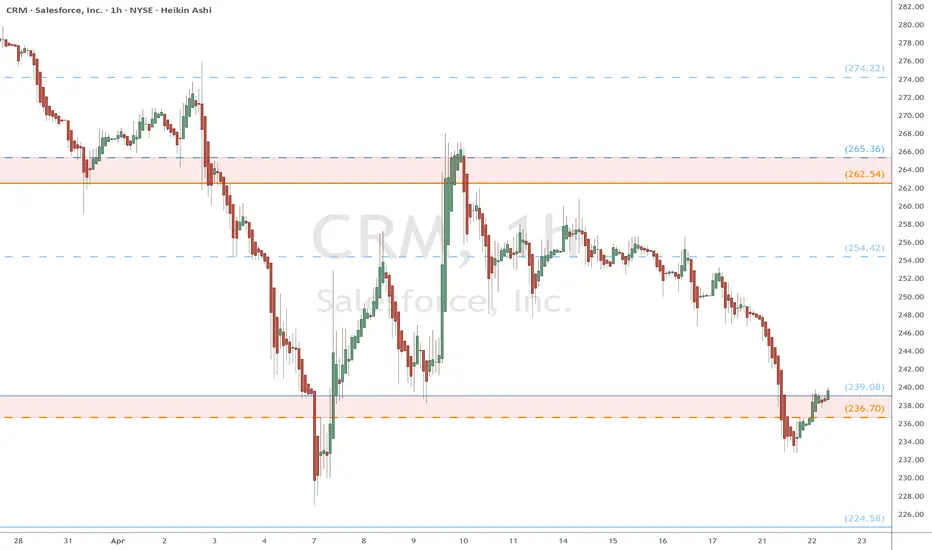
CRM watch $262-265: Major Support that will call Bull or BearCRM gave us a nice long and exit in last idea below.
Now retreated to a major support $262.54-265.36
Bottom bound is a Golden Genesis, most important.
Above this zone is Bull, below is more Bear hell.
Look for a clean bounce or rejection for next leg.
.
Last Plot that gave perfect Entry/Exit:
E

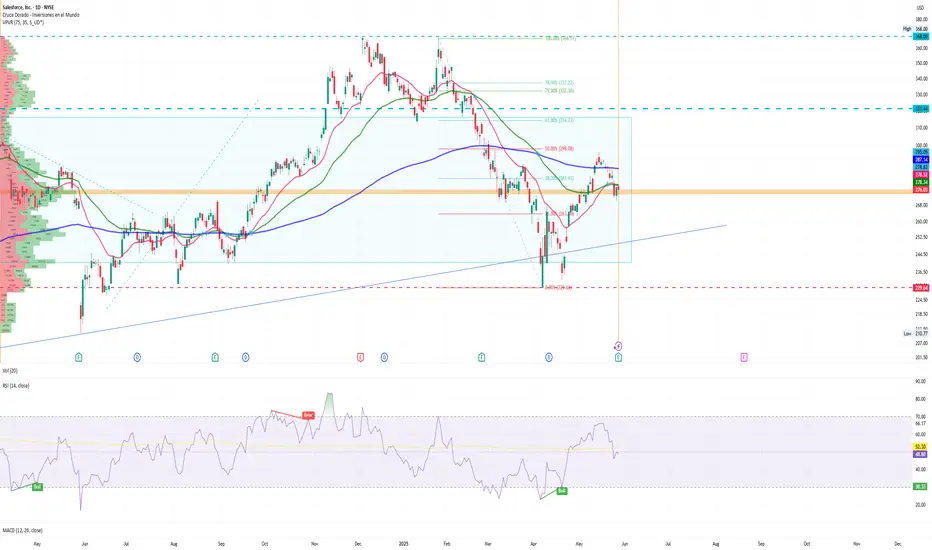
CRM Long Setup: High R:R Opportunity Off Support ZoneSalesforce (CRM) is setting up for a compelling long opportunity based on a combination of Ichimoku cloud structure, pivot level confluence, and a strong risk/reward ratio. After a recent pullback from the $290s, CRM has entered a consolidation range just above the Ichimoku cloud. With a defined sto

CRM watch $236.70-239.08: Resistance flip to support for bottomCRM looking weak along with the tech sector.
Watching a key support zone at $236.70-239.08
Look for Break-n-Retest or consolidation above.
.
Previous Plots below:
Topping Call after Tariff Relief pump:
Bottom Call at $212:
Profit Taking levels after bottom pump
=============================
Salesforce Goes Shopping: Acquires Informatica for $8 BillionSalesforce (NYSE: CRM) has taken a major step in its growth strategy by announcing the acquisition of Informatica (NYSE: INFA) for approximately $8 billion. Informatica closed yesterday at $24.29 per share. This deal, Salesforce’s largest since acquiring Slack in 2021, aims to strengthen its artific
See all ideas
Summarizing what the indicators are suggesting.
Neutral
SellBuy
Strong sellStrong buy
Strong sellSellNeutralBuyStrong buy
Neutral
SellBuy
Strong sellStrong buy
Strong sellSellNeutralBuyStrong buy
Neutral
SellBuy
Strong sellStrong buy
Strong sellSellNeutralBuyStrong buy
An aggregate view of professional's ratings.
Neutral
SellBuy
Strong sellStrong buy
Strong sellSellNeutralBuyStrong buy
Neutral
SellBuy
Strong sellStrong buy
Strong sellSellNeutralBuyStrong buy
Neutral
SellBuy
Strong sellStrong buy
Strong sellSellNeutralBuyStrong buy
Displays a symbol's price movements over previous years to identify recurring trends.
US79466LAM6
SALESFORCE 21/61Yield to maturity
6.87%
Maturity date
Jul 15, 2061
US79466LAL8
SALESFORCE 21/51Yield to maturity
6.83%
Maturity date
Jul 15, 2051
US79466LAK0
SALESFORCE 21/41Yield to maturity
6.34%
Maturity date
Jul 15, 2041
US79466LAJ3
SALESFORCE 21/31Yield to maturity
4.64%
Maturity date
Jul 15, 2031
US79466LAH7
SALESFORCE 21/28Yield to maturity
4.21%
Maturity date
Jul 15, 2028
US79466LAF1
SALESFORCE 18/28Yield to maturity
4.08%
Maturity date
Apr 11, 2028
See all CRM bonds
Curated watchlists where CRM is featured.


Frequently Asked Questions
The current price of CRM is 273.80 USD — it has increased by 1.35% in the past 24 hours. Watch SALESFORCE INC stock price performance more closely on the chart.
Depending on the exchange, the stock ticker may vary. For instance, on BVL exchange SALESFORCE INC stocks are traded under the ticker CRM.
CRM stock has risen by 4.13% compared to the previous week, the month change is a −1.01% fall, over the last year SALESFORCE INC has showed a 6.37% increase.
We've gathered analysts' opinions on SALESFORCE INC future price: according to them, CRM price has a max estimate of 440.00 USD and a min estimate of 225.00 USD. Watch CRM chart and read a more detailed SALESFORCE INC stock forecast: see what analysts think of SALESFORCE INC and suggest that you do with its stocks.
CRM stock is 1.34% volatile and has beta coefficient of 1.27. Track SALESFORCE INC stock price on the chart and check out the list of the most volatile stocks — is SALESFORCE INC there?
Today SALESFORCE INC has the market capitalization of 261.39 B, it has decreased by −1.23% over the last week.
Yes, you can track SALESFORCE INC financials in yearly and quarterly reports right on TradingView.
SALESFORCE INC is going to release the next earnings report on Aug 20, 2025. Keep track of upcoming events with our Earnings Calendar.
CRM earnings for the last quarter are 2.58 USD per share, whereas the estimation was 2.55 USD resulting in a 1.23% surprise. The estimated earnings for the next quarter are 2.78 USD per share. See more details about SALESFORCE INC earnings.
SALESFORCE INC revenue for the last quarter amounts to 9.83 B USD, despite the estimated figure of 9.76 B USD. In the next quarter, revenue is expected to reach 10.13 B USD.
CRM net income for the last quarter is 1.54 B USD, while the quarter before that showed 1.71 B USD of net income which accounts for −9.78% change. Track more SALESFORCE INC financial stats to get the full picture.
Yes, CRM dividends are paid quarterly. The last dividend per share was 0.42 USD. As of today, Dividend Yield (TTM)% is 0.59%. Tracking SALESFORCE INC dividends might help you take more informed decisions.
SALESFORCE INC dividend yield was 0.47% in 2024, and payout ratio reached 25.15%. The year before the numbers were 0.00% and 0.00% correspondingly. See high-dividend stocks and find more opportunities for your portfolio.
As of Jun 29, 2025, the company has 76.45 K employees. See our rating of the largest employees — is SALESFORCE INC on this list?
EBITDA measures a company's operating performance, its growth signifies an improvement in the efficiency of a company. SALESFORCE INC EBITDA is 12.96 B USD, and current EBITDA margin is 34.93%. See more stats in SALESFORCE INC financial statements.
Like other stocks, CRM shares are traded on stock exchanges, e.g. Nasdaq, Nyse, Euronext, and the easiest way to buy them is through an online stock broker. To do this, you need to open an account and follow a broker's procedures, then start trading. You can trade SALESFORCE INC stock right from TradingView charts — choose your broker and connect to your account.
Investing in stocks requires a comprehensive research: you should carefully study all the available data, e.g. company's financials, related news, and its technical analysis. So SALESFORCE INC technincal analysis shows the buy rating today, and its 1 week rating is sell. Since market conditions are prone to changes, it's worth looking a bit further into the future — according to the 1 month rating SALESFORCE INC stock shows the buy signal. See more of SALESFORCE INC technicals for a more comprehensive analysis.
If you're still not sure, try looking for inspiration in our curated watchlists.
If you're still not sure, try looking for inspiration in our curated watchlists.