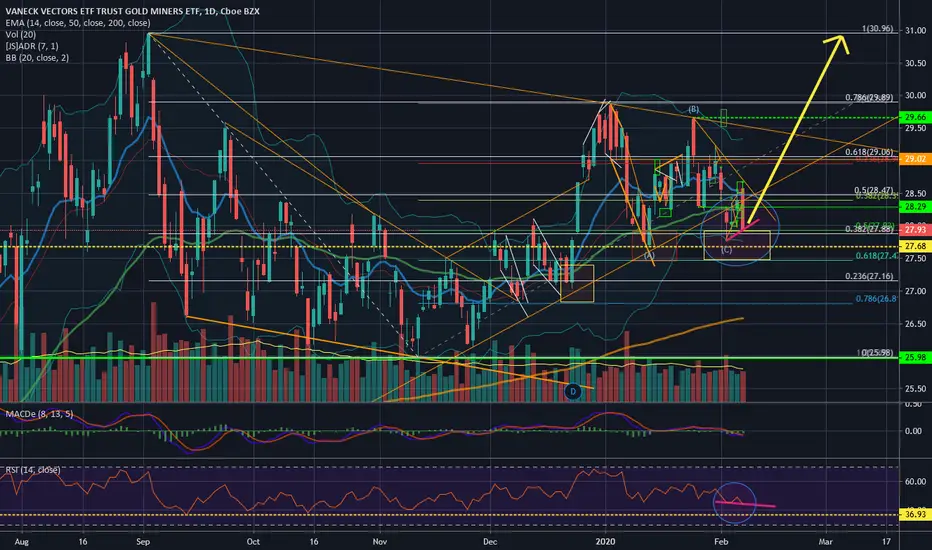
BOOMing Part IBoom in gold is gonna come fast. $1700 could be within the next 2 weeks. $31 for GDX. GDX could move even faster. Staying long on both. External factors, of course, seem to be only positive for both. Impossible to quantify black swans... at least for us amateurs.
GDX trade ideas
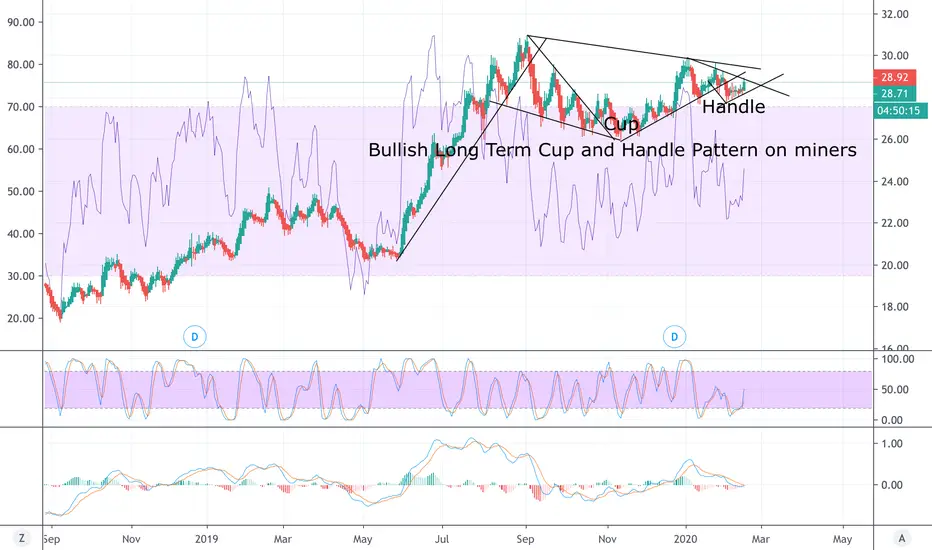
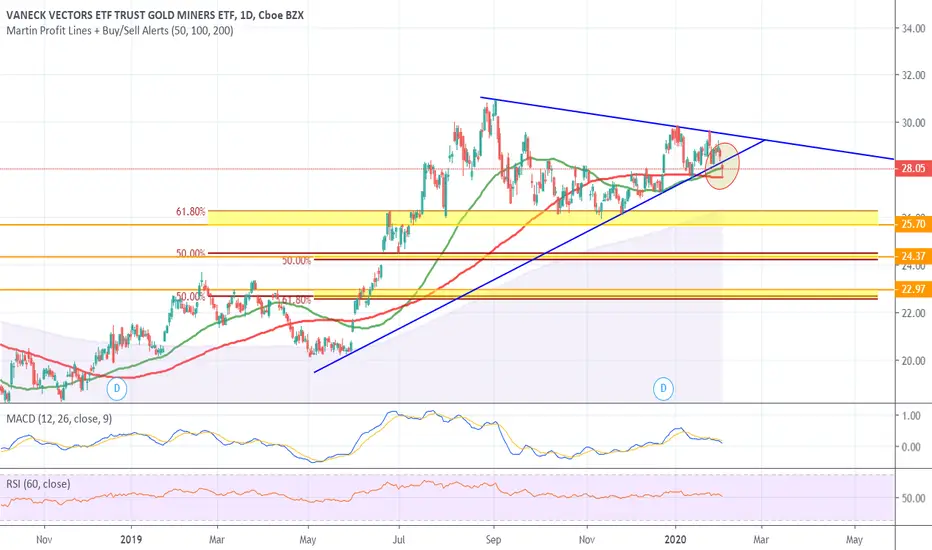
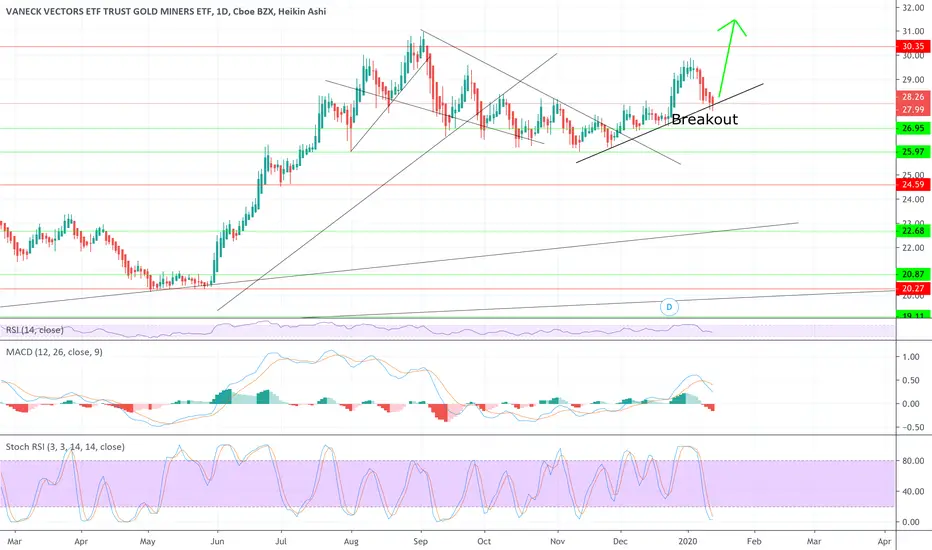
Waiting for bullish breakout on Cup and Handle PatternExpecting a breakout and move up coming soon. Miners are down on the year so far, yet Gold is up, miners underperformed earnings in 2019 this, just like silver will catch up to reality.
BOOM!Something big is about to happen. GDX was way ahead of itself and gold. That's about to adjust... UP
GDX. Bear trap? Seems like we are ready for the next Leg up. GDX. Bear trap? Seems like we are ready for the next Leg up.
On RSI we have divergence and the price still holding on Fib .50 and .62 retracement. We can expect bull reaction and the next week we wiil see the earnings reports of GOLD (Barrick).
Now, adding long positions on GDX, NUGT. Also, Silver´s price is close to "Golden cross" on weekly chart.
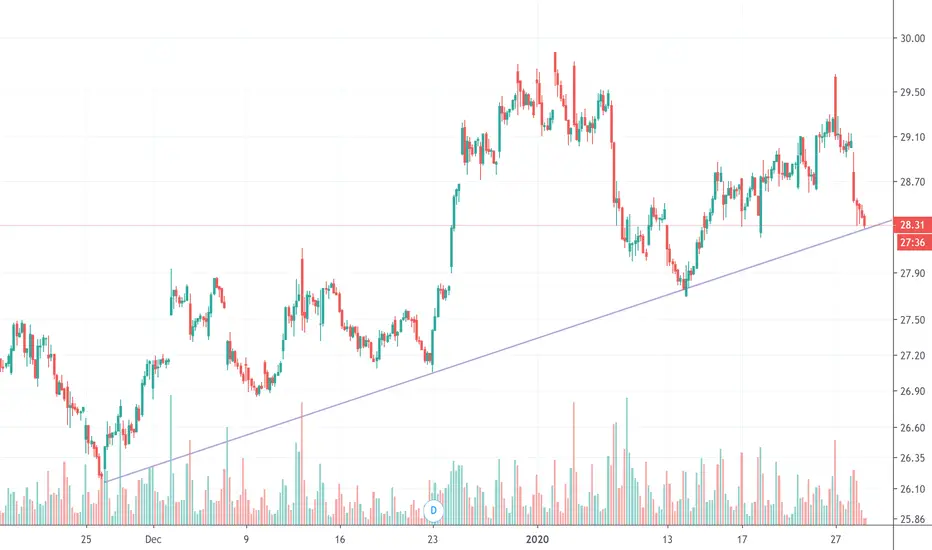
GDX - still needs time to correctGDX closed on the lows of the day and particularly weak. I like this to touch flag support before it is ready to resume its uptrend. RSI and MACD still with work to do and moving averages not ideal. Looking to buy when I start seeing prices in the low 27s but will be cautious as support could be breached depending on other market action. Looking to get long but not yet. Still maintaining my DUST position.

GDX to 24Maybe lower, but the gap is the target. If it closes back over the trendline it's a long for sure!
good luck

GDX - Looking to buy at $23Hello, I won't make comments for this chart I will link GDXJ that I did, assumptions are the same/similar
GDX - still in Show Me mode!Despite a $15 move up in gold, a 600 point down day, global weakness in stocks, sinking treasury yields, inversion of 3's v 10's, coronavirus, bad PMI, and truly a whole host of other bad news, GDX is struggling to take out resistance. I have been dumbfounded lately trying to figure this out. Perhaps on Monday when Chinese markets get killed and US futures are down big, maybe then we will see a spike. GDX needs to take out 31 to convince me that it has legs. NEM closed very weak today. Just not sure what to make of this but I am watching it very closely as I have recently established a long position in DUST which is something completely new to me that I am not necessarily comfortable with. Not fighting the trend just feel like there is something out there that will tame old and silver for a little while before their next significant moves up.

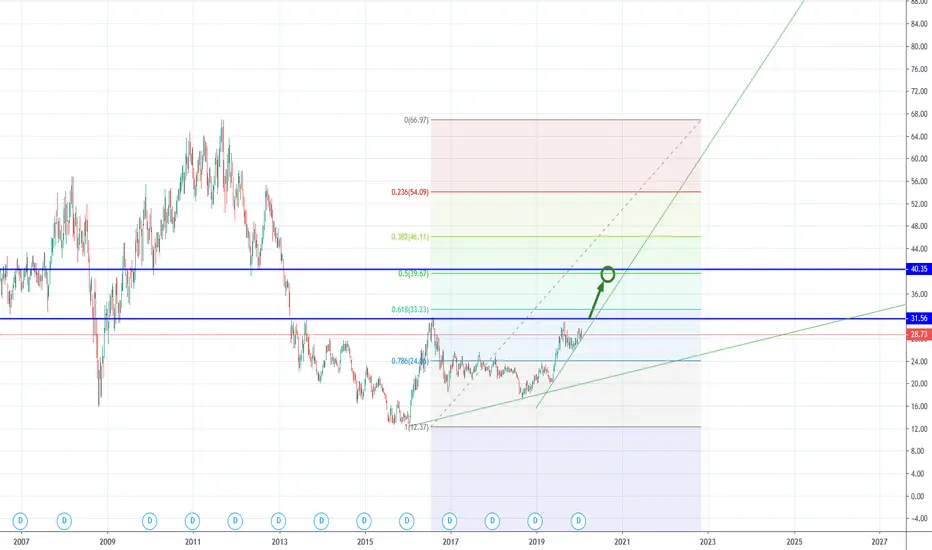
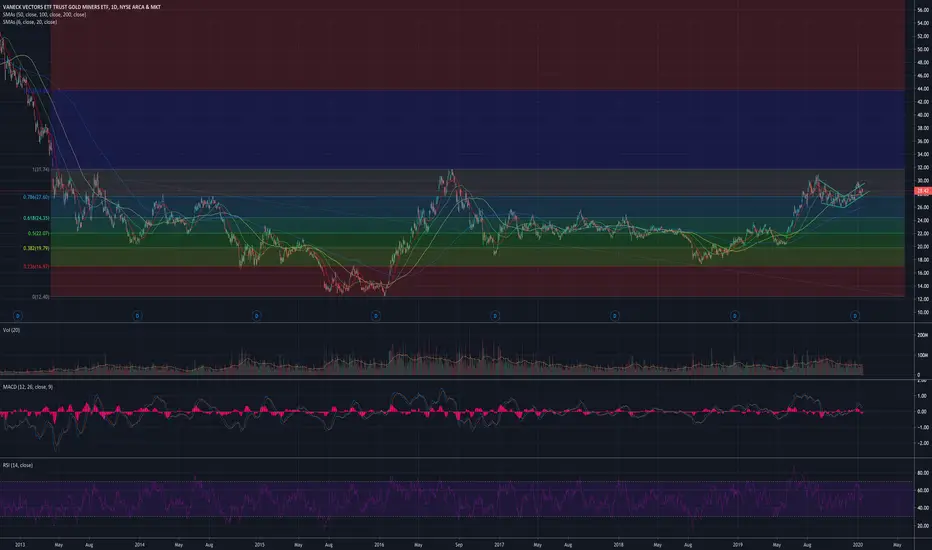
The GDX is about to break out!The GDX ETF is about to break out. Initial target is the high 40 as this is the next resistance level. This also coincides with the 50% fibonacci retracement level. I would expect some consolidation following this target being met, eventually heading higher.
OPENING: GDX MAY 15TH 26/33 SHORT STRANGLE... for a 1.01 credit.
Notes: Re-upping a gold miners play in the first expiry in which the at-the-money short straddle pays greater than 10% of the value of the underlying.

GDX – Turned Bullish on Daily - $32 Price TargetChart Details
Price on Daily keeping yellow support. Best entry would be close to yellow support (on pullback).
Bullish price action – higher highs and higher lows daily.
Gaps to fill up to $37.
Conservative price target of $32 to fill first gap.
RSI channel is our guide to enter or exit until channel guides are violated.
Opinion
I had three hedges for market downturn in play, instead of taking specific bearish plays on SPY for example.
GDX, SCO, and SPXS have all been good hedges when purchased at correct time (market ATH's with weekly RSI over 80-85)
With coronavirus, oil conflicts, Iran, market overpriced, negative interest....yada yada...there are a number of bubbles or events ready to pop.
About Me
www.moneypatterns.com
Options Strategies, Video Technical Analysis, Instant Alerts, Specific Options Order Entry Details, Daily Updates, Equities & Crypto, Weekly Breakdowns, Charting Service, & More in Members Area!
Thank you for liking, commenting, throwing up a chart, following, or viewing.
I am not a financial advisor. My comments and reviews are based on what I do with my personal accounts and on www.moneypatterns.com

GDX - time for a breather?I've been watching this closely as GDX failed to take out the high that began the run in 2016 and failed to take out the high from September. Gold has had a tremendous run ($300 plus) but the miners which typically lead upturns and downturns seem to be telling us something. If the overall market is risk on a la INTC earnings and the like, then the metals space may be in for more consolidation before heading up again. GDX has support in the $25 area and I would be surprised to see a break below 25. I have drawn in trend line support that could come into play should the control line that marks the 2016-2020 run fail. That line would mean something in the $23-$24 range. I sold all GDX and NUGT over the last couple days debating where this is headed. Again, my gut says GDX should have taken out the prior highs around $32 and it did not in the context of a "new bull market." GLD indicators show overbought and turning down. GDX may look to find lower numbers on MACD and RSI as well. Long DUST for now.

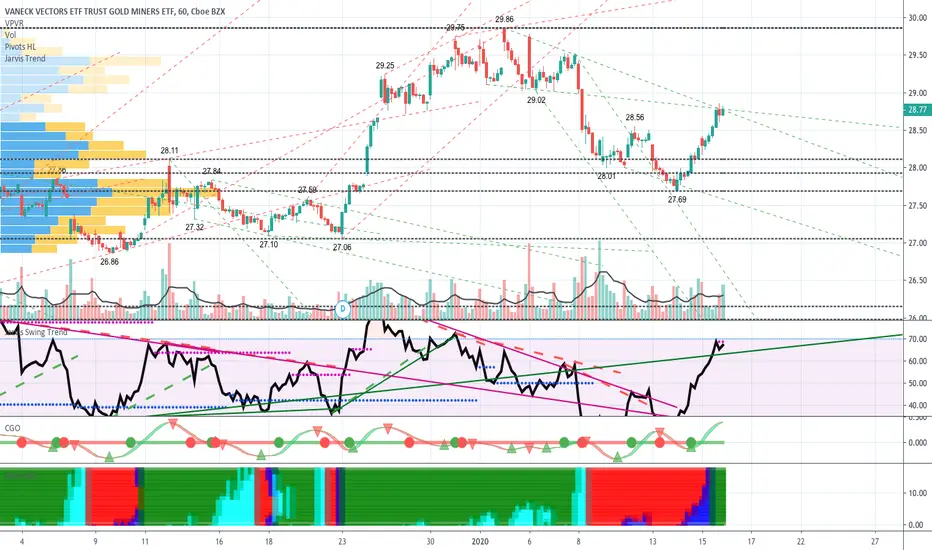
Bull GDX. Great entry!! Now Up to 30 level.Great moment for Gold Miners and precious metals. Excellent entry on 28.20. Now second wave, directly to 30 Level.
GDX - Consolidating as Expected!GDX going thru a slight consolidation phase before next leg up. $31.75 is critical area as it represents high from 2016 run and the gap down that started all the price action under that level for the last 7 years since 2013. I know several technicians looking for a breakdown in gold with melt up in market. I had been watching the $143 level on GLD as a breakout area and I think we have solid support there. We would need a complete breakdown in the metals space for that to give way in any meaningful way. If that happens it might get everyone leaning the wrong way which could be the catalyst we need to have a sustained move above $1600. IMO GDX has max 10% downside from here ($2-3). Overall market starting to look silly but some good earnings this week could catapult us even higher. Plunge protection team working hard to keep this thing aloft. Election year too so not sure the 11 year bull is ready to die. Be patient here. There still may be lower prices but not much.
Gold Miner ETF Holds Key ZoneGold miners have been consolidating for the last six months and now the Market Vectors Gold Miner ETF is bouncing at a potentially key level.
GDX peaked around $28 between late October and mid-December. It then broke out and has now pulled back to find support at the old resistance. There's also some confluence with the 50- and 100-day simple moving averages at the same area.
Meanwhile, the U.S. dollar index just made another lower high below its 50-day SMA. This isn't a huge surprise given the Fed's strongly dovish stance -- especially after last week's poor non-farm payrolls report AND this week's tepid inflation numbers.
GDX could also serve as something of a hedge against downside in the broader market. While the S&P 500 isn't showing many clearly bearish signs yet, a lot of good news is potentially priced in.
XAUUSD

Bullish reversal coming soon Gold metal appears to have more downside but minors which have uncharacteristically underperformed Gold are nearing strong support and bottom of trendline and are forming bullish bullish cup and handle.
OPENING: GDX MARCH 20TH 27/32 SHORT STRANGLE... for a 1.16 credit; delta -3.15/theta 1.60.
Notes: Going small here in the first expiry in which the short straddle pays greater than 10% of the stock price. Will add if necessary to delta balance.

GDX close to break otuXAUUSD led the break @ 1367 and now GDX will follow accordlingly. my estimates are on Q1 2020

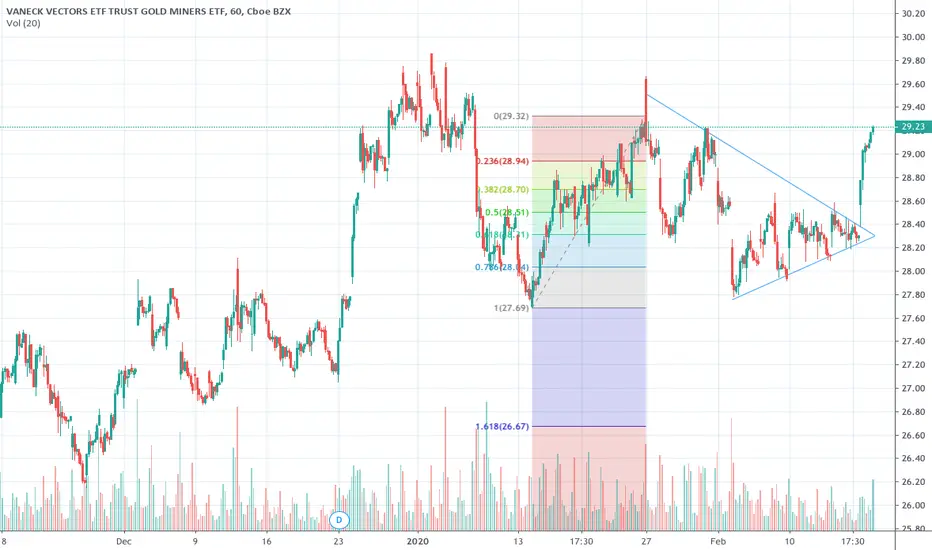
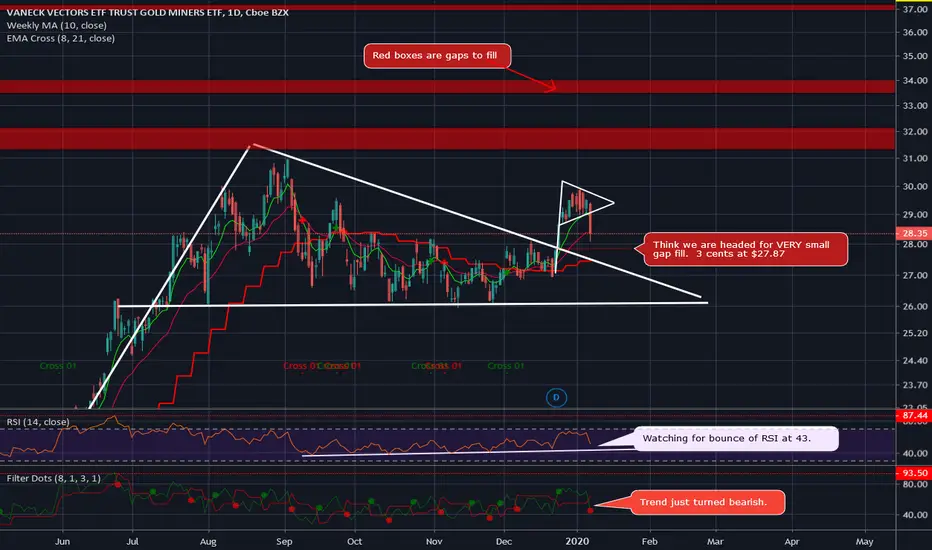
GDX – Small Gap Missed Reason for Downtrend?Found a 3 cent gap around $27.87. Easy to miss. We are headed to gap fill, then back up in my opinion.
Trade Entry
I would look to place hopeful orders in the gap fill, and below the gap fill for overshoot.
I am holding 1/31 expiry options. May add to position if we get to the gap fill.
Market at ATH’s with GDX gap fills tells me things are ready to flip anytime into pullback/correction.
Chart Details
All other details other than the gap fill are the same as previous chart.
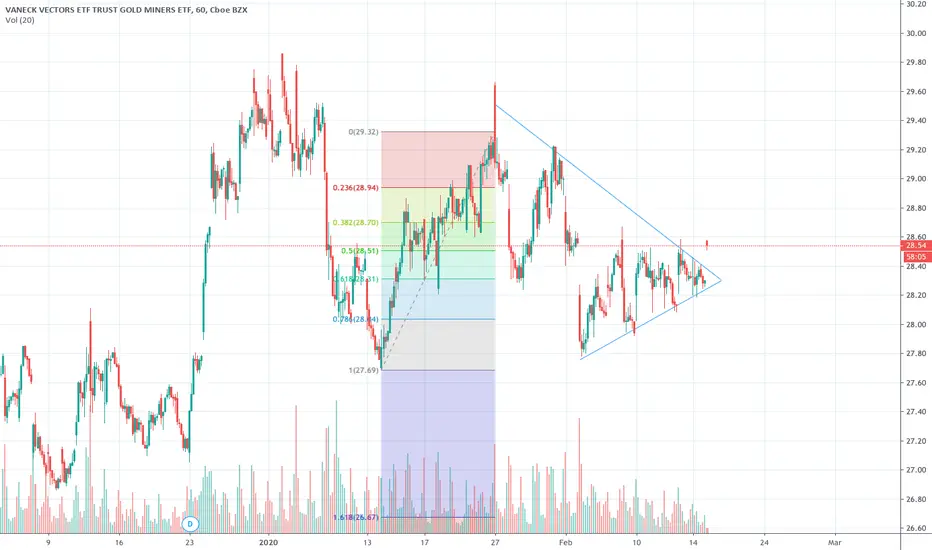
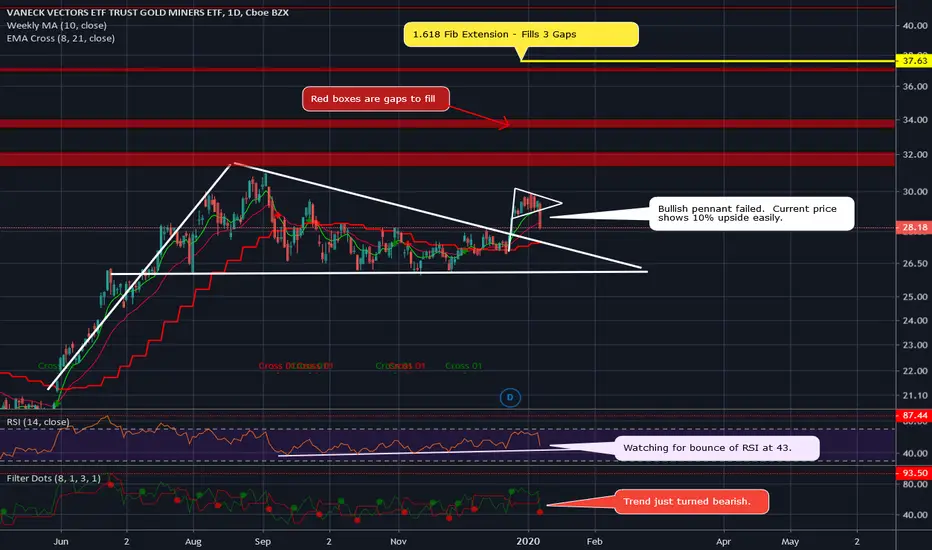
Bullish pennant failed.
Price retested recent highs.
Current price at $28 has 10% upside to last high around $30.
Daily trend did confirm bearish today.
Multiple gaps to fill above tells me price wants to go higher.
Watching RSI for bounce off support around 43. If we get below 40 RSI, trade is totally off.
About Me
Thank you for liking, commenting, throwing up a chart, following, or viewing.
I am not a financial advisor. My comments and reviews are based on what I do with my personal accounts.
Website will be ready for launch mid-January 2020. Thank you for your patience while I try to juggle everything and maintain the same standards.
Disclosure - I am long BTCUSD, GBTC. Short term GDX Bullish, SPXS Bullish, CRWD Bullish short term, ZM Bullish, BYND Bullish
GDX – Bull Pennant Failure Stop reached but still holding Put Credit Spreads.
Trade Entry
I entered this trade with 1/31 expiry. Although stop was reached, I am happy to either see how this pans out or take the obligation to buy GDX at $27. I can just hold the shares and wait a month.
If you think there will be any kind of unrest in the next year, while Gold comes out of a 10yr nap, then GDX at current price is an excellent hedge.
Chart Details
Bullish pennant failed.
Price retested recent highs.
Current price at $28 has 10% upside to last high around $30.
Daily trend did confirm bearish today.
Multiple gaps to fill above tells me price wants to go higher.
Watching RSI for bounce off support around 43. If we get below 40 RSI, trade is totally off.
About Me
Thank you for liking, commenting, throwing up a chart, following, or viewing.
I am not a financial advisor. My comments and reviews are based on what I do with my personal accounts.
Website will be ready for launch mid-January 2020. Thank you for your patience while I try to juggle everything and maintain the same standards.
Disclosure - I am long BTCUSD, GBTC. Short term GDX Bullish, SPXS Bullish, CRWD Bullish short term, ZM Bullish, BYND Bullish
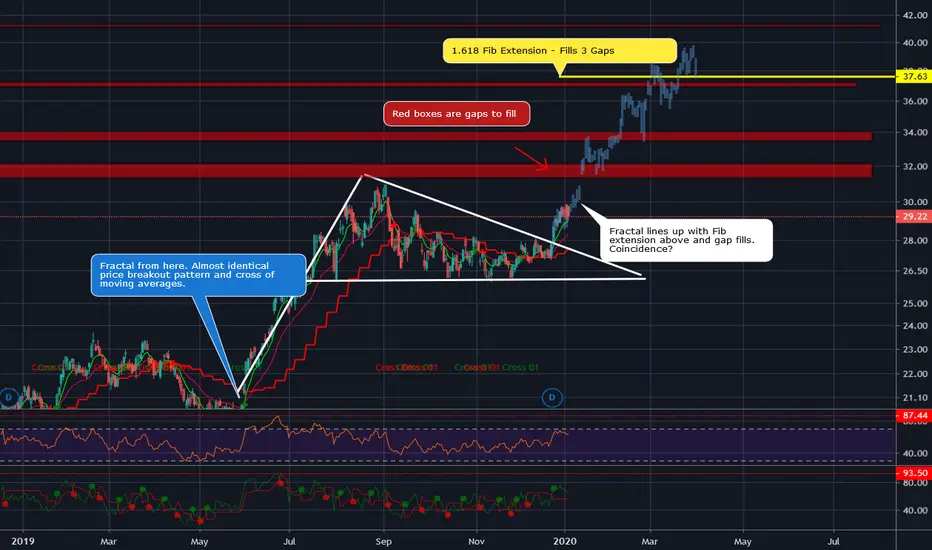
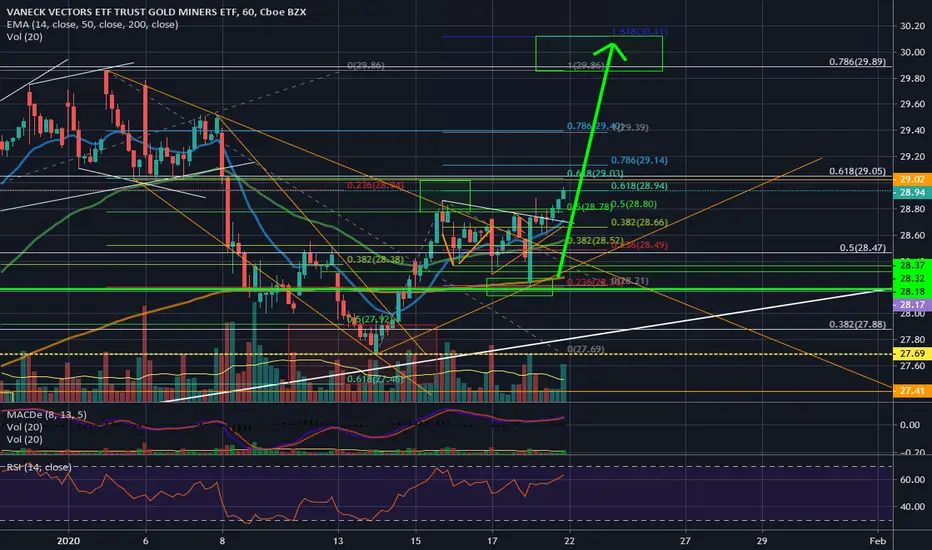
GDX – Pausing Before Resuming BullishTrading active in GDX. Going to gap fills at $37 possible.
Trade Entry
1/31 expiry, 27/31 Put Credit Spread.
1/31 Expiry. 29/33 Put Credit Spread.
Chart Details
GDX currently in Bull Flag breakout.
Fractal from pole of Bull Flag is almost identical to current price breakout.
Fractal lines up with 0.618 Fib Extension and gap fills. Things confirming in this manner are positive correlation.
I see GDX taking a break on Fed Repo day of $35Billion or more. Same as fractal. By next week we are resuming up IMO.
About Me
Thank you for liking, commenting, throwing up a chart, following, or viewing.
I am not a financial advisor. My comments and reviews are based on what I do with my personal accounts.
Website will be ready for launch mid-January 2020. Thank you for your patience while I try to juggle everything and maintain the same standards.
Disclosure - I am long BTCUSD, GBTC. Short term GDX Bullish, SPXS Bullish, CRWD Bullish short term.
Previous GDX Chart