6/24/25 - $pltr - Porti update6/24/25 :: VROCKSTAR :: NASDAQ:PLTR
Porti update
- decided to do it on this "heads i win tails you lose" stonk
- good luck to the believers.
portfolio - i think mkt is cooked but could melt up. so i dug in my heels. 3 names i like. and shorts that r cheap and silly expensive. let's see who wins.
i'm gross ~180%, net ZERO
longs
OBTC at 45%
NXT '27 leaps 15-20%
GAMB at 30%
(sold HIMS for now, forgive me ;)
shorts
IBIT (hedge to OBTC convert)
BUG
QUBT
ROBT
UFO
ASTS
PLTR
CVNA
let's see. careful out there. tape looks low IQ.
V
PLTR trade ideas
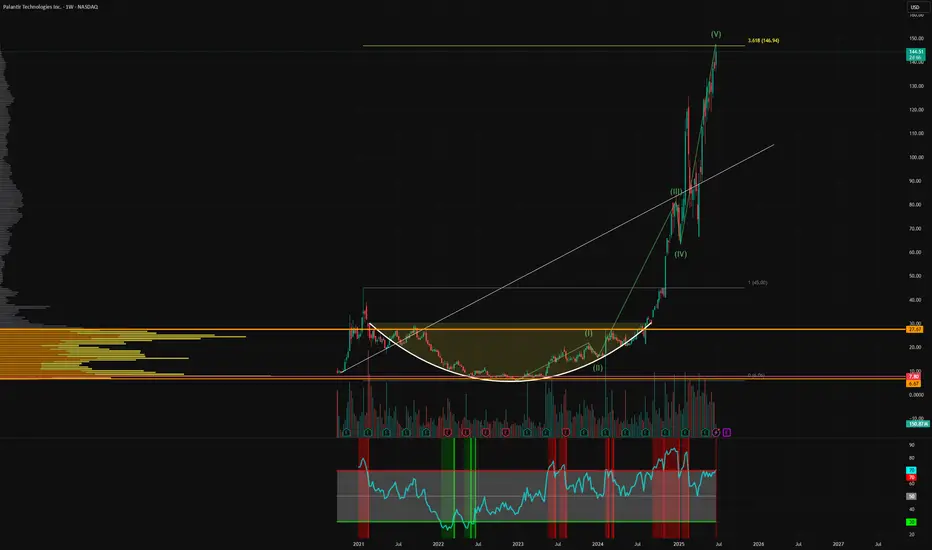
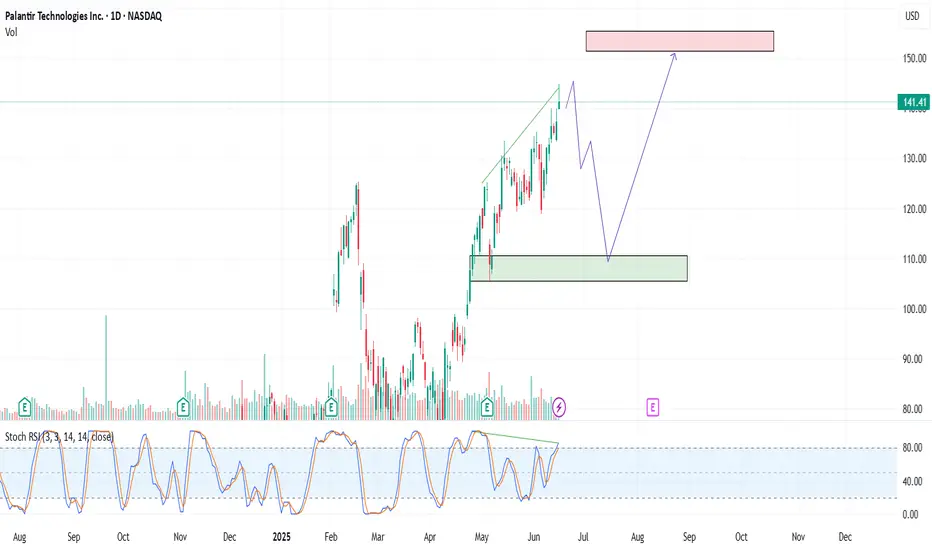
Bearish Divergences - Short TriggeredThis move up in the fifth wave is showing a bearish divergence on the RSI. I expected us to reach the $146-150 level. I have entered a short position with a tight stop loss. Nobody knows when the party's over, I'll take my chance here and if I am proven wrong, it will only be at a small loss.
Not financial advice.
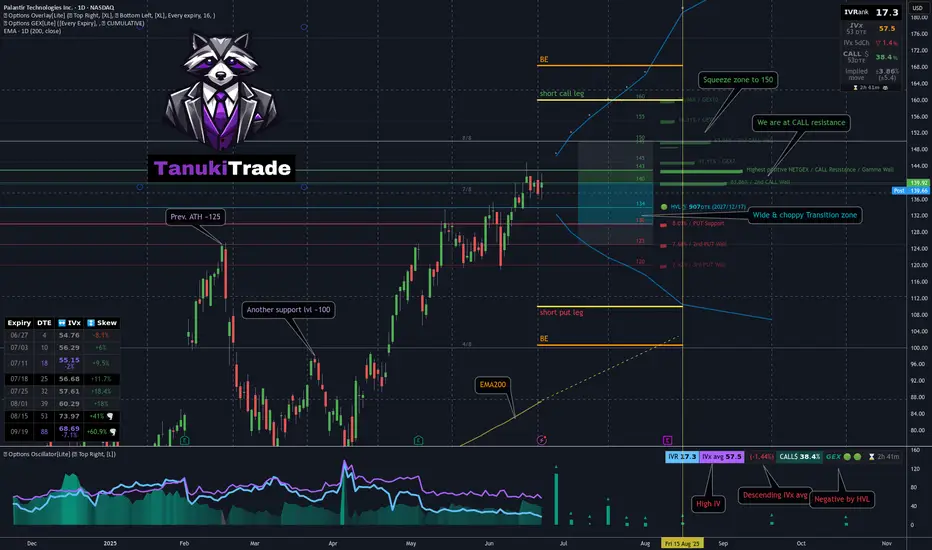
Jade Lizard on PLTR - My 53DTE Summer Theta PlayMany of you — and yes, I see you in my DMs 😄 — are trading PLTR, whether using LEAPS, wheeling, or covered calls.
I took a closer look. And guess what?
📈 After a strong move higher, PLTR was rejected right at the $143 call wall — pretty much all cumulative expiries cluster resistance there
Using the GEX Profile indicator, scanning all expirations:
After a brief dip, the market is repositioning bullish
Squeeze zone extends up to 150
The most distant GEX level is sitting at 160
On the downside, 130 is firm support, with some presence even at 120 — the market isn’t pricing in much risk below that
📉 From a technical standpoint:
We’re near all-time highs
125 (previous ATH) and 100 are key support levels
The OTM delta curve through August is wide, and the call side is paying well — with a current call pricing skew
🔬 IVx is at 57, trending lower + call pricing skew📉 IV Rank isn't particularly high, but the directional IVx matters more here
💡 Summer Theta Play: Jade Lizard on PLTR
Since I’ll be traveling this summer and don’t want to micromanage trades, I looked for something low-touch and high-confidence — and revisited an old favorite: the Jade Lizard.
If you're not familiar with the strategy, I recommend checking out Tastytrade's links and videos on Jade Lizards.
🔹 Why this setup?
Breakeven sits near $100, even with no management
On TastyTrade margin:~$1800 initial margin ~$830 max profit
53 DTE — plenty of time for theta to work
Earnings hit in August — I plan to close before then
Covers all bullish GEX resistance zones
Quickly turns profitable if IV doesn’t spike
Highly adjustable if needed
My conclusion: this strategy covers a much broader range than what the current GEX Profile shows across all expirations — so by my standards, I consider this to be a relatively lower-risk setup compared to most other symbols right now with similar theta strategies.
🔧 How would I adjust if needed?
If price moves up:
I’d roll the short put up to collect additional credit
Hold the call vertical as long as the curve supports it
If price drops:
Transition into a put ratio spread
Either extend or remove the call vertical depending on conditions
🛑 What’s the cut loss plan?
I have about 20% wiggle room on the upside, so I’m not too worried — but if price rips through 160 quickly, I’ll have to consider early closure.
If that happens, the decision depends on time:
If late in the cycle with low DTE:→ Take a small loss & roll out to next month for credit
If early with lots of DTE remaining:→ Consider converting to a butterfly, pushing out the call vertical for a small debit→ Offset this with credit from rolling the put upward
As always — stay sharp, manage your risk, and may the profit be with you.
See you next week!– Greg @ TanukiTrade
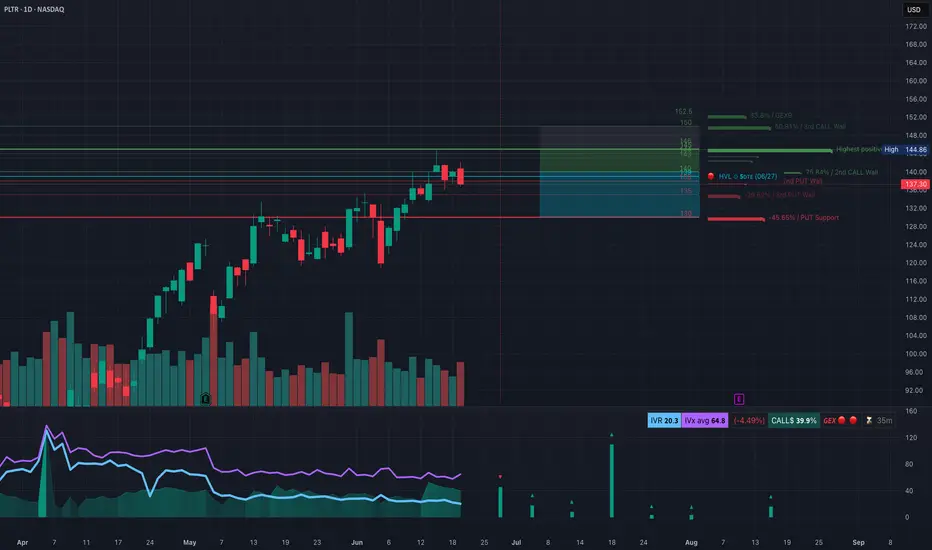
PLTR at a Decision Point – Will It Defend or Break Lower? Jun 23PLTR at a Decision Point – Will It Defend This Channel or Break Lower?
🔹 Options Sentiment (GEX) Overview:
* Current Price: $137.30
* Gamma Flip Zone: $140.00 (HVL, short-term battleground)
* Call Walls:
* $143.00 (2nd Call Wall)
* $150.00–$152.5 (3rd Call Wall + GEX resistance zone)
* Put Walls:
* $136.00 → minor defense
* $130.00 → strongest Put Support (-45% GEX floor)
* GEX Bias: 📉 Bearish leaning
* GEX: 🔴
* IVR: 20.3 (very low)
* IVx: 64.8 (dropping -4.49%)
* CALLs: 39.9% → PUTs dominant
🧠 Interpretation: GEX is suggesting downside pressure below $140. If bulls can’t reclaim it soon, momentum could shift fast toward $136 → $130 support.
📈 Price Action (1H Intraday - SMC Insight):
* Current Structure:
* Multiple CHoCH (Change of Character) pointing to weakness
* Price broke below the ascending trendline
* Forming a local bearish block beneath $140
* PDH/Resistance: $144.86
* Support:
* $137.42 (short-term)
* $136.08 (SMC support + GEX alignment)
📉 Market Structure Bias: Bearish short-term unless it reclaims the $140 zone and breaks the descending micro-structure.
🎯 Trade Setup Ideas
🔻 Bearish Scenario (If weakness continues):
* Entry: Below $137.20
* Target: $136.08 → $133 → $130
* Stop: $140.00 reclaim
* Confluence: CHoCH + GEX Put Wall magnet + failed trendline defense
🔼 Bullish Reversal Scenario (Only on reclaim):
* Entry: Break & hold above $140.00
* Target: $143 → $144.86 → $150
* Stop: Breakdown back below $139
* Confluence: GEX Flip + Channel re-entry + Institutional Call Wall targets
🔍 Final Thoughts
PLTR is sitting near a critical decision level around $137–$140. Options sentiment (GEX) shows dominant PUT flow and a bear bias below $140, while price action is showing early signs of structure breakdown. If bulls cannot recover $140 early in the week, we could see a slow grind toward the $130 PUT Support zone. Use caution near the $136–$137 liquidity pocket — it's a key short-term decision area.
This analysis is for educational purposes only and does not constitute financial advice. Always do your own research and manage risk appropriately.
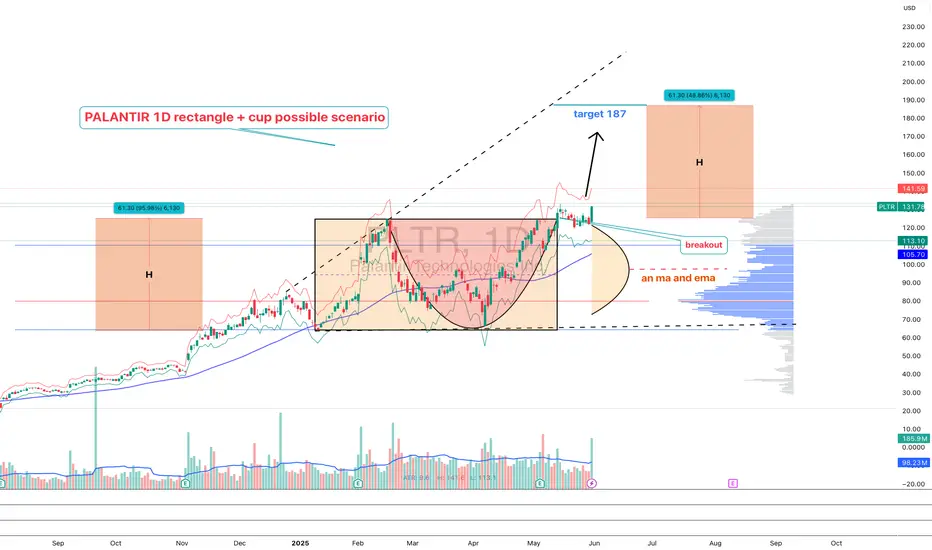
PLTR 1D — When the tea is brewed and the handle’s in placePalantir’s daily chart is shaping up a textbook cup with handle pattern — one of the most reliable continuation setups in technical analysis. The cup base was formed over several months and transitioned into a consolidation phase, building a rectangle structure where smart money likely accumulated positions before a breakout.
Now here’s the key: price has not only broken out — it’s settled above all major moving averages, including EMA 20/50/100/200 and MA 50/200. The breakout candle was supported by surging volume, signaling strong participation from institutional buyers. When all the averages start bending upwards, it's usually not by accident.
The breakout above the $121 resistance zone unlocked a pathway toward a target at $187 , derived by projecting the height of the cup upward from the breakout level. This kind of structure, once confirmed, often fuels aggressive continuation — and this one’s got the setup locked in.
From a fundamental perspective, Palantir is holding solid ground: strong earnings reports, expanding government and commercial contracts, and aggressive development in AI services. Institutional interest is rising steadily, and that momentum is visibly reflected in price action.
To sum it up: price has launched cleanly out of the consolidation zone, pierced all critical MAs and EMAs, and continues to gain momentum. While the market sips its tea, this cup is boiling hot. Just don’t forget your stop loss — this is a trading desk, not a tea party.
If you enjoy posts like this, drop a like, share it around, and let’s hear your thoughts below. It keeps ideas moving and the content flowing — free, sharp, and relevant.
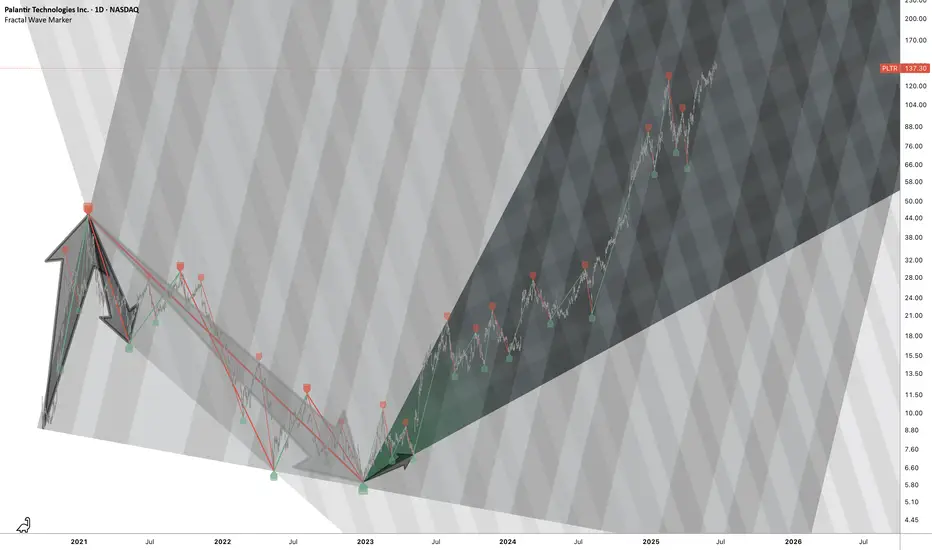
PLTR: Broad Cycle Breakdown via Fibs Interference Pattern
Growth angle
ST downtrend angle
Highlighting shape of expansion + scaling the structure to new axis that advances after establishing longer term full cycle.
PALANTIR vs S&P500 INDEX. WILL AI UPBEAT TYCOON BUFFETT ITSELFFar far ago, somewhere in another Galaxy, in late December, 2024 (yet before The Second Coming of Trump), @TradingView asked at it awesome Giveaway: Happy Holidays & Merry Christmas.
1️⃣ What was your best trade this year?
2️⃣ What is your trading goal for 2025?
Here's what we answered:
1️⃣ What was your best trade this year?
- Surely Palantir NASDAQ:PLTR 💖
I followed Palantir all the year since January, 2024, from $16 per share, watch here .
Current result is 5X, to $80 per share.
Also I added more Palantir after SP500 Index inclusion in September 2024 watch here .
Current result is 2.6X, from $30 to $80 per share.
2️⃣ What is your trading goal for 2025?
- Once again, surely Palantir NASDAQ:PLTR 💖
It's gone 6 months or so... (Duh..? Ahaha.. 6 months already, really? 😸😸😸)
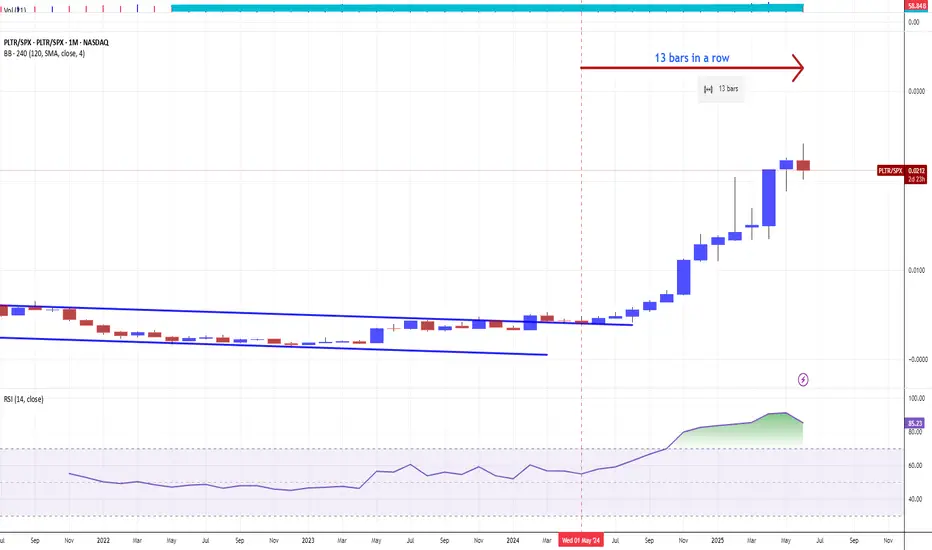
Let see what's happened next at the main graph PLTR/SPX
First of all, let me explain in a few words what does this graph mean.
Rising (Blue) candle means Palantir PLTR monthly return is better vs SPX
Falling (Red) candle means Palantir PLTR monthly return is worse vs SPX
Conclusion
Palantir. The stock that outperformed S&P 500 Index, 12 consecutive months in a row.
Palantir. The stock that printed 12x since inception. 5.5x over the past twelve month and 1.8x in the year 2025 (one the best results so far over the all S&P 500 Index components).
Palantir. The stock that goes to UPBEAT Tycoon Buffett record, that has been achieved in early 1990s (in 1992-93 Berkshire Hathway outperformed S&P 500 Index for straight TWELVE MONTHS).
Palantir. The stock that goes to repeat Microsoft NASDAQ:MSFT record, that has been achieved in 1990s (in 1996-97 Microsoft outperformed S&P 500 Index for straight THIRTEEN MONTHS).
Palantir. Were we right with this stock on contest and won it? Exactly! Even though our prize has been toadly strangled. 🤭
//P.S. We did not find any biggest series then 13-month straight gain. Microsoft 13 straght months superiority over S&P500 index is the biggest ever series in history we found.
//P.P.S. Just one day left (June 30, 2025) to a very potential and a very historical event.
--
Best wishes,
Your Beloved @PandorraResearch Team 😎
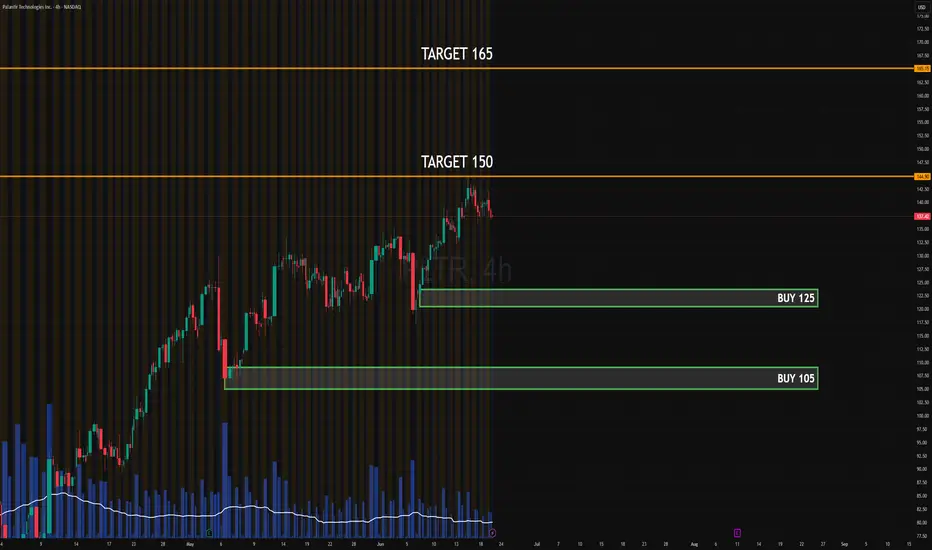
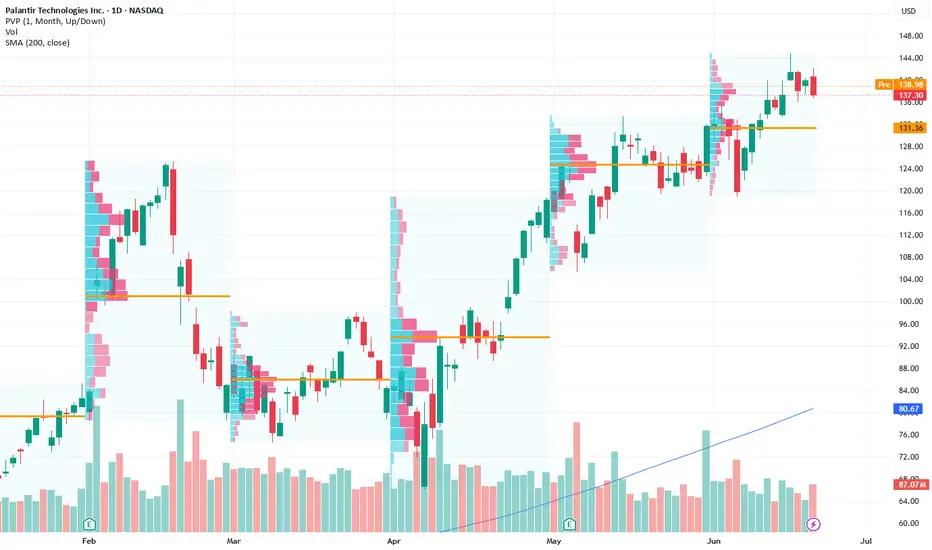
PLTR JUN - JUL 2025 EARNINGSLong from $125 or $105 with confirmation.
📤 Short if $125 breaks and no absorption is seen.
Key resistance: $150 / $165
Key support: $125 / $105
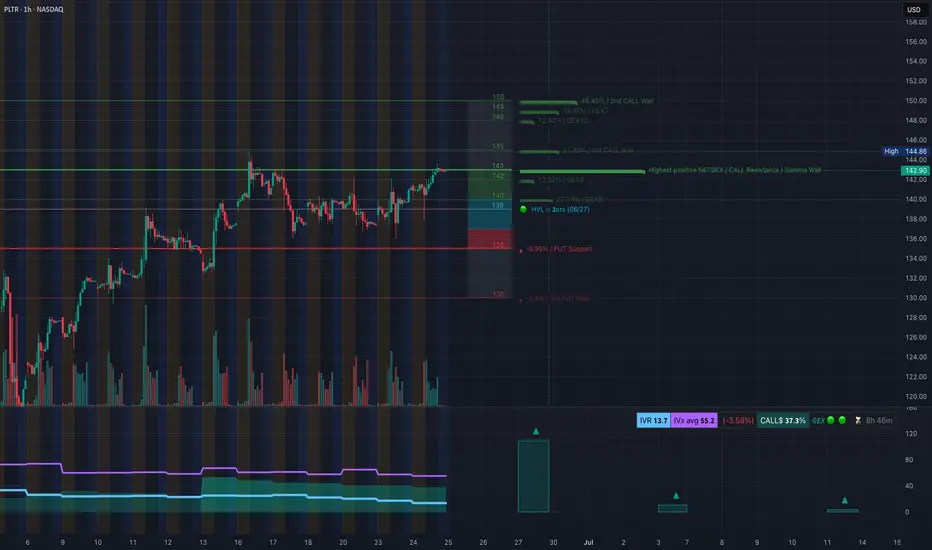
PLTR Breaking Resistance: Gamma Squeeze Potential to $144–$148?🧠 GEX Insights – Options Setup
* Current Price: $143.23
* Highest Positive GEX Level: $142.00
* Next Call Walls:
* $144.00 → +31.09% GEX (3rd Call Wall)
* $148.00 → +46.45% GEX (2nd Call Wall)
* IVR: 13.7 (low)
* IVX Avg: 55.2 → IV is underpriced, suitable for long calls
* Call Flow: 37.3% bullish
* GEX Sentiment: 🟢🟢🟢 (Bullish)
💡 Interpretation: Price is sitting above the highest positive GEX zone and just broke into the first major gamma wall at $143. If price sustains this breakout, market makers may be forced to hedge by buying more shares, leading to a gamma squeeze toward $144 → $148.
📊 Trade Idea – Technical Chart Thesis
From the second chart:
* Strong Break of Structure (BOS) just occurred above the $142.15 resistance
* Price reclaimed the pink supply zone and is attempting continuation
* Trendline support is intact from recent higher lows
* Volume is increasing on breakout, confirming momentum
📈 Bullish Scenario:
* Entry: Above $143.20 (confirm breakout retest or continuation)
* Targets:
* TP1: $144.00
* TP2: $147.13
* Stretch TP: $148.00
* Stop-loss: Below $141.80 or trendline
* Options Play: Buy 6/28 or 7/5 $145C or $147C if volume continues rising
📉 Bearish Rejection Setup (if false breakout):
* If price fails to hold $143.00 and breaks $142.00 with volume → reverts to $139 zone
* Consider short-term PUT only if price reclaims below $141.80 with confluence
✅ Summary
* ✅ GEX favors CALLs, and breakout aligns with technical strength
* ✅ Volume + BOS + GEX = strong confluence
* ⚠️ Watch for consolidation near $144 and fade if unable to break
* 🎯 Most likely scenario: move to $144–$147 range by midweek
This analysis is for educational purposes only and not financial advice. Trade with proper risk management.
Long-Term Growth Opportunity Awaits Breakout
Targets:
- T1 = $140.00
- T2 = $145.00
Stop Levels:
- S1 = $133.00
- S2 = $130.00
**Wisdom of Professional Traders:**
This analysis synthesizes insights from thousands of professional traders and market experts, leveraging collective intelligence to identify high-probability trade setups. The wisdom of crowds principle suggests that aggregated market perspectives from experienced professionals often outperform individual forecasts, reducing cognitive biases and highlighting consensus opportunities in Palantir Technologies.
**Key Insights:**
Palantir Technologies has established itself as a leader in AI and big data analytics, consistently attracting investor interest due to its strong positioning in key markets. The stock demonstrates resilience near $135, which serves as psychological support, while contracts with government and enterprise sectors add further stability to its growth story. Palantir's innovative solutions and its ongoing expansion into commercial sectors are critical drivers of the bullish outlook.
**Recent Performance:**
Palantir's recent price movements have showcased its ability to maintain relative strength despite broader market volatility. The stock has remained favorably positioned near its upper-tier price range, reinforcing bullish sentiment. Institutional investors have shown confidence near the $135 level, which serves as a springboard for further upward movement.
**Expert Analysis:**
Market experts emphasize Palantir's focus on AI advancements and its role as a strategic partner in government and enterprise operations. This positions the company as a standout player within the data analytics landscape, with continued demand for its services reflecting market optimism. The firm’s technological expertise and its resilience within competitive sectors underpin its long-term growth potential.
**News Impact:**
Recent developments, including government contracts and advancements in artificial intelligence technology, significantly bolster Palantir's outlook. Strategic initiatives to diversify its services and increase penetration into commercial sectors have improved investor sentiment and strengthened the bullish thesis. As AI-related services gain traction globally, Palantir remains well-poised to capture sustained demand and market expansion.
**Trading Recommendation:**
Investors should consider a LONG position in Palantir Technologies, capitalizing on its innovative offerings and strong growth catalysts. The $135 level presents a solid support zone, with price targets at $140 and $145 reflecting near-term opportunities for gains. Tailored stop-loss levels ensure risk mitigation while maintaining exposure to the stock's upward potential.
PUT a little PLTR - $100 ? ok, let's buy there too?As of Friday, June 27, 2025, at 9:19:58 PM PDT, here's an analysis of PLTR:
Current Price & Performance:
Last Price: $130.74 (as of 4:00 PM ET on June 27, 2025)
Today's Change: Down $15.57 (-10.64%)
After-hours price: $134.52 (up 2.89% as of 7:59 PM ET on June 27, 2025)
Previous Close: $146.31
Today's Range: $130.54 - $144.97
52-Week Range: $21.23 - $148.22
Williams Alligator Analysis (Daily Chart):
The Williams Alligator indicator uses three smoothed moving averages, often referred to as the Jaw (blue line), Teeth (red line), and Lips (green line), with specific periods and shifts. The common default settings are:
Lips (Green Line): 5-period Smoothed Moving Average (SMMA), shifted 3 bars into the future.
Teeth (Red Line): 8-period SMMA, shifted 5 bars into the future.
Jaw (Blue Line): 13-period SMMA, shifted 8 bars into the future.
Interpreting the Alligator:
"Sleeping" Alligator: When the three lines are intertwined or very close together, it indicates a non-trending or consolidating market. This is often a period to avoid trading or to take profits.
"Awakening" Alligator: When the lines start to diverge, with the Lips (green) crossing the Teeth (red) and Jaw (blue), it signals a potential new trend forming.
Green crossing above Red and Blue: Suggests a bullish awakening.
Green crossing below Red and Blue: Suggests a bearish awakening.
"Eating" Alligator (Mouth Wide Open): When the lines are fanning out and moving in a clear direction (e.g., Green > Red > Blue for an uptrend, or Blue > Red > Green for a downtrend), it indicates a strong trending market.
Current PLTR Alligator State (Based on recent price action):
Palantir experienced a significant pullback today (-10.64%), which followed a period of strong upward movement and nearing its 52-week high.
Recent Trend: Prior to today's drop, PLTR was in a strong uptrend, likely characterized by the Alligator's mouth being "open" upwards (Green above Red, Red above Blue).
Today's Action: A sharp drop like today's could cause the Lips (green line) to cross below the Teeth (red line), and potentially even the Jaw (blue line), or at least begin to converge. This would indicate:
Potential "Sating" or "Sleeping": The sharp drop suggests the Alligator might be moving from an "eating" phase (uptrend) towards a "sated" or "sleeping" phase, where the trend is losing momentum or consolidating.
Bearish Crossover (Possible): If the green line has crossed below the red and blue lines, it would be a bearish signal, indicating a potential reversal or the start of a downtrend. It's crucial to see the actual chart to confirm the precise line positioning. However, a 10%+ drop from a recent high strongly implies such a shift.
MACD (Moving Average Convergence Divergence) (8,13):
The MACD uses two Exponential Moving Averages (EMAs) to identify momentum and potential trend changes. The standard MACD settings are typically 12-period EMA, 26-period EMA, and a 9-period Signal Line. You've requested (8,13) which means:
MACD Line: (8-period EMA of Close - 13-period EMA of Close)
Signal Line: 9-period EMA of the MACD Line
MACD Histogram: MACD Line - Signal Line
Interpreting MACD:
MACD Line crossing above Signal Line: Bullish crossover, suggests upward momentum.
MACD Line crossing below Signal Line: Bearish crossover, suggests downward momentum.
MACD Histogram: Positive and increasing indicates strengthening bullish momentum. Negative and decreasing indicates strengthening bearish momentum.
Current PLTR MACD (8,13) State:
While specific MACD (8,13) values aren't readily available without a real-time chart for today's close, we can infer based on the significant price drop:
Prior to Today: Given PLTR's recent upward trend, the MACD (8,13) was likely positive, with the MACD line above its signal line, and a positive histogram.
Today's Action: A sharp 10%+ decline would almost certainly cause a bearish crossover on the MACD (8,13). This means the MACD line would have likely crossed below its signal line, and the MACD histogram would have turned negative and started to decrease, indicating strong bearish momentum and a potential shift in the short-term trend.
Combined Analysis for PLTR:
Today's significant drop in Palantir's stock price strongly suggests a shift from a bullish trend to a more bearish or consolidating phase.
Williams Alligator: The "mouth" of the Alligator, which was likely open upwards, has probably begun to close or even reverse, with the green Lips line potentially crossing below the red Teeth line, signaling a weakening or reversal of the uptrend. The Alligator is likely moving towards a "sated" or "sleeping" state.
MACD (8,13): A bearish MACD crossover is highly probable, with the MACD line falling below its signal line and the histogram turning negative, confirming the strong downward momentum.
Conclusion:
Based on the daily chart analysis using Williams Alligator and MACD (8,13) indicators, Palantir's current price action indicates a significant loss of bullish momentum and a potential short-term reversal or consolidation. Both indicators likely point to a bearish shift following today's sharp decline.
Important Disclaimer: This analysis is based on available data and general interpretations of these indicators. Technical analysis is not foolproof and should be used in conjunction with fundamental analysis and other forms of research. Market conditions can change rapidly. Always consult with a qualified financial advisor before making any investment decisions.
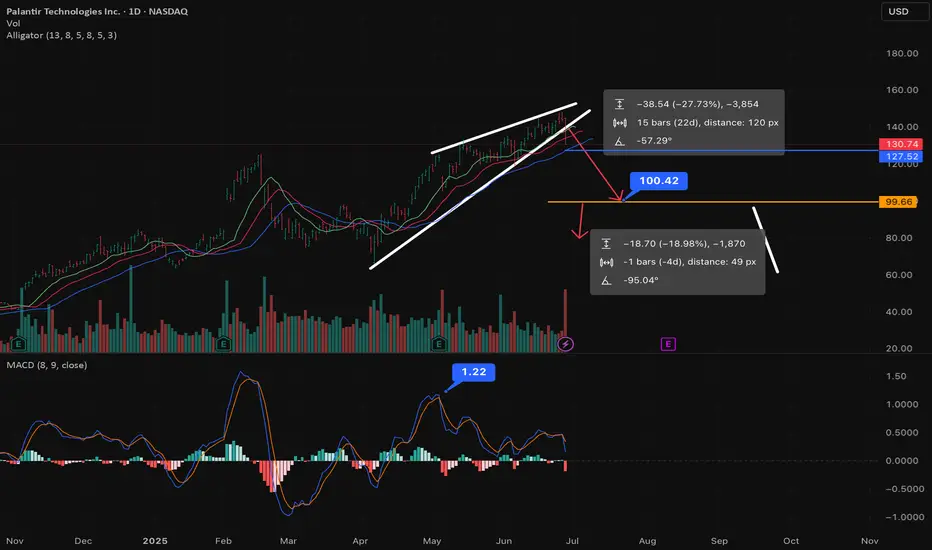
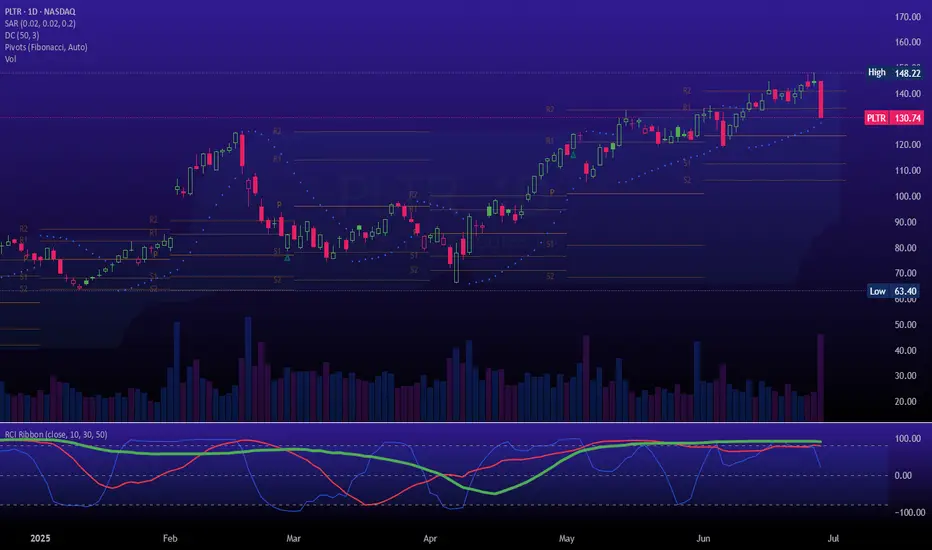
PLTR just started the first phase of the Wyckoff distributionBased on the weekly and daily charts provided for Palantir (PLTR), here is a Wyckoff analysis and a corresponding diagonal option spread strategy.
### **Wyckoff Phase Analysis of PLTR**
From the price and volume action on the charts, **PLTR appears to be in the initial stages of a Wyckoff distribution phase (Phase A)**. This phase marks the stopping of the prior uptrend.
* **Weekly Chart:** The long and powerful uptrend is characteristic of a **Markup** phase. However, the recent price action shows a significant change. The peak near $148.22, followed by a sharp decline, can be interpreted as a **Buying Climax (BC)** and an **Automatic Reaction (AR)**. This is a classic sign that large institutions ("smart money") may be starting to sell or distribute their shares.
* **Daily Chart:** The daily chart shows a failure to make new highs, followed by a very sharp sell-off on a spike in volume. This represents a significant **Sign of Weakness (SOW)** and confirms that the character of the market has changed from bullish to potentially bearish or neutral. The uptrend has been broken.
In summary, the strong upward momentum in PLTR has halted, and the stock is showing clear signs of entering a distribution or consolidation phase at these higher prices.
### **Trading PLTR with a Bearish Diagonal Put Spread**
Given the analysis that PLTR is entering a distribution phase, a neutral to bearish outlook is appropriate. A **bearish diagonal put spread** is a suitable strategy to profit from a potential decline in price or even from the stock trading sideways, as it benefits from time decay.
This strategy involves buying a longer-dated, in-the-money (ITM) put option and selling a shorter-dated, out-of-the-money (OTM) put option.
**How to Structure the PLTR Trade (Current Price ~ $130.74):**
1. **Buy a Long-Term Put:**
* **Action:** Buy to open a put option.
* **Expiration:** Choose a later expiration, for example, **4-6 months out**, to give the distribution and potential markdown phase time to develop.
* **Strike Price:** Select an in-the-money (ITM) strike to create a bearish position. A strike price around **$140 or $145** would be appropriate.
2. **Sell a Short-Term Put:**
* **Action:** Sell to open a put option.
* **Expiration:** Select a near-term expiration, typically **30-45 days away**.
* **Strike Price:** Choose an out-of-the-money (OTM) strike below the current price. For instance, selling the **$120 strike** would provide income and define your risk.
**Example Trade (Illustrative Purposes Only):**
* **Buy 1 PLTR put with an expiration 5 months away at a $140 strike.**
* **Sell 1 PLTR put with an expiration in 35 days at a $120 strike.**
The objective is for the short put to lose value from time decay and expire worthless, allowing you to keep the premium. This premium reduces the cost of your long-term bearish put. You can then sell another short-term put for the following month to continue generating income against your long-term bearish position.
> ***Disclaimer:*** *This content is for informational purposes only and should not be construed as financial advice. Options trading involves substantial risk and is not appropriate for all investors. Please conduct your own research and consult with a qualified financial professional before making any investment decisions.*
PLTR – Preparing for a Pullback? Or Just Loading Up the Ammo?🚀Palantir (PLTR) has been riding the AI wave hard, reaching fresh highs recently on strong earnings and explosive momentum. But even rockets need to refuel and that’s where our strategy comes in. 📉📈
After tagging all-time highs, PLTR could enter a healthy pullback phase. That’s not weakness that’s opportunity for the smart trader. Here are the levels I’m watching to re-engage:
🔹 Entry Zones
✅ $128 – first buying zone, post-euphoria fade
✅ $120 – deeper support & volume base
✅ $108 – high-conviction, long-term add level
📊 Why it matters:
Palantir just boosted guidance, U.S. commercial deals are booming, and the AI business remains strong. But valuations are stretched, and macro headwinds could test investor confidence. Any dip into these zones might offer a golden entry.
🎯 Profit Targets
💰 TP1: $142 – short-term bounce potential
🚀 TP2: $155 – previous bullish target from analyst upgrades
🌕 TP3: $180+ – longer-term breakout if AI narrative holds strong
⚠️ Disclaimer: This is not financial advice. Always do your own research and manage risk according to your strategy.
Who’s with me on PLTR?PLTR is showing a very clear and strong bullish trend, making this an A+ trade setup in my book – especially given how close the price is to a key level. 🔍
🔹 Liquidity Sweep Setup:
On Friday, June 13, the opening swept the liquidity created on Wednesday, June 11 at 9:40 AM – an institutional move that left an imbalance candle.
Then, at 8:30 AM on the same Friday, liquidity was taken below the 5:30 AM low, setting the stage for a strong institutional move at the 9:30 AM opening.
Just before the open, at 9:20 AM, a Fair Value Gap (FVG) was formed – this became our focus entry area, which also aligned with resistance points from June 10, 11, and 13. 📊
🔹 A+ Trade Conditions:
What makes this trade so attractive is how the 9:30 AM candle created bearish liquidity, giving us a clear liquidity point to target for our entry. This aligns perfectly with the Vep Trader liquidity sweep strategy. ✅
📍 Trade Setup:
Entry: $133.33
Stop Loss: $132.00
Take Profit: $140.00
Let’s see how this plays out! Who’s riding this wave with me? 🌊💰
#PLTR #Stocks #TradingView #LiquiditySweep #FVG #PriceAction #SmartMoney #DayTrading #OptionsTrading #StockMarket #BullishSetup #VepTrader #TechnicalAnalysis #MarketStructure
"Steal the Market: PLTR Trading Strategy Revealed!"🌟 Hola, Money Snatchers & Market Rogues! 🌟
Ready to hit the vault? 💰💸✈️
Here’s the ultimate plan for lifting loot from PLTR (Palantir Technologies Inc.) using the infamous Thief Trading Style. This is no rookie job—we’ve got the techs and the fundamentals to nail the target. Our sights are locked on the high-stakes Red Zone: nuclear resistance, overbought territory, trend reversals, and that sweet electric trap where traders and bearish bounty hunters lie in wait. 🏆💸 It’s time to bag those profits and live like a kingpin!
Entry Point 📈:
Doors are wide open! Snatch that bullish loot at any level—it’s a free-for-all! For extra stealth, set your buy limits around recent 15–30 min swing highs or lows. Pro tip: throw in some chart alerts to stay ahead of the game.
Stop Loss 🛑:
Our Thief SL lands at the recent 2h swing low (116.00) on a swing-trade basis—tight enough to dodge the cops but wide enough to let the heist breathe. Adjust based on your bankroll and risk appetite—don’t get greedy, and always plan your getaway.
🏴☠️ Target 🎯: 152.00—or duck out early if the sirens start blaring!
🧲 Scalpers, listen up 👀:
Only scalp on the long side—no backstabbing shorts here! If you’ve got the bankroll, go all-in; otherwise, team up with swing traders and ride the big wave. Use a trailing SL to keep your loot safe from sudden ambushes.
PLTR (Palantir Technologies Inc.) is on a bullish tear—thanks to a mix of market signals and that sweet fundamental juice:
📰🗞️ Stay locked in with the latest—fundamentals, macro reports, COT updates, geopolitical heat, sentiment, intermarket moves, index breakdowns, position shifts, and trend forecasts. Link’s in the bio—don’t miss it! 👉👉👉
📌 Pro Tip: Markets can flip faster than a getaway car—stay sharp and ready to pivot.
⚠️ Trading Alert:
News drops can spike the alarm system—here’s how to keep your loot safe:
🚫 Skip new trades during releases
🚏 Lock in profits with trailing stops—no one likes getting caught!
💖 Show some love for the crew—💥 Smash that Boost Button 💥—and keep the Thief Trading Style alive. Let’s make bank every day like true market outlaws! 🏆💪🤝❤️🎉🚀
Stay tuned—another big score’s just around the corner! 🤑🐱👤🤗🤩

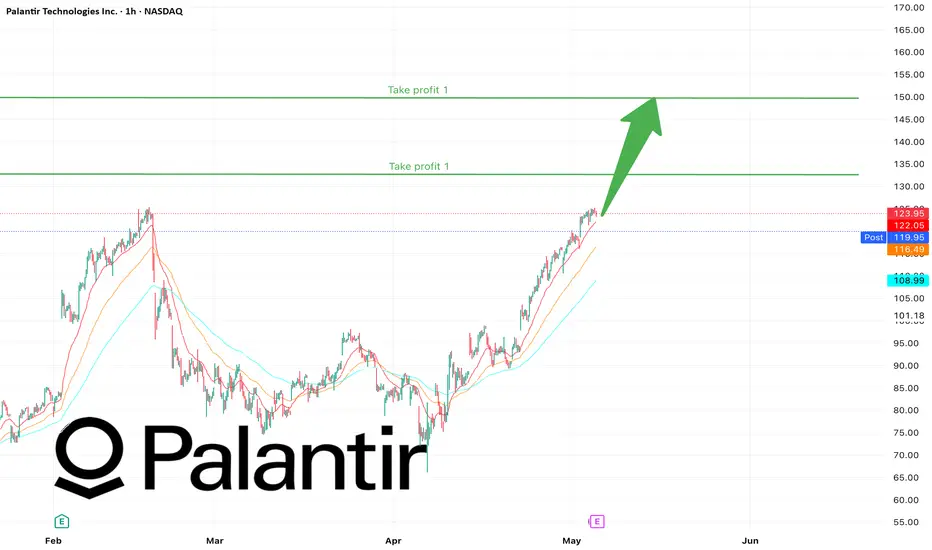
PLTR NEVER disappoints Market Context
NASDAQ:PLTR | Current Price: $120.28
1-Month Move: +50.83% (from $82.30)
1-Year Move: +449.91% (from $22.60)
Options Data
IV Rank: 77.2 (juicy premiums )
Put/Call Ratio: 0.90 (slightly bullish tilt )
Max Pain: $115.00
High OI: $125 calls , $110 puts
Trade Setup
Strategy: Single-leg, naked call (bullish, defined risk)
Instrument: PLTR
Direction: CALL
Strike: $130.00 (premium $0.85, fits $0.50–$1.00 band)
Expiry: 2025-05-09 (first weekly post-earnings)
Entry Price: $0.85
Entry Timing: Pre-earnings close (2025-05-05)
Profit Target: $1.70 (~100% gain )
Stop Loss: $0.43 (~50% loss )
See you after earnings.
BEST Ai Signals on the market :)
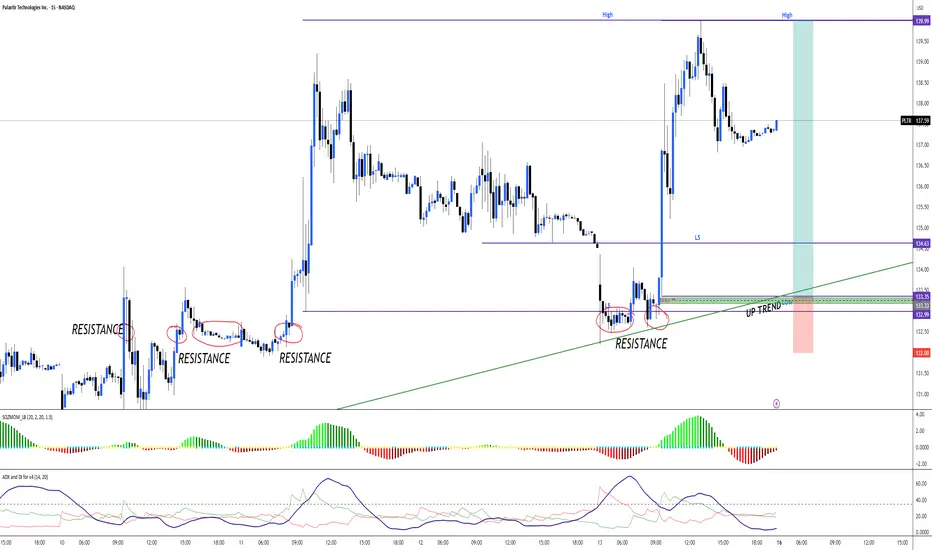
PLTR Quick Take: GEX & Chart Analysis-Jun 161️⃣ Gamma Context (1‑Hour Chart)
* A strong call gamma wall is forming around $143–145, with positive NET-GEX resistance near $150—dealers likely hedging up here, creating a short-term cap.
* Put gamma support sits at $131–134, providing a risk floor.
* Implied volatility sits mid-range (~25%), making options moderately priced—with bull call spreads around $140–145 being attractive if momentum aligns.
2️⃣ Price Structure & Momentum (15‑Min Chart)
* Support: Price held just above the $132–134 consolidation zone and bounced twice, showing clean rotation from support → BOS.
* Resistance: After the break above $139–140, sellers stepped in near $142–143 supply area, causing a CHoCH (Change of Character) indicating potential stall or pullback.
* Trendline dynamics: A rising trendline from morning lows offers intraday context. As long as that holds, upward bias remains valid.
3️⃣ Trade Idea & Execution
* Bullish Base: If PLTR climbs and retests $139–140 with momentum, consider initiating a $140–145 bull call spread. This plays for a move into the gamma wall while capping defined risk.
* Stop‑loss level: Watch for a dip below the trendline or $136–137. If that breaks, shift to neutral—no entries—until a fresh structure forms.
* Alternative scenario: A breakdown below $134 could trigger a put spread down toward $131–132, leveraging the put-side gamma wall as a target.
💡 Why This Setup?
* Gamma-based resistance aligns your trade horizon with key option dynamics—maximizing R/R while staying sensible.
* Defined-risk bullet spreads offer clarity and cost efficiency in these mid IV levels.
* Confluence on the chart—support hold and structural rotation—boosts confidence in directional bias.
⚠️ TradingView Disclaimer
This content is for educational purposes only and not investment advice. Options involve significant risks and may not be suitable for all investors. Always determine your strategy, position sizing, and risk management before trading. Ensure clarity on structure breakout or breakdown before opening a position.
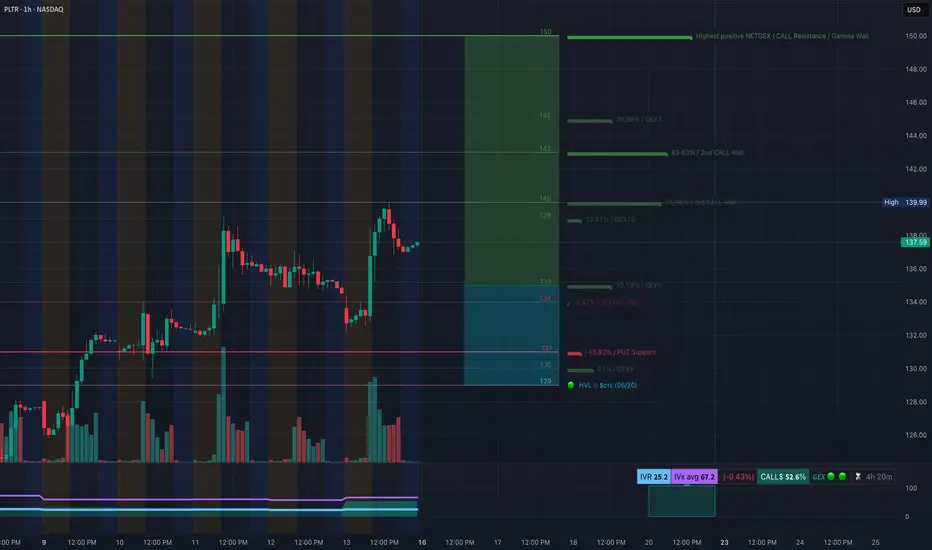
Will PLTR Push Through the Gamma Wall? Jun 24🔍 Overview:
Palantir Technologies (PLTR) is trading at $139.92 (+1.91%) as of June 23 close. After days of range-bound action, bulls are trying to reclaim critical levels while battling overhead gamma resistance. With Smart Money Concepts showing both BOS and CHoCH, the next move could be explosive.
🔩 Market Structure (SMC View):
* 15m Chart:
* Clear Break of Structure (BOS) upward in morning session.
* Followed by Change of Character (CHoCH) bearish in the afternoon.
* Price tapped into a green demand zone and reacted with a bounce near $137.
* A re-test of the red CHoCH supply zone around $140.50–$141.30 is in progress.
* Trendlines suggest a tightening wedge, with the top of the channel converging near $144.
🧠 GEX and Options Sentiment:
* Gamma Wall (Call Resistance):
🔼 $142–143 zone – Highest net GEX (CALL wall), where market makers may start shorting gamma, creating resistance.
* Major Call Walls:
* $145 (12.37% GEX)
* $149–150 (Strongest 2nd layer walls)
* PUT Wall Support:
* $130 major PUT support (7.49% wall)
* $134 is minor soft support area.
* IV & Sentiment:
* 📉 IV Rank (IVR): 17.3 – low, indicating cheap premiums.
* Call Buying Strength: 38.4% – moderately bullish.
🔄 Key Zones:
* 🔴 Supply Zone (CHoCH): $140.50–$141.30
* 🟢 Demand Zone (CHoCH): $135.97–$137.30
* ⚠️ Trap Range: Between $137 and $141 — liquidity likely to be swept in both directions before a move.
📈 Trade Setups:
Bullish Scenario:
* Entry: On break and close above $141.50 with retest confirmation.
* Targets:
* $143 → Minor profit-taking zone
* $145 → Next GEX wall
* $149–$150 → High GEX squeeze potential
* Stop: Below $137.30 or mid-channel around $136.50
📌 Ideal if price reclaims above the CHoCH zone and builds volume support near $141.
Bearish Scenario:
* Entry: Rejection from $141.30 supply or breakdown under $137.
* Targets:
* $135.97 → First reaction zone
* $134 → Secondary support
* $130 → Strong GEX-supported PUT level
* Stop: Above $141.60 or structure high of $142.15
📌 Watch for reversal signs inside supply zone or heavy selling into demand.
🔮 Bias:
Neutral-to-Bullish → ⚔️ Battle at $141 CHoCH zone. Gamma resistance is real, but if broken, it could fuel a gamma squeeze toward $145+.
💡 Actionable Advice:
* Scalpers: Fade resistance near $141.30 unless it breaks clean.
* Swing Traders: Wait for break and retest of $141.50 → target $145+.
* Options Traders:
* Low IVR = Great time to buy CALLS if bullish.
* If expecting chop, long straddle at $140 may work before the move.
📌 Conclusion:
PLTR is consolidating right beneath a major gamma wall and previous SMC CHoCH level. If bulls can break through $141.50 with strength, we could see a momentum move to $145 and even $150 this week. Until then, volatility traps remain likely within $137–$141.
Disclaimer: This analysis is for educational purposes only and does not constitute financial advice. Always do your own research and trade responsibly.

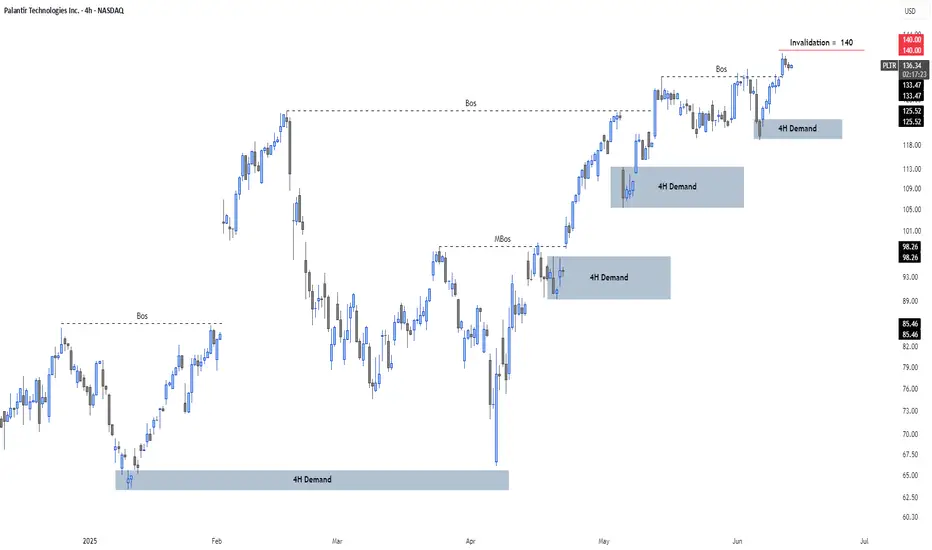
PLTR – Structure Holding… For Now (4H Outlook)Palantir is compressing near ATHs, but showing early signs of exhaustion on higher timeframes. On the 4H chart, structure is still bullish — but fragile.
🔍 Key Technical Structure
• Series of Breaks of Structure (BoS) confirming the bullish trend
• Price is currently sitting above the $125 4H demand zone, near previous highs
• Invalidation for the bearish thesis sits at $140
🧭 Strategy Outlook
If $125.50 fails:
→ Next demand: $113.00–$105.00
→ Below that: strong support zone at $98.00–$89.00
If $140 breaks and holds:
→ Bearish divergence invalidated
→ Continuation toward new highs likely
📌 Summary
Price is at an inflection point. Structure remains bullish, but momentum is weakening across higher timeframes and RSI divergence is still active.
Watching $125.50 as the trigger:
Below = potential sell-off
Above = stay patient
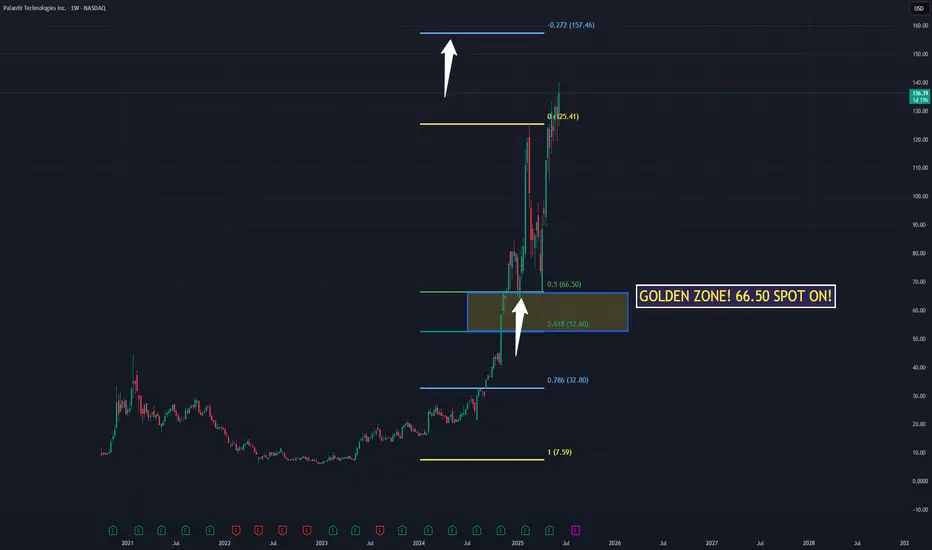
$PLTR ONCE IN A LIFETIME FIBONACCI PYRAMID LONG TERM Target 157NASDAQ:PLTR ONCE IN A LIFETIME FIBONACCI PYRAMID
LONG TERM Target 157 🎯
The 50% Golden ZONE held at 66.50 in APRIL with a MASSIVE ALGO STEPPING IN
I am looking for a new 6 figure play here ON DIP BUYS with leaps! I will alert all here
NO CHARGE just Drop a 👍for me!

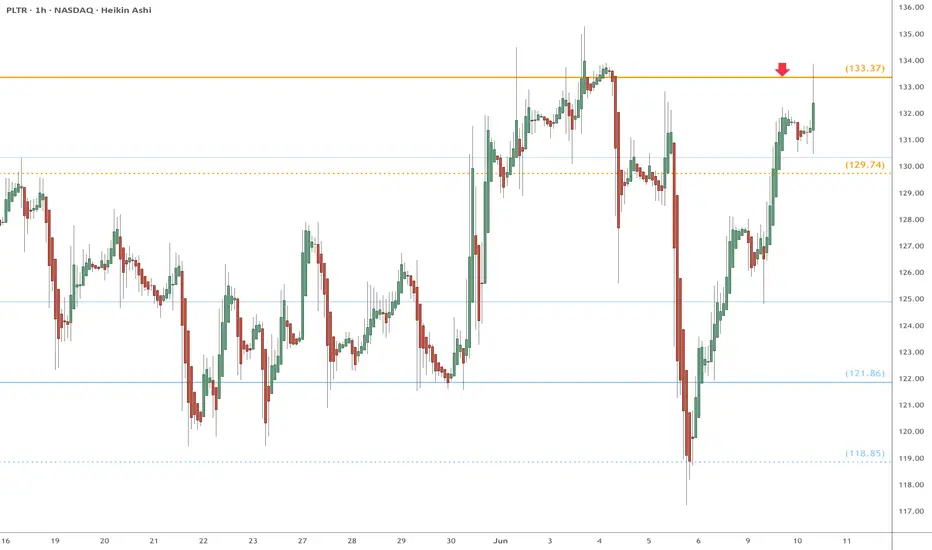
PLTR eyes on $133.37 (again): Golden Genesis to BREAK this time?PLTR has made a round trip to our Golden Genesis.
Looking for a Break-and-Retest of this proven fib.
This time we should POP nicely after it breaks.
.
Full Frontal of its Genesis Fib:
See "Related Publications" for previous EXACT plots --------------->>>>>>>
.
Long Opportunity for Palantir Technologies: Next Week Trading InCurrent Price: $127.72
Direction: LONG
Targets:
- T1 = $131.80
- T2 = $135.00
Stop Levels:
- S1 = $125.50
- S2 = $122.90
**Wisdom of Professional Traders:**
This analysis synthesizes insights from thousands of professional traders and market experts, leveraging collective intelligence to identify high-probability trade setups. The wisdom of crowds principle suggests that aggregated market perspectives from experienced professionals often outperform individual forecasts, reducing cognitive biases and highlighting consensus opportunities in Palantir Technologies.
**Key Insights:**
Palantir Technologies (PLTR) exhibits mixed indicators, with short-term bearish momentum counterbalanced by solid long-term support from government contracts and fundamental strengths. Breaking resistance levels at $135 could trigger a shift in sentiment and enable further upward momentum, providing opportunities for long positions. Monitoring critical support zones and broader market activity is essential.
**Recent Performance:**
Palantir has recently shown signs of short-term weakness, retreating from a prior high of $137.90 and closing below last week's price of $131.78. This decline suggests hesitation among market participants while leaving room for potential recovery based on favorable technical setups.
**Expert Analysis:**
Analysts remain optimistic about Palantir’s long-term viability due to its sustained pipeline of government contracts, a distinct advantage within the tech sector. However, resistance at $135 remains a critical challenge for the stock to regain bullish sentiment and achieve higher targets. While current bearish movements hint at caution, broader support above major moving averages signals resilience.
**News Impact:**
No new headlines have been identified as immediate catalysts for price movement. However, Palantir's reliance on government contracts underpins its stability. Tracking developments tied to contract renewals or expansions will be essential for assessing the stock's performance trajectory.
**Trading Recommendation:**
Traders should consider a long position in Palantir Technologies, aiming for a breakout above $135 while maintaining disciplined stop-loss levels at $125.50 and $122.90. A shift in sentiment and positive momentum could enable the stock to achieve upside potential with targets at $131.80 and $135.00.