Tech on the Edge: SMH vs. QQQ Signals Caution Amid Bull MarketIntroduction:
While we remain enthusiastic about the strength of the current bull market, emerging signs of stress in capital flows warrant a closer look, particularly in the tech sector. One key metric to monitor is the ratio between semiconductors (SMH) and the Nasdaq 100 (QQQ). This ratio acts as a barometer for tech sector health: when SMH outperforms QQQ, it indicates a risk-on environment; conversely, QQQ outperforming SMH raises caution flags.
Analysis:
Tech Sector Barometer: The SMH-to-QQQ ratio has historically been a reliable indicator of momentum in the tech sector. Outperformance by SMH reflects strong demand for semiconductors and broader tech health, while underperformance signals potential concerns.
Emerging Concern: Currently, we’re observing the potential development of a rounding top formation in the SMH-to-QQQ ratio. While this formation isn’t confirmed, a breakdown below key support would validate it, signaling broader weakness in the tech sector.
Critical Inflection Point: For now, chip bulls must take control and push this ratio higher to maintain sector strength and prevent a broader pullback in the market. Failure to do so could signal a shift in sentiment and increased vulnerability in tech stocks.
Conclusion:
The SMH-to-QQQ ratio is at a critical juncture, with the potential to dictate near-term momentum in the tech sector. While the bull market remains intact, any confirmed weakness in this ratio could signal broader vulnerability in tech stocks. Will chip bulls step up to defend the sector, or are we on the cusp of a pullback? Share your thoughts below!
Charts: (Include relevant charts showing the SMH-to-QQQ ratio, the potential rounding top formation, and key support levels)
Tags: #Semiconductors #Nasdaq #TechSector #SMH #QQQ #MarketTrends #TechnicalAnalysis
SMH trade ideas

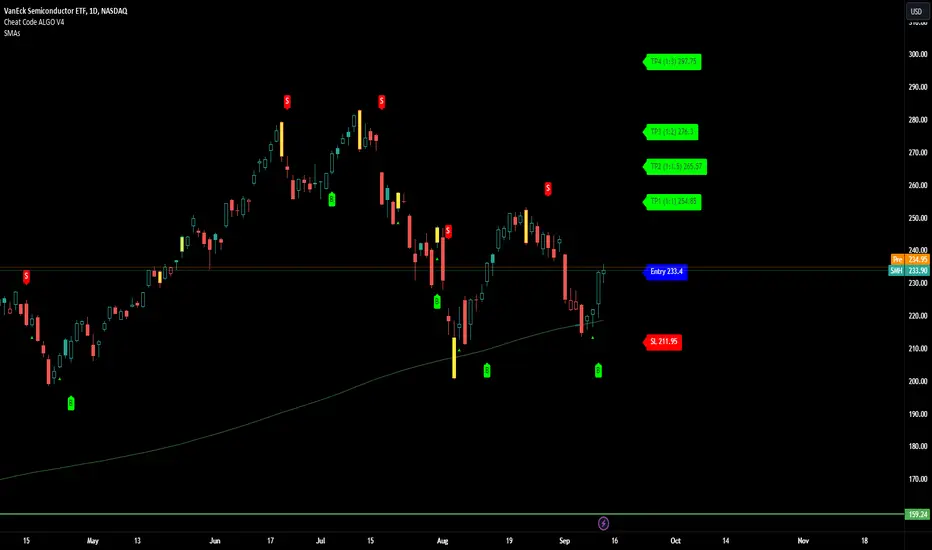
SMH bounce to $245MODs have suggested that I provide more detail about the picks I make.
Sorry. I'm not as verbose as y'all, and I don't like things to be complicated.
My trading plan is very simple.
I buy or sell at top & bottom of parallel channels.
I confirm when price hits Fibonacci levels.
So...
Here's why I'm picking this symbol to do the thing.
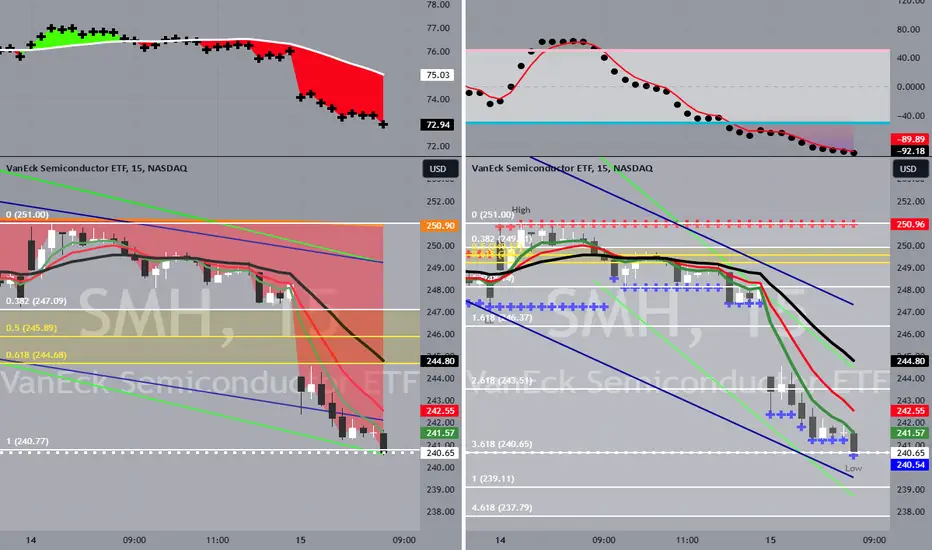
Price at or near all bottom channels (period 100 52 39 & 26)
Stochastic Momentum Index (SMI) at oversold level
VBSM is spiked negative
Price at near 3.618 Fibonacci level
In at $240.55
Target is $245 or channel top
Stop loss is manual
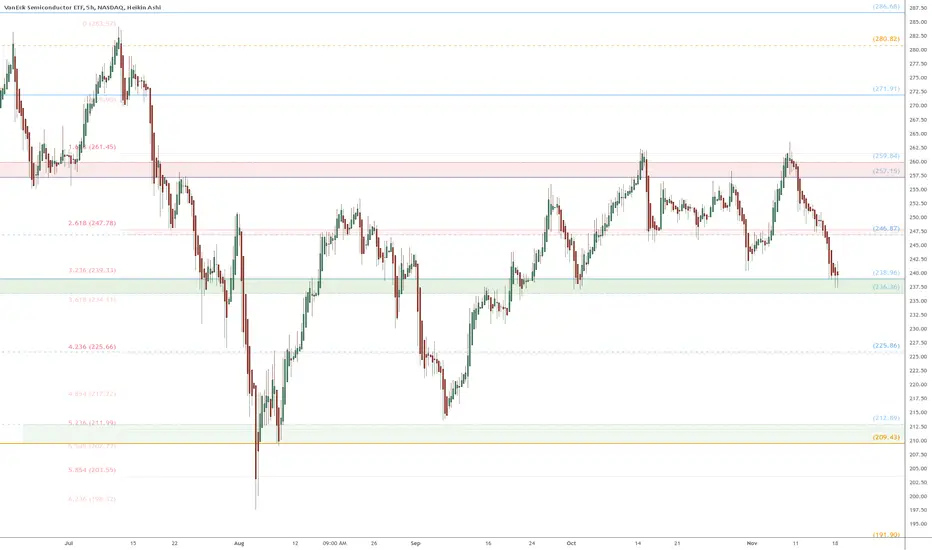
SMH eyes on $237: Key support that needs to hold for next leg upChip stocks have been cooling down for a few months.
SMH covers a cross section of the industry and is dipping.
Currently testing a key support acting as bottom of range.
$ 236.36-238.96 is the current support of interest.
$ 246.87-247.78 above is minor but key resistance
$ 225.66-225.86 below is next support for stop loss.
.
All of these zones were obvious in last analysis:
.
The major levels for SMH are set by its "Genesis Sequence":
==================================================================
$SMH - Can 200 DMA provide support again?NASDAQ:SMH
200 DMA has been a reliable support during this uptrend. Expecting a bounce in semiconductor stocks around the 200 DMA. 👀
In the worst-case scenario, if the 200 DMA fails as support, it could drop to the $230 to $220 area, where it might find the ultimate bottom. That's where I might double down on semis.
As always, I share my opinions and trades. I'm not suggesting that anyone follow my trades. You do you.
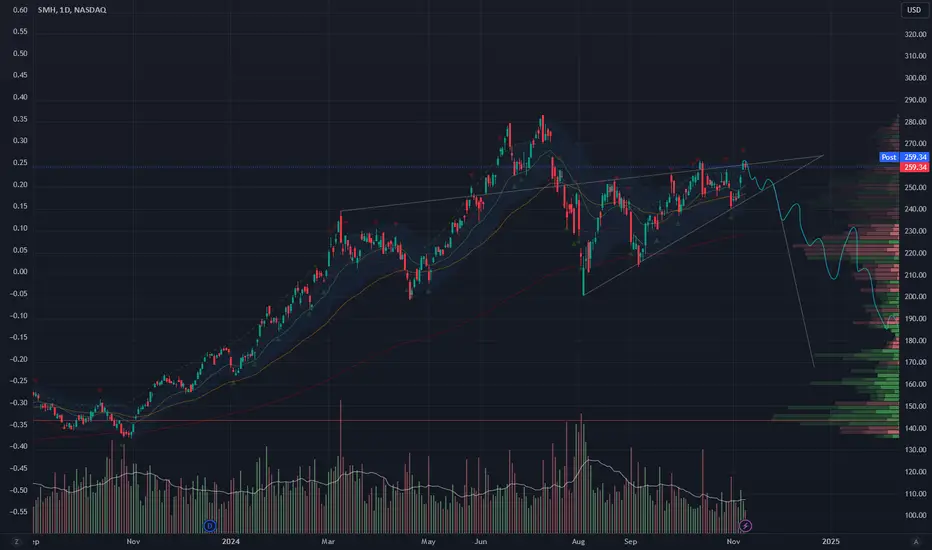
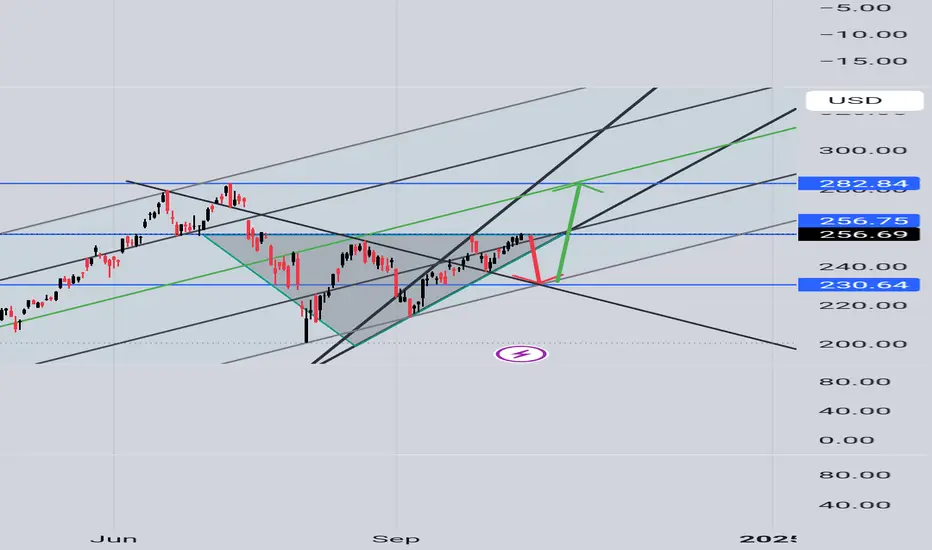
Rising WedgeRising wedge hit the 4th time on the tail of election.
Seeing euphoric sentiment. Just closed for the week, but didn't break wedge.
On the watch for next week if we head down to tag the bottom of wedge or continue up to break the rising wedge.
If it break upwards, likely to tag the gap to 270.
If it breaks down, 240. 200 if it continues.
Opening (IRA): SMH October 18th 220 Covered StraddleComments:
Third highest 30-day IV (46.1%) on my options highly liquid ETF board behind BITO and TQQQ.
There are two different aspects to this trade, the first being the 220 monied covered call with the short call at the -75 delta. I had to route this as two separate trades and got filled for covered call aspect for a 213.35 debit.
The same strike short put is at the +21 delta strike, I got filled for a 5.05 credit.
Metrics:
Buying Power Effect: 428.30
Break Even: 213.35 for the covered call; 214.95 for the short put
Max Profit: 6.65 (for the monied covered call) + 5.05 (for the short put) = 11.70
ROC at Max: 2.73%
50% Max: 5.85
ROC at 50% Max: 1.37%
Generally speaking, I'll look to take profit at 50% max; otherwise, I'll look to roll out the short straddle as a unit to maintain net delta at or below +50 (100 delta for the shares, -75 for the short call, + 25 for the short put).

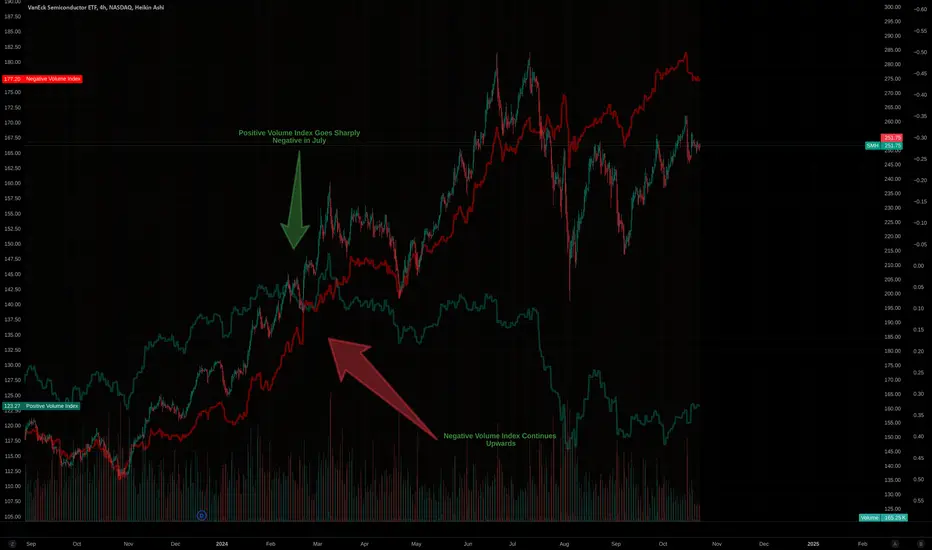
positive vs negative volume index on smhbig divergence in july, responding to crystal ball fighter pilot guy

pvi/nvi divergence in smhresponding to a ball gazer, showing SMH had made almost all of its recent gains in low volume activity
Semiconductors vs. Nasdaq: Key Indicator of Tech MomentumIntroduction:
The ratio between semiconductors NASDAQ:SMH and the Nasdaq 100 NASDAQ:QQQ serves as a key indicator of tech sector momentum and near-term risk sentiment. When SMH outperforms QQQ, it signals a "risk-on" environment, reflecting strong demand for semiconductors and overall tech sector health. Conversely, if QQQ outperforms SMH, it suggests a "risk-off" environment, pointing to concerns over weakening chip demand.
Analysis:
Risk Sentiment: The SMH-to-QQQ ratio provides insights into tech momentum. A higher SMH performance often indicates robust chip demand, a positive signal for the broader tech sector. On the other hand, when QQQ outperforms, it signals caution, possibly reflecting waning demand for semiconductors.
Bullish Outlook: Recently, the SMH-to-QQQ ratio has formed a higher low, reinforcing a bullish outlook for semiconductors. This higher low is a positive sign not just for the semiconductor industry but for the broader market as well, as semiconductors often lead market rallies.
Conclusion:
The recent bullish signal in the SMH-to-QQQ ratio suggests tech sector strength, with semiconductors likely leading the way. This is a critical metric for assessing near-term market momentum, so traders should keep a close eye on this ratio to gauge potential shifts in sentiment. What’s your take on this trend? Feel free to share your thoughts in the comments!
Charts: (Include relevant charts showing the SMH-to-QQQ ratio and the higher low formation)
#Semiconductors #Nasdaq #TechSector #SMH #QQQ #RiskOn

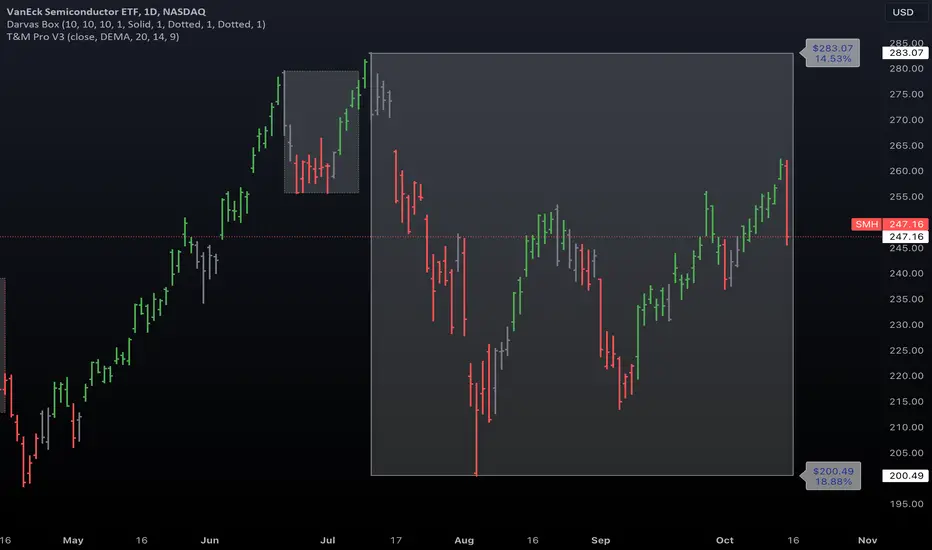
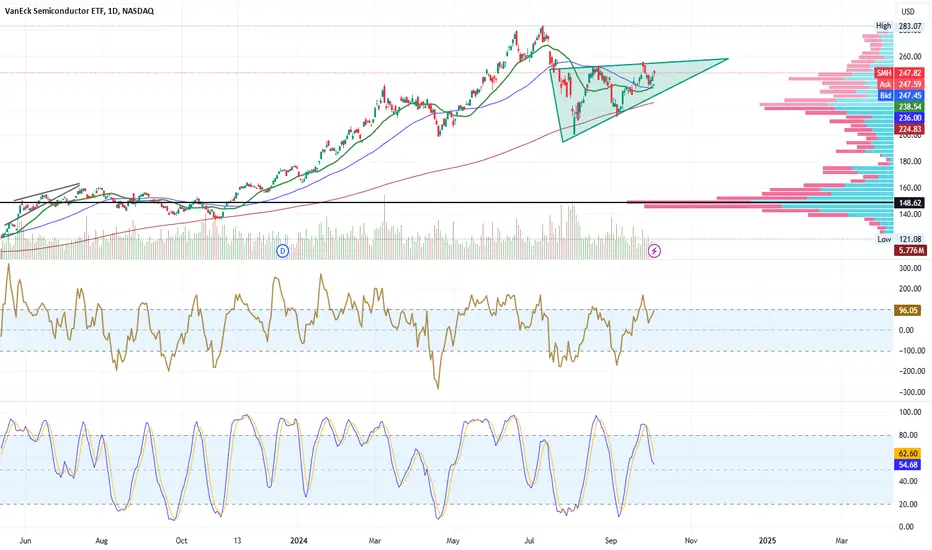
Bearish Reversal in VanEck Semiconductor ETF (SMH)The NASDAQ:SMH ETF shows a significant price decline, with a recent drop of 5.40%, as highlighted by the red bar. This price action suggests a bearish reversal after hitting a high of 283.07. The current support level is around 200.49, marking an 18.88% drop from the recent high. Additionally, the Darvas Box indicates a range between 247.16 and 283.07, suggesting potential consolidation in this area before the next directional move. The downward trend aligns with overall market corrections in the semiconductor sector, which could present a short opportunity if price breaks below key support levels. Traders should keep an eye on macroeconomic factors influencing this sector, as well as earnings reports that might impact semiconductor stocks. NASDAQ:ASML
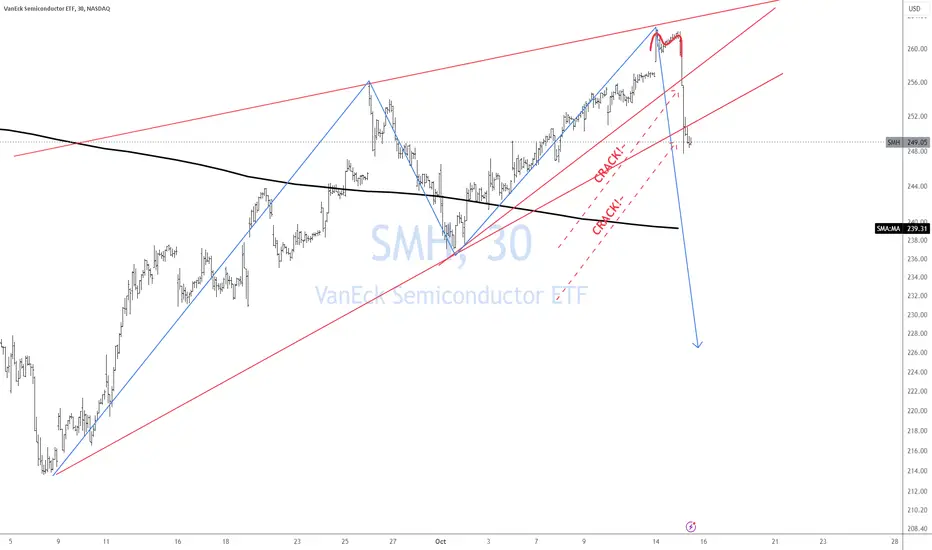
SMH Double Crack!Semiconductors just collapsed leading to a double crack of two trend lines after a completion of wave 3 up and topping M pattern.
Caution is in order as this could lead to something much more.
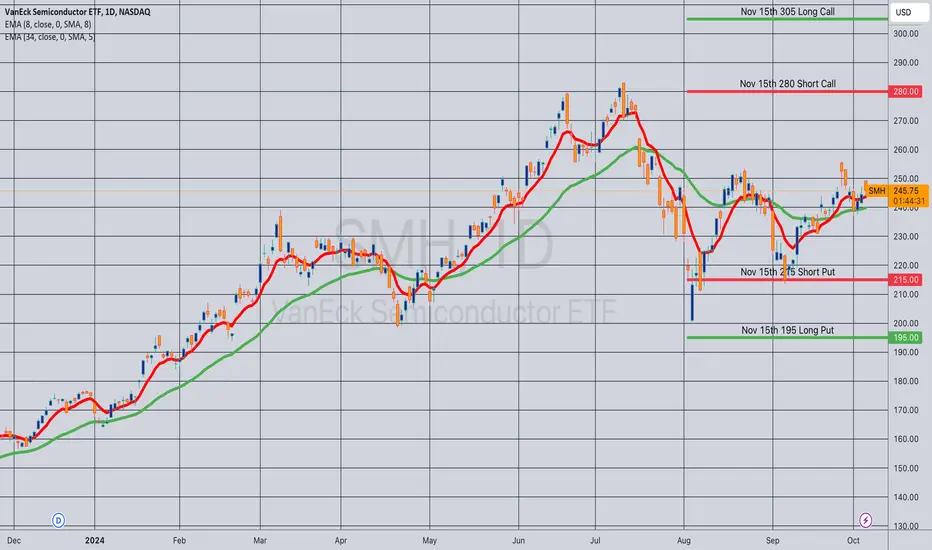
Opening (IRA): SMH Nov 15th 190/215/280/305 Iron Condor... for a 4.13 credit.
Comments: IV remains "adequate" here at 39.1%. Selling the 16 delta short options and buying the wings 1/10th of the price of the underlying out from there ... .
Metrics:
Buying Power Effect: 20.87
Max Profit: 4.13
ROC at Max: 19.79%
50% Max: 2.07
ROC at 50% Max: 9.90%
Will generally look to take profit at 50% max/roll up untested side on side test.
Smh pullback to 230SMH may pull back to fill the gap above 230 before breaking out. Volume has been looking weak for bulls. So a retracement may need to happen before we have another breakout above resistance and run to retest all time highs
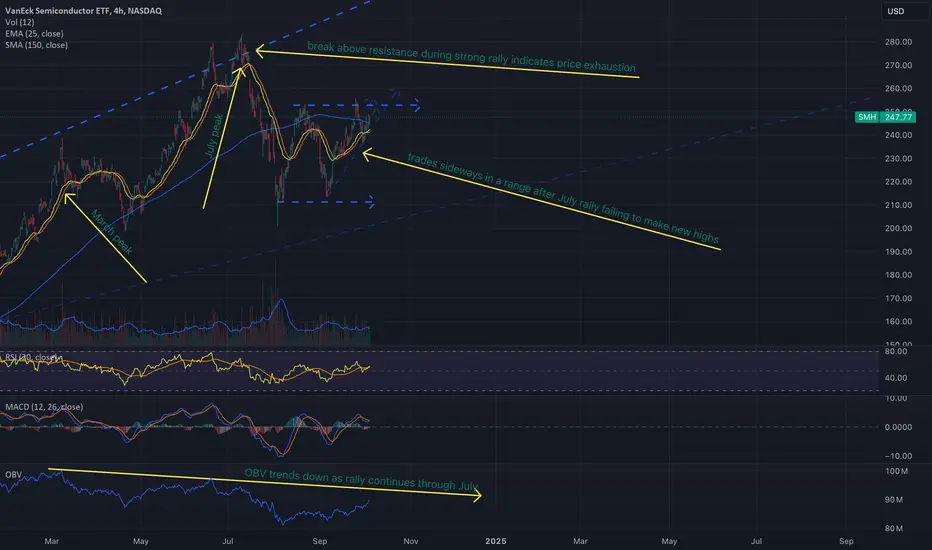
SMH shows long term signs of troubleSMH fails to make new highs since July peak going into sideways trend. This paints a picture of a long term reversal to bear side coming
Comparing OBV trend with the March and July peak, we see that OBV diverges downwards while price continues indicating reversal
After severe sell off in August, we see that price trends sideways failing to make new highs
The sideways trend is during a typical rough time of the year, so weakness and volatility is expected
Nov and Dec normally bring in strong rallies
We could be simply looking at a pullback in time as ETF takes a breather from July peak, before rallying continues. The other alternative is that this may be distribution phase of a high risk sector preparing for a huge sell off.
SMH maybe forming an island gap reversalSMH lately broke above its downward trend that looked promising as a turning from this long ward slide we have been in. Selling may not be over yet
After gapping up into more bullish territory it held for a day, stock gapped back down again
Forming an island gap
We could see the stock come back down into its original trading territory
SPY is currently trading very high at the moment. As SPY contracts we should also see SMH falling as well.

SMH fails to break through resistanceSMH rallied to key resistance and failed to break through. Gapped down next trading day. Looking to make another attempt at the resistance.
SMH gapped down with volume after failing to break through
started to recover as smart money took over in later day trading
RSI is now below its SMA smoothing line
If this pattern holds trying to break through we may not see selling off with volume until we reach trend support

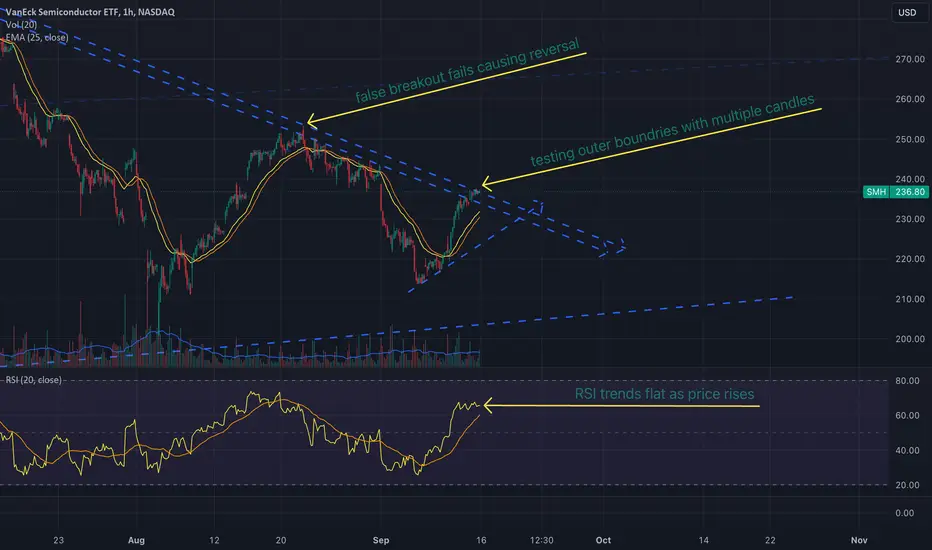
SMH now testing outer boundariesSMH experienced a significant rally and now showing signs of weakness and a potential reversal coming.
experienced a short lived false breakout back in Aug 22
We are now back in breakout zone again this time with more candles indicating more bulls coming in than last breakout
RSI is now trending flat as price continues to rise, signs of rsi divergence signaling reversal maybe coming
Overall SMH looks to be showing weakness in the rally and most likely turning around to sell off soon.
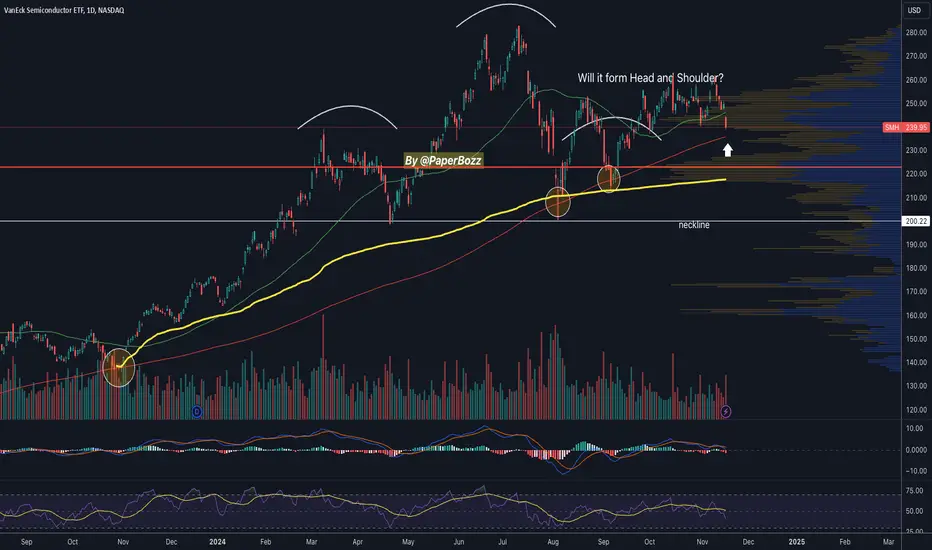
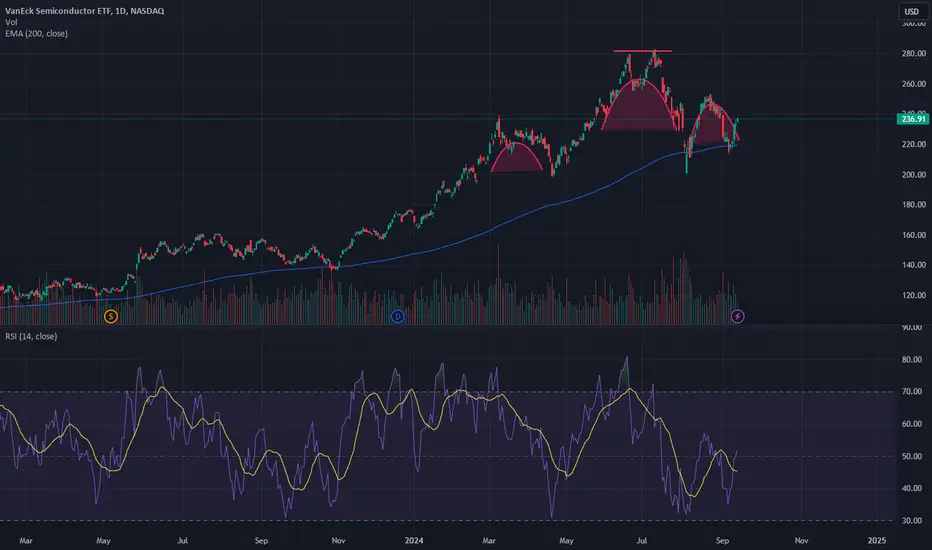
SMH - Flerting with 200MA and H&S The chart has formed a Head & Shoulders pattern following a double top, which needs to be invalidated to avoid further downside pressure. That’s what the bulls are attempting to achieve, but the question remains: will they succeed?
Additionally, we are frequently testing the 200MA, a key long-term support level.
From a macroeconomic perspective, a recession seems likely, and in such a scenario, maintaining bullish momentum would be difficult.
In my view, we’ve now entered the bearish phase of the market, even for semiconductors.
SMH support held by 200 MAWe got the September pullback with a double bottom off the 200 MA. This looks pretty bullish with the rest of semis looking bullish also
SMH tests major resistance levelSMH has rallied nicely the past 2 days and now reached major downward resistance level again. This is a crucial area for SMH to break in order for more rallying to continue
Resistance defined well during late August
ETF now presses up against resistance again
Volume declines as resistance is reached.
Overall I am expecting a reversal to start forming around here. Figure on SMH testing the level before retracting back down to lower levels again.

SMH forming a long downward trendSMH failed to make new highs after the last rally and now forming downward trend
At the peak of July 10 we have seen a continued decline in SMH overall
Latest rally peaked in August 21 coming in much lower than July 10
As SMH gradually sold off it also helped form a strong resistance line painting a long term grim picture
We are in late cycle investing at the moment. This is helping solidify that the longer term risk assets have begun
SMH is looking like the leader in the tech sell off so far. Recommend preparing your portfolio by rotating out of risk assets over to more defense ETFs

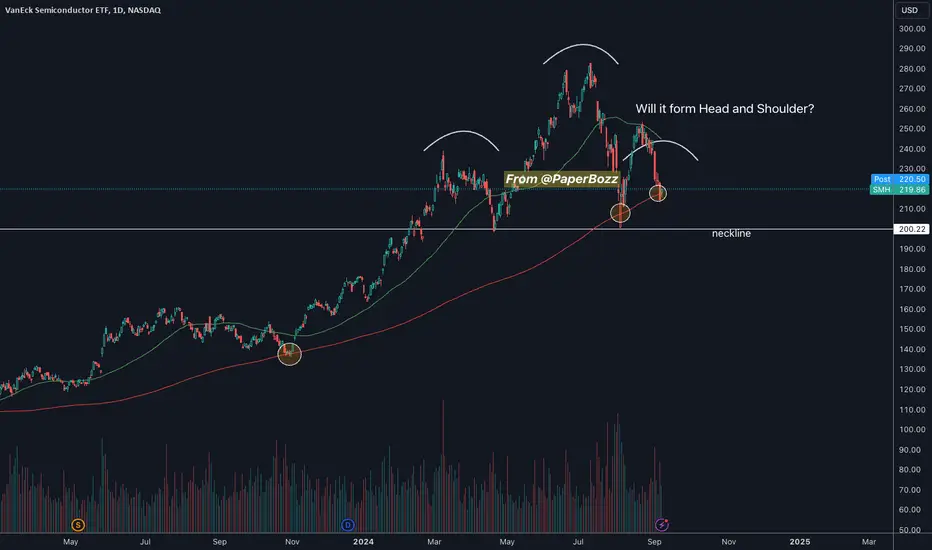
$SMH - Can 200DMA save it?NASDAQ:SMH On August 12, I posted that SMH could be forming a head and shoulders pattern. Fast forward to today, it is close to forming the right shoulder.
However, can the 200DMA, which has previously provided support, save it from breaking down? It remains to be seen.
Like any pattern, a Head and Shoulders can be invalidated if it fails to break down below the neckline.
As always, I share my opinions and trades. I'm not suggesting anyone follow my trades. You do you.