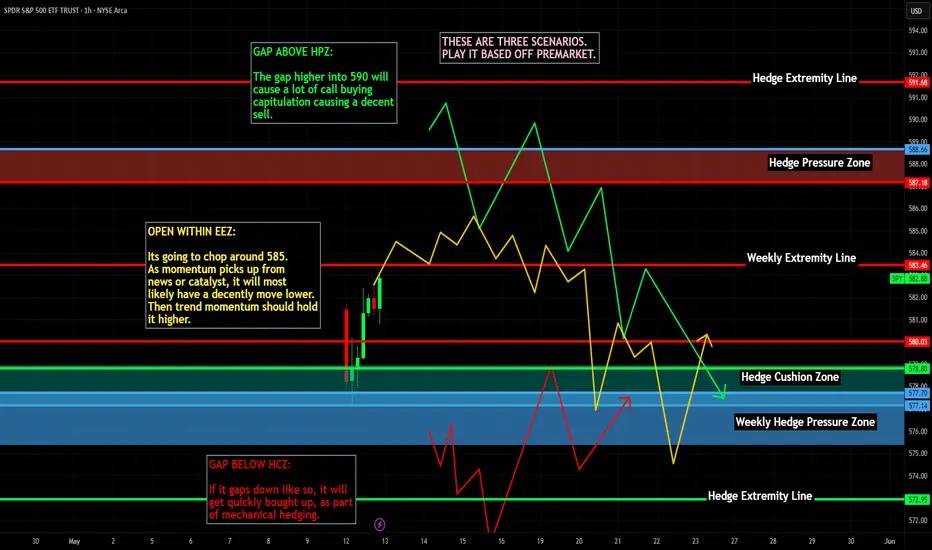
SPY/QQQ Plan Your Trade For 5-15 : CRUSH PatternToday's CRUSH pattern could play out as a very big downward price move if the 578-580 level is broken. CRUSH patterns are usually very large-range price bars. Yes, they can be to the upside as well (depending on recent trending).
A CRUSH pattern is usually in the opposite direction of recent trends. Thus, I believe today's CRUSH pattern will be to the downside.
Although I believe today could be very exciting for traders, I urge all traders move with caution in the early 30min to 60min of trading today. I believe the SPY/QQQ will attempt to establish a range (early trading range), then work to break away from that range.
Traders should be very cautious of getting married into a direction/position in early trading. Let the market tell you where it wants to go.
Gold and Silver appear to have setup the Ultimate Low overnight. Now, we'll see if metals can move higher throughout the rest of this week and build a base for the next phase higher.
BTCUSD seems to have started to roll over (top), but I urge traders to stay cautious of the current upward FLAGGING trend. Until BTCUSD breaks below $96-97k, I would still consider it to be trending upward.
Going to be a busy day for me. Stay safe as I'll be on the road most of the morning.
GET SOME.
#trading #research #investing #tradingalgos #tradingsignals #cycles #fibonacci #elliotwave #modelingsystems #stocks #bitcoin #btcusd #cryptos #spy #gold #nq #investing #trading #spytrading #spymarket #tradingmarket #stockmarket #silver
SPY trade ideas

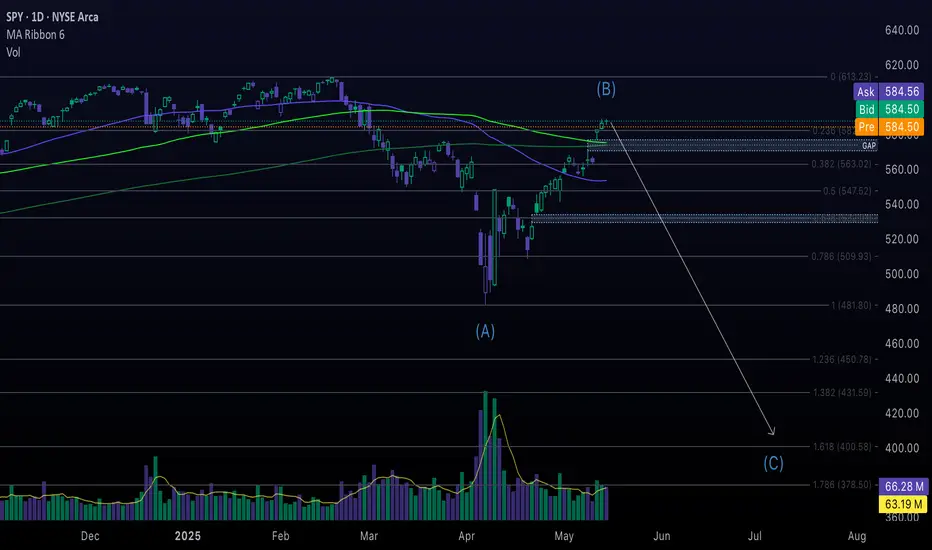
Staring Down A Market Crash - $400 Target for SPY"B" waves are phonies. They are sucker plays, bull traps, speculators' paradise, orgies of odd-lotter mentality or expressions of dumb institutional complacency (or both). They often involve a focus on a narrow list of stocks, are often "unconfirmed" by other averages, are rarely technically strong, and are virtually always doomed to complete retracement by wave C. If the analyst can easily say to himself, "There is something wrong with this market," chances are it's a "B" wave.”
— The Elliott Wave Principle
In my last major idea for SPY, I predicted a bear market rally would take the price to $580 by early May. Now that we have arrived at the target, I am writing again to call for a major market reversal — a crash that will take SPY down to $400–$450 in the coming weeks. There are several factors that I am basing my assumptions on, and I will break them down briefly.
Before I do that, I would like to add to the quote above that I find B waves to be one of the most fascinating market phases. In larger degrees it is interesting to observe how sentiment changes over time and how price action can trick even seasoned traders into thinking the bear market has been vanquished, when in reality the worst lies ahead. In this instance, the collective euphoria is understandable; the trade war seems to be in retreat and inflation has remained tame. What is left to worry about? Who knows — but what I can say is that there are signs that there is still fear in the market and indices are currently at a level where they will be highly sensitive to any bad news.
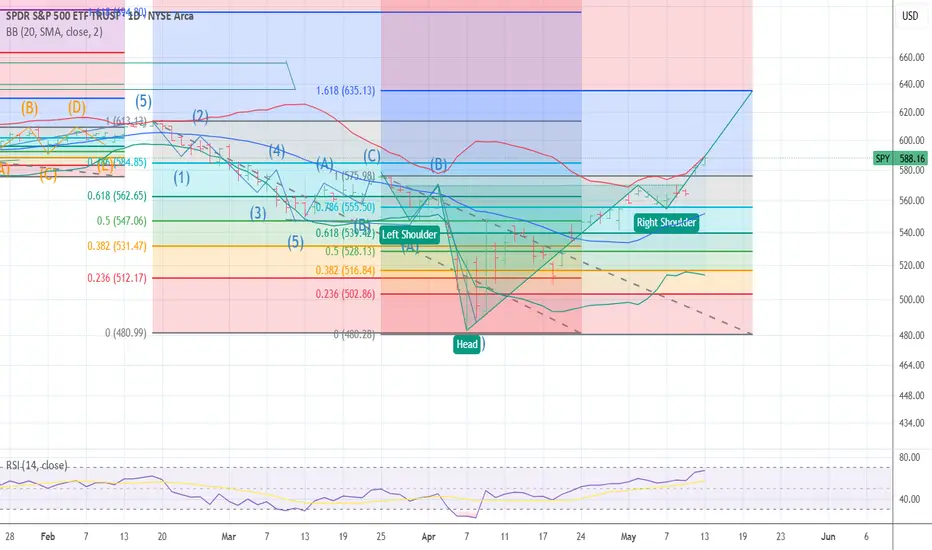
Here is how I’m counting Wave (B) on the 200R ($2) chart. The price retraced to nearly 0.618 of A (0.382 level on the fib extension) and entered Wave C. I will admit that the PA in Wave C was confusing at first. As I mentioned in my previous idea, I expected the price in Wave (B) to rise to around 75% of Wave (A) and would spike above the daily 50/100/200 MAs. However, the uptrend was choppy and slow — held back by low volume and multiple traps for both sides. Fortunately, the further a trend moves along, the more clear it becomes. I am now counting Wave C of (B) as an ending diagonal, which is common in C waves.
In the diagonal, the price rose in five distinct waves once it entered the channel, with Wave (v) throwing over the top and being met with heavy resistance, which happens to be at the 1.618 extension of Wave A. While this is nearly a perfect diagonal per the rules, one issue I will point out is that Wave (iv) stopped just short of Wave (i) territory. Typically in a diagonal it should retrace into Wave (i); however, I’ll consider this to be close enough.
If the price were to move higher, the next target would be the 2.00 extension of A ($612.70). This would be near the previous ATH, which would signal a flat correction. While this is not impossible, I am going to stick with my initial instinct that the price will reverse around this level when other market indicators are taken into consideration. More on that later.
On the weekly chart, there is volume divergence and a major gap that was started this week at $570. Additionally, if Wave (B) were to end this week, it may end up with less volume than Wave (A). Since Wave (A) lasted for 8 weeks (a Fibonacci number), my box for Wave (C) is the next highest in the sequence — 13. This is just a guess, but if we were to see a similar pattern play out, AMEX:SPY should bottom out in late July or early August. The Weekly 200MA should be an important area of support, so be sure to keep an eye on that.
Also, do not forget to check the Monthly chart. Here we can see that April has a very long downside wick. I would expect to see this get filled in.
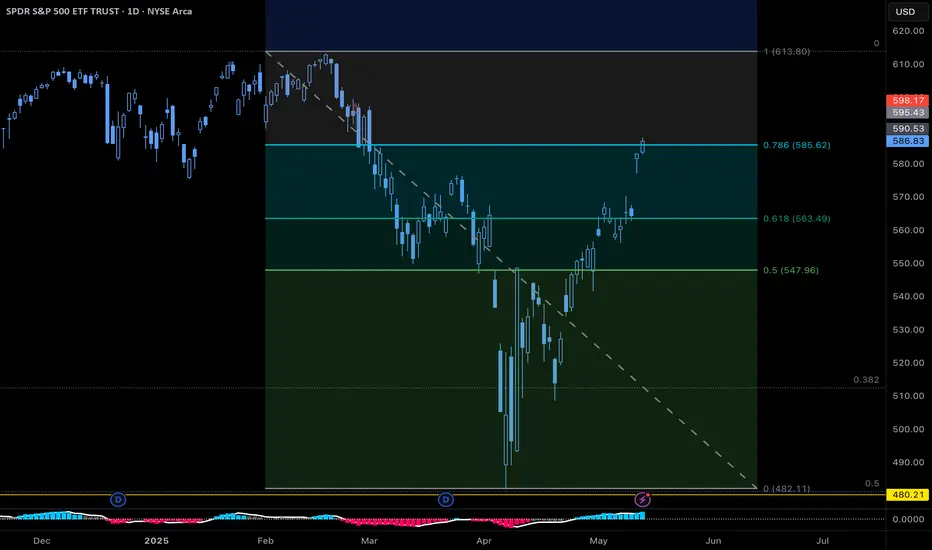
Lastly, on the daily chart, here is a recap of where we are in relation to my previous idea calling for $580 on SPY. As I predicted, the price popped above the 100MA and is finding resistance. The 100MA is ready to cross the 200MA, which can be thought of as a second death cross, if you will. I also have boxes here to show the unfilled gaps to the downside. With the trend being this exhausted, I would expect to see both get filled in soon.
Bearing all of this in mind, some people may argue that the technicals do not matter in this environment. After all, some of the headwinds that caused the first crash have dissipated and recession fears seem to be waning. While I won’t argue against any of that, there are other signs that the market is not out of the woods yet. Looking beyond SPY, TVC:US10Y has been on the rise and is on track to make a higher high. I’m targeting 5% over the coming weeks. I have another idea that looks more closely into this so I won’t elaborate any further in this post; however, this is one sign that institutions are risk-averse when it comes to the US economy.
The other component of this assessment is that the dollar appears to be heading lower. The chart above is inverted to more easily show what appears to be a classic impulse wave structure entering Wave 5, which could take TVC:DXY to the 1.618 extension of Wave 1 — around $96.68. If this were to play out, the dollar index would reach its lowest level since March 2022. This could spur a debt crisis where the Fed will have to make difficult decisions. If they start cutting rates to lower yields, it could also add further downside pressure to the dollar, which could make finding the right balance difficult. Keeping rates higher for longer and buying back Treasuries would be the preferred route, but Powell could face mounting political pressure to start making cuts if it seems the situation is getting out of hand, and could lead to more trouble down the road. This strain could be a possible fundamental backing for a stock market sell-off, so it is important to pay attention to.
Lastly, the final signs that indicate to me that a reversal is coming soon is that this uptrend is losing breadth. This is evident when looking at indices that are not weighted so heavily by mega cap tech stocks, such as TVC:DJI and $RUT. It was striking to see AMEX:DIA and AMEX:IWM down Tuesday and Wednesday while AMEX:SPY and NASDAQ:QQQ inched higher. On AMEX:DIA , the 100MA is starting to cross the 200MA and volume is picking up. Once tech starts selling off, we will see the other major indexes tumble.
I could keep going on and on, but you get the point. Here is TVC:VIX at a critical support level and starting to reverse higher. One last comment on B waves is that it is dangerous to follow the herd during times like these. Trust the technicals, and when something seems off — trust your instincts. We will never know what news is around the corner, but financial markets are so vast that we should assume that all factors known and unknown to the general public are being priced in real time.
As the next phase of the downtrend gets going, it will be easier to predict the bottom with greater accuracy. For now, I’m keeping the range wide and will look for $400–$450. As always, thank you for reading and let me know what you think.
Long Spy to 600The market is clearly in a bull run. I would expect a retest upwards of 590 with resistance at 600. Anything over 600 is a bonus, good luck traders.

Nightly $SPY / $SPX Scenarios for May 15, 2025 🔮 Nightly AMEX:SPY / SP:SPX Scenarios for May 15, 2025 🔮
🌍 Market-Moving News 🌍
📊 Producer Price Index (PPI) Release Today
The Bureau of Labor Statistics will release the April PPI data at 8:30 AM ET. This report will provide insights into wholesale inflation trends, following the recent Consumer Price Index data that showed inflation easing to a four-year low.
🛍️ Walmart ( NYSE:WMT ) Earnings Report
Walmart is set to release its earnings today, offering a glimpse into consumer spending patterns amid ongoing economic uncertainties. Investors will be watching closely for any indications of how inflation and trade policies are impacting retail performance.
👟 Foot Locker Acquired by JD Sports ( NASDAQ:JD )
JD Sports has officially acquired Foot Locker ( NYSE:FL ) for $1.6 billion ($24 per share). The deal aims to consolidate market share in the sportswear and athletic retail sector, with JD expanding its U.S. footprint. Foot Locker shares surged 67% premarket following the news.
💻 Nvidia ( NASDAQ:NVDA ) Faces AI Export Rule Implementation
The U.S. government's AI Diffusion Rule comes into effect today, potentially restricting Nvidia's chip sales to certain foreign markets. This regulatory change could influence Nvidia's stock performance and has broader implications for the tech sector.
📊 Key Data Releases 📊
📅 Thursday, May 15:
8:30 AM ET: Producer Price Index (PPI) for April
10:00 AM ET: Manufacturing and Trade Inventories and Sales for March
⚠️ Disclaimer:
This information is for educational and informational purposes only and should not be construed as financial advice. Always consult a licensed financial advisor before making investment decisions.
📌 #trading #stockmarket #economy #news #trendtao #charting #technicalanalysis

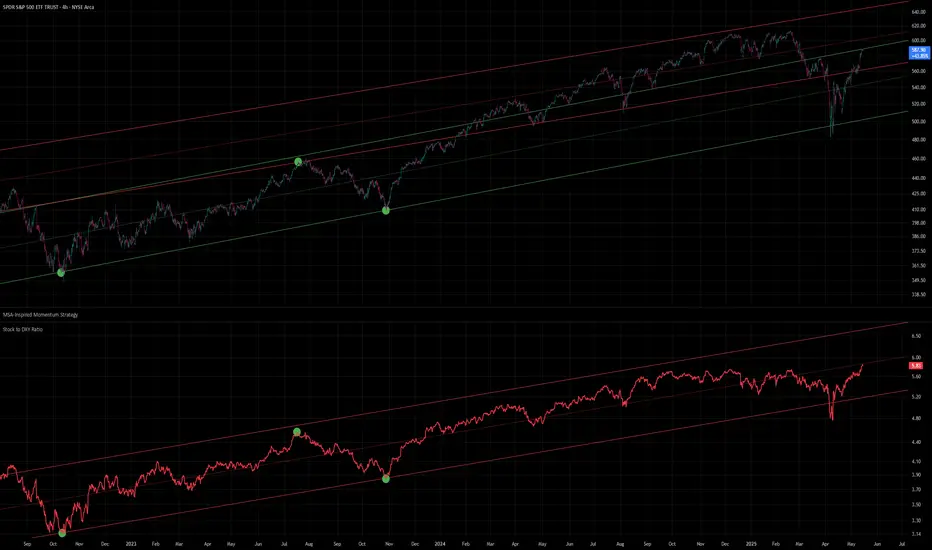
SPY using the DXY as a ratio for dollar fluctuationSimple plotting the SPY against the DXY and running parallel channels from significant pivots can help...
But then using a Log scale to help smooth out erratic price movements and allow more linear price analysis you get what is above.
Just a simple set of levels that are found by taking the same point on both graphs and then doubling the channel on the SPY graph so to better see the price, consider it a fractal of sorts in regard to the original channel.
Below is the original channels without Log scale...:
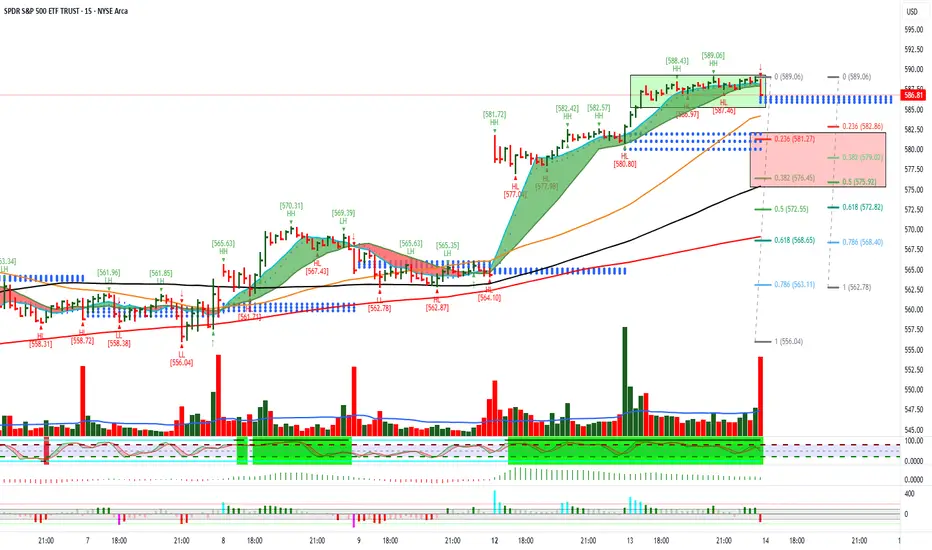
SPY Technical Outlook – Bullish Continuation Favored Above $584SPY remains in a strong uptrend, confirmed by a bull flag breakout on the daily chart, with price currently testing the $588–590 resistance zone. A rising channel on the hourly chart has guided price since early May, with repeated bounces off the lower trendline around $578–582. Recent volume expansion on breakouts reinforces bullish conviction.
On the 15-minute chart, a breakout and retest setup around $585–586 suggests a low-risk intraday long opportunity. The intraday VWAP and moving averages support this level, with momentum favoring a push toward $590. A failure to hold $584 could open downside to $582 or $578.
The near-term trading bias remains bullish above $584, with targets of $590–592. Short-term traders should look to buy defined pullbacks with tight risk, while watching for volume to confirm continuation. If $590 breaks with strength, swing targets extend to $595–600. Conversely, a breakdown of the hourly channel would favor quick shorts targeting support zones below.

SPY/QQQ Plan Your Trade For 5-14 : Carryover PatternToday's pattern suggests the SPY/QQQ may attempt to stay somewhat elevated. The Carryover pattern is essentially a pattern saying, "expect more of the same type of trending today".
I would suggest the SPY/QQQ are somewhat extended and may pause a bit today.
I shared a chart I created back on March 23, 2025 that I found very interesting - showing a big rally in late-April/early-May. If that chart continues to be accurate - it suggests the markets may attempt a reversion move to the downside over the next 20-30+ days.
Time will tell if my predictions play out accurately or not.
Gold is moving into new BEARISH trending on the GOLD Cycle Patterns. After an extended consolidation phase in metals, this shift in the trend models was going to happen at some point.
Now, we need to see if Gold/Silver can hold above recent support or not. Even though I believe Gold/Silver are poised for another big rally, the disruptions related to the global economy and tariffs seems to have taken some of wind out of the sails of the metals rally (for now).
Bitcoin continues to lead the SPY/QQQ. Keep an eye on what BTCUSD does over the next 7-15+ days as I believe it will lead the US markets in trending (still).
Get some.
#trading #research #investing #tradingalgos #tradingsignals #cycles #fibonacci #elliotwave #modelingsystems #stocks #bitcoin #btcusd #cryptos #spy #gold #nq #investing #trading #spytrading #spymarket #tradingmarket #stockmarket #silver

The end of a cyclethis is for long term, I think Trump will lead the last bull market in history. Then, maybe will be a bear market. Let's see!

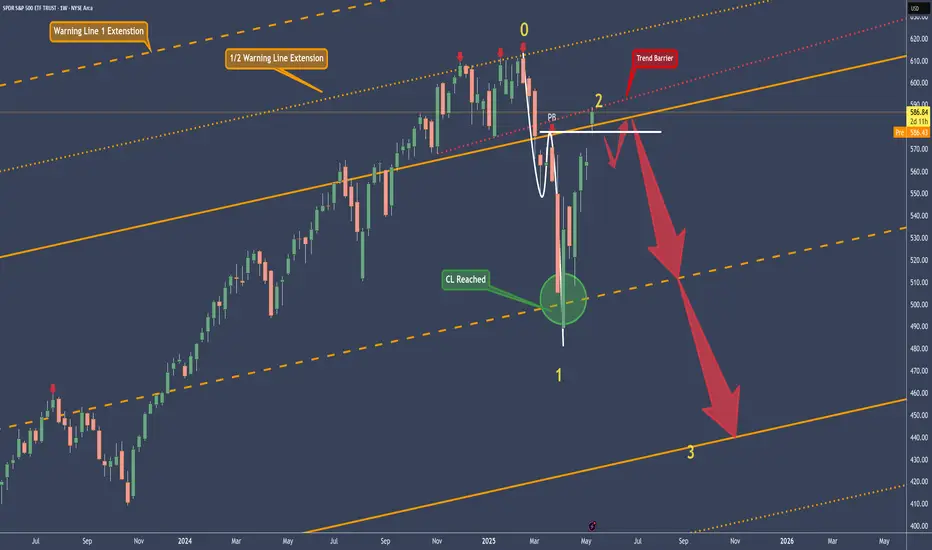
SPY Broke The Sine-Wave Center - Not GoodWe see the 3 tiny arrows—proof that price was rejected by those who knew.
The Trend Barrier, once solid support, cracked without resistance. Price dropped right back into the Medianline set.
The small pullback? Totally expected—just like the Medianline rules suggest. Then came the brutal drop, textbook-style, straight to the Centerline.
The springboard move back up to the U-MLH and the Trend Barrier? No surprise—if you understand the Medianline Framework. Because this is just P2.
Also—watch the white line. That’s what I call the Sine Wave. Why does it matter? Because the center point (where the red pullback arrow is) often gets breached in a fake move... right before price reverses hard. From P2: down, down, down... lower than P1.
AND THAT SHOULD SCARE THE HELL OUT OF YOU!
…if I’m right 😈
But if it fails?
Then we’re looking at a monstrous V-shape recovery—one that could send the indexes skyrocketing.
So there you have it.
What’s your direction?
Let me know—and tell me why! §8-)
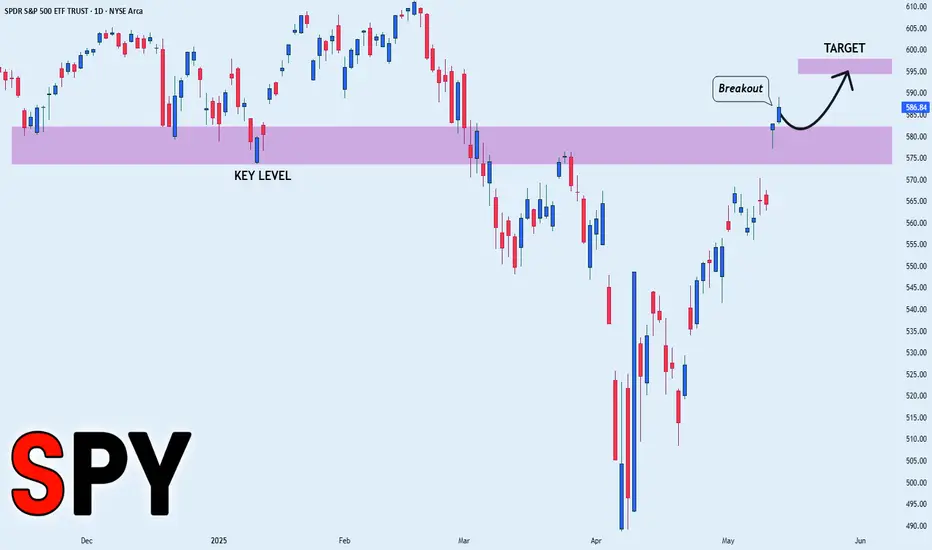
SPY BULLISH BREAKOUT|LONG|
✅SPY is trading in an
Uptrend and the index
Made a bullish breakout
Of the key horizontal level
Of 580.00$ and the breakout
Is confirmed so we will be
Expecting a further move up
LONG🚀
✅Like and subscribe to never miss a new idea!✅
Disclosure: I am part of Trade Nation's Influencer program and receive a monthly fee for using their TradingView charts in my analysis.
SPY, TIME TO BE BEAR AGAINSPY ready to start its 4hrs bearish TIME Cycle with first target 565 and around 545 by end of month (if not sooner)

$SPY May 14, 2025AMEX:SPY May 14, 2025
15 Minutes.
AMEX:SPY crossed 586 and made a high 589 levels.
Oscillator divergence.
Too far away from moving averages in 15 minutes.
So, a pull bac to 580 is on cards.
We have seen this setup many times.
Working in our favor.
I don't see any different this time too.
Dollar and S&P 500...a ratio of SPY by DXY, parallel to watchBasically modified a script I used to check a stock vs gold by ratio. Decided that was dumb since gold is the base of all money and stocks are no priced in gold. So I modified it to take the ratio of any stock by the current DXY of that time...both date and timeframe. To which this is created.
See how all points highlighted are equal on the graph and the coordinates are exact to the day, but differ in price position as the two are on different scales. You can see the parallel is quite interesting and has quite the usefulness...if only I could read charts- I do reality and not fiction.
But to those who read these like I read Chinese brail in a upside down backward bible (RIP Carlin) you can just take it that certain structures are looking to be broken or butted up against.
So take from this as much as you can and know that no matter how much AI you need to do a job- you need a mine to get the copper out to make the cables to connect the gpu lol..
Simply comment below your interpretation and where you think things are going or not...nothing is wrong except for common core- that stuff is so right, its basically left. :)

Nightly $SPY / $SPX Scenarios for May 14, 2025🔮 Nightly AMEX:SPY / SP:SPX Scenarios for May 14, 2025 🔮
🌍 Market-Moving News 🌍
🇺🇸 U.S.-China Tariff Reductions Implemented Today
The U.S. and China are set to enact significant tariff reductions today, lowering U.S. tariffs on Chinese goods from 145% to 30% and China's tariffs on U.S. goods from 125% to 10%. This 90-day agreement aims to ease trade tensions and has already spurred a market rally, with the S&P 500 gaining 3.3% on Monday.
📉 Inflation Hits Four-Year Low
U.S. inflation eased to 2.3% in April, marking a four-year low. This unexpected decline has alleviated concerns about the impact of recent tariffs and may influence the Federal Reserve's monetary policy decisions.
📈 S&P 500 Turns Positive for 2025
The S&P 500 has erased its year-to-date losses, turning positive for 2025. This shift is attributed to easing inflation and the recent U.S.-China trade agreement, which have bolstered investor confidence.
💼 Nasdaq to List New ETFs
The Nasdaq Stock Market will begin listing three new Russell Investments ETFs today, expanding investment options for market participants.
📊 Key Data Releases 📊
📅 Wednesday, May 14:
5:15 AM ET: Speech by Fed Governor Christopher Waller
10:00 AM ET: Business Formation Statistics for April
⚠️ Disclaimer:
This information is for educational and informational purposes only and should not be construed as financial advice. Always consult a licensed financial advisor before making investment decisions.
📌 #trading #stockmarket #economy #news #trendtao #charting #technicalanalysis

Drop to 571 in the cards for tomorrowMarkets are way too over extended. A correction sub 580 to wipe out over confident bulls can be expected tomorrow.

MAJOR TURN NEW UPSIDE IN ELLIOT WAVE 6350 target I have moved from a Bear to a BULL based on the the alt wave count at 4835 support I will pull 4835 as minor and major wave 4 of the 5th wave I can count it three ways and once we break above 5945/6010 I get min targets of the old high at 6147 at that point it will mark Ax 1.618 or wave 1 x .1618 both reach 6147 That should be seen as an issue But if we break above 6180 I will get a target of 6250 and a second target of 6351 see chart for projection . I have covered shorts from 5799 here at 5903 and moved to a net long at 100 % I will add to a 125 % long on a buy stop at 6010 . Best of trades WAVETIMER
SPY squeaked above the 78.6 Fib level If the daily candle holds, we could be challenging the all time high shortly thereafter. And if the weekly candle holds above...
SPY/QQQ Plan Your Trade For 5-13 : Rally 111 PatternToday's RALLY pattern suggests we will see continued upward price trending in the SPY/QQQ (and possibly BTCUSD).
I believe the continued positive news/announcements by the Trump administration is adding fuel for the current rally phase in the US markets. It is hard to ignore his tactics (like them or hate them). He is able to get things done in a way that many believe is disruptive.
Still, from what I'm hearing, the Chinese trade deal is a very broad and advantageous deal that somewhat "resets" the disparity the US has experienced for the past 20+ years with China. Overall, that is a very positive advancement in global trade.
Now, we'll have to see how the markets react to this news and is the hype is as good as the final trade deal.
Overall, the US markets are still climbing up the current FLAGGING formation (still BULLISH).
I see another Island (GAP) type of price move, which may prompt some consolidation - we'll see how things play out.
Gold and Silver are setting up double/triple bottoms across support.
BTCUSD is rallying higher within a similar FLAG formation to the SPY/QQQ.
In my mind, the markets are back to nearly where they were prior to the tariffs and early breakdown in late-February 2025. This is the "make or break" time for the markets.
Either the SPY continues higher and attempts to break above resistance - or it will start to fail over the next 5-10+ days and break downward.
Buckle up... and GET SOME.
#trading #research #investing #tradingalgos #tradingsignals #cycles #fibonacci #elliotwave #modelingsystems #stocks #bitcoin #btcusd #cryptos #spy #gold #nq #investing #trading #spytrading #spymarket #tradingmarket #stockmarket #silver

S&P500 room for growth?If you compare S&P500 trend from 2025 with previous years, you might either see two things:
Room for growth. In that scenario, later in the year we might see again see some upwards trend again. Instead of the current more or less flat line. Similar t o the year 2020.
Or you could compare this year with recession of some sort like the year 2022. Where we would end up in an overall loss of this year.
China could potentially escalate a war between India & Pakistan.
But I'm a bit more optimistic now. I hope they will rather now have a trade deal with the US instead of a war. Easing the tension of the trading wars. Putting this whole context together, we might actually see a small plus (like 8-10%) YoY for 2025. Or even a solid 15-20%?
What do you think?
See:
$SPY May 13, 2025AMEX:SPY May 13, 2025
15 Minutes.
Holding 574 levels uptrend continues towards 586 initially.
600 is a possibility by next week expiry.
If 575 is broken, then 570 should provide a strong support.

SPY/SPX: FOMC. Do we get rate cuts or do we even get a hike?!TA on SPY but I also like playing SPX.
Was seeing this as either a rising wedge, and if play (with FOMC etc.) can touch and retest
551.41 then back move back up to test 562.81 and to out at 567.85 IF market reacts well to FOMC, maybe ATH?
If not, we actually fulfill that rising wedge to 543.54 with a small gap to touch/retest at 534.54
I may sit sidelines until FOMC to catch the move and waves. Always wait for the set up to come to you! One of the rules I try to keep following but I break.
Let me know what you think. Will continue to update as it the week progresses.
Again, do your own DD. Not financial advice.

Nightly $SPY / $SPX Scenarios for May 13, 2025🔮 Nightly AMEX:SPY / SP:SPX Scenarios for May 13, 2025 🔮
🌍 Market-Moving News 🌍
🇺🇸 CPI Data Release Anticipated
The Bureau of Labor Statistics is set to release the April Consumer Price Index (CPI) data today at 8:30 AM ET. Economists forecast a 0.3% month-over-month increase, following a 0.1% decline in March. Year-over-year, CPI is expected to remain at 2.4%, with core CPI holding steady at 2.8% .
🤝 U.S.-China Trade Truce Boosts Markets
Markets rallied on Monday after the U.S. and China agreed to reduce tariffs for 90 days, easing trade tensions. The Dow Jones Industrial Average surged 1,160 points (2.8%), the S&P 500 rose 3.3%, and the Nasdaq gained 4.4%. Major tech stocks like Amazon ( NASDAQ:AMZN ), Apple ( NASDAQ:AAPL ), Nvidia ( NASDAQ:NVDA ), and Tesla ( NASDAQ:TSLA ) saw significant gains .
📈 Coinbase to Join S&P 500
Coinbase Global Inc. ( NASDAQ:COIN ) will be added to the S&P 500 index on May 19, replacing Discover Financial Services. The announcement led to an 11% surge in Coinbase shares during after-hours trading .
💎 Sotheby's to Auction $20M Blue Diamond
Sotheby's Geneva is set to auction the "Mediterranean Blue Diamond," a rare 10-carat gem valued at $20 million, today. The auction has garnered significant global interest from collectors and investors .
📊 Key Data Releases 📊
📅 Tuesday, May 13:
8:30 AM ET: Consumer Price Index (CPI) for April
8:30 AM ET: Core CPI for April
4:30 PM ET: API Weekly Crude Oil Stock Report
⚠️ Disclaimer:
This information is for educational and informational purposes only and should not be construed as financial advice. Always consult a licensed financial advisor before making investment decisions.
📌 #trading #stockmarket #economy #news #trendtao #charting #technicalanalysis
Into the closeJust a quick overview. The market is showing strength into the close, but it's possible we see a turnaround Tuesday tomorrow.
