SPY Hits Critical Gamma Level at 533 – Breakdown or Bounce? Market Awaits Trigger 🎯
🔮 GEX (Gamma Exposure) – Options Sentiment Analysis
🔥 Gamma Hotspot at 533 – Dealers in Trouble Below
* SPY is sitting right on the highest negative NET GEX zone at 533.57, indicating heavy dealer long gamma exposure.
* If price holds above, dealers may stabilize the market — but if 533 breaks, the path toward 530 and possibly 519.92 opens quickly due to forced hedging.
📉 Call Walls Block the Path Above
* CALL resistance stacks from 536–538–540, with a gamma ceiling forming around 538, where net positive GEX peaks.
* Above that, 544–545 is a tough zone to reclaim short term unless a macro tailwind hits.
📊 Options Sentiment Snapshot:
* IVR: 44.2 → Volatility expectations are moderate but stable.
* IVx avg: 29.7, dropping –16.08%, suggesting traders are defensively positioned with volatility being sold.
* PUTs 96.8% → This is extreme — a highly bearish options environment, making SPY susceptible to gamma-induced plunges if price cracks lower.
🎯 GEX Flow Outlook:
* Below 533: Fast move to 530, then potential gamma landslide toward 519.92 and beyond.
* Above 536: Bulls need to reclaim VWAP and move toward 538+ to flip gamma positioning and trap short hedgers.
🕰️ 1-Hour Technical Analysis
Trend:
* SPY broke down from a rising wedge and lost EMA/VWAP support on accelerating volume.
* Price is hugging the lower channel support — breakdown is in play unless a fast reversal occurs.
MACD:
* Weakening with a bearish crossover — confirms downward momentum building.
RSI:
* Falling under 40 with no bullish divergence — sellers still in control.
Key Levels:
* Support: 533.5 → 530 → 519.92 → 485.26
* Resistance: 536 → 538 → 544.62
🧠 Final Thoughts:
SPY is teetering at a gamma tipping point. With over 96% of flow favoring PUTs, dealers are in a short gamma setup — and price under 533 risks triggering a cascade toward 530 or even 520 if broader indices follow.
However, if bulls can reclaim VWAP and 536+, a reversal squeeze could target 538 or higher.
Stay nimble — this is a GEX-powered market waiting for its next catalyst.
This analysis is for educational purposes only and does not constitute financial advice. Always confirm with price action and use proper risk management.
SPY trade ideas

Nightly $SPY / $SPX Scenarios for April 16, 2025🔮 🔮
🌍 Market-Moving News 🌍:
🗣️ Federal Reserve Speeches: Federal Reserve Chair Jerome Powell is scheduled to speak at 1:30 PM ET, providing insights into the economic outlook and potential monetary policy adjustments. Additionally, Cleveland Fed President Loretta Mester will speak at 12:00 PM ET, and Kansas City Fed President Jeffrey Schmid and Dallas Fed President Lorie Logan will speak at 7:00 PM ET.
📊 Key Data Releases 📊
📅 Wednesday, April 16:
🛍️ Retail Sales (8:30 AM ET):
Forecast: +1.2%
Previous: +0.2%
Measures the total receipts of retail stores, reflecting consumer spending trends.
🏭 Industrial Production (9:15 AM ET):
Forecast: -0.1%
Previous: +0.7%
Indicates the output of the nation's factories, mines, and utilities.
🏠 Homebuilder Confidence Index (10:00 AM ET):
Forecast: 37
Previous: 39
Assesses the confidence of homebuilders in the market for newly built single-family homes.
⚠️ Disclaimer: This information is for educational and informational purposes only and should not be construed as financial advice. Always consult a licensed financial advisor before making investment decisions.
📌 #trading #stockmarket #economy #news #trendtao #charting #technicalanalysis

SPY pothole ahead! Drive with cautionHello drivers, I mean traders, LVN pothole ahead, drive(trade) accordingly. 5% drop expected based on VP
For those not familiar with LVN ( Low Volume Nodes) in Volume Profile, is price region where prices tend to move rapidly for lack of resistance or support
Interestingly if you look at the chart carefully, since June 2024 the prices have moved/gaped
7 times in this region, including the last weeks 10% move travelled this region.
Funny, as if prices are jumping the pothole each time it comes across


SPY: 485 remains the line between correction and collapseS&P 500's bearish trend that began in February 2025 has ended following a strong 14% rebound from a key level that previously triggered the last sharp down move. This does not mean the market is immune to further downside, but if one still maintains a bearish view, it is important to note that breaking below 485 would likely mark the beginning of a major bear market and the end of the long-term uptrend that started in 2009. Of course, no one wishes for that outcome.
Parallel channel for spySpy seems to be in a channel on hourly chart, any dip to 520-525 will probably be bought and short term resistance is around the 550-560 area.
Not a trading advice, just an observation

SPY/QQQ Plan Your Trade For 4-15 : Base Rally PatternToday's pattern suggests the SPY/QQQ have been busy forming a BASE and may transition into a moderate rally mode.
I believe this move will prompt the SPY to move above the $550 level, potentially targeting $555-565 over the next 48 hours.
This upward move could be related to news or Q1:2025 earnings.
I don't believe the markets really want to move downward at this time, although I do believe the markets will move into a topping pattern by the end of this week.
Gold and Silver are moving into BLANK pattern day, today. Given the fact that we are between rally patterns and the metals charts show a very clear FLAGGING formation (watch my video), I believe we are moving into a FLAG APEX that will prompt a move above $3300 (for Gold) and $33 (for Silver). It's just a matter of time.
BTCUSD is still struggling in the Consolidation phase. As I keep suggesting, I believe the next move for Bitcoin is to the downside. But, until we break this consolidation phase, price will continue to roll around within the consolidation range.
Remember, we are going to be moving back to more normal volatility. So you need to understand these huge daily ranges are going to vanish over the next 3-5+ days.
Volatility will likely move back to the 1% to 2.5% range very quickly.
Get some..
#trading #research #investing #tradingalgos #tradingsignals #cycles #fibonacci #elliotwave #modelingsystems #stocks #bitcoin #btcusd #cryptos #spy #gold #nq #investing #trading #spytrading #spymarket #tradingmarket #stockmarket #silver

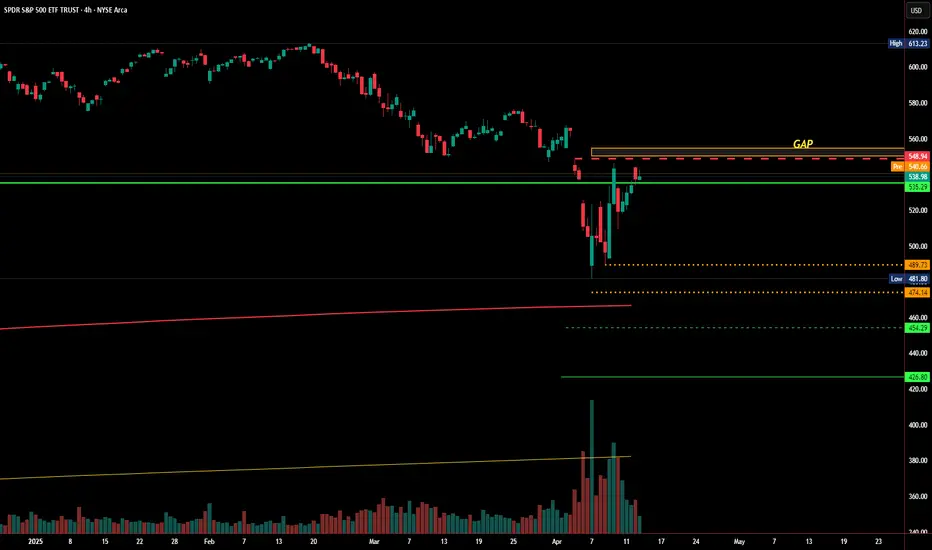
SPY Approaching Major Resistance Zone SPY has rallied sharply from its recent low, but it's now pressing into a critical resistance zone. Price is currently sitting just below a major unfilled gap between $539.54 and $548.94. Until this gap is filled and the market closes decisively above it, the broader downtrend remains intact and risk of a reversal is elevated.
Current Price Action:
SPY has reclaimed $535.29, a short-term support that must hold if bulls are to maintain momentum.
Price is hesitating under the gap, a common reaction area where sellers often defend.
Moving averages are turning upward, indicating short-term strength, but we’re still below key longer-term resistance zones and the 200 EMA (not shown).
Downside Risk Levels If Rejected:
$489.73 – minor horizontal support
$481.80 – a prior low and key reference point for buyers
$474.14 – structural support area from prior consolidation
Extended targets: $454.29 and $426.80 if broader weakness resumes
Analysis : This area between $539–$549 is the battleground. If SPY can fill the gap and close above $549 with follow-through, that would be the first meaningful technical confirmation of a potential trend reversal.
However, failure to clear this level could open the door for a larger pullback. Watch price action and volume closely — a rejection here would indicate that sellers are still in control, at least in the medium term.
As always, be patient and let the chart confirm the direction. For now, SPY is at a decision point — one that will likely dictate the next leg in this market.
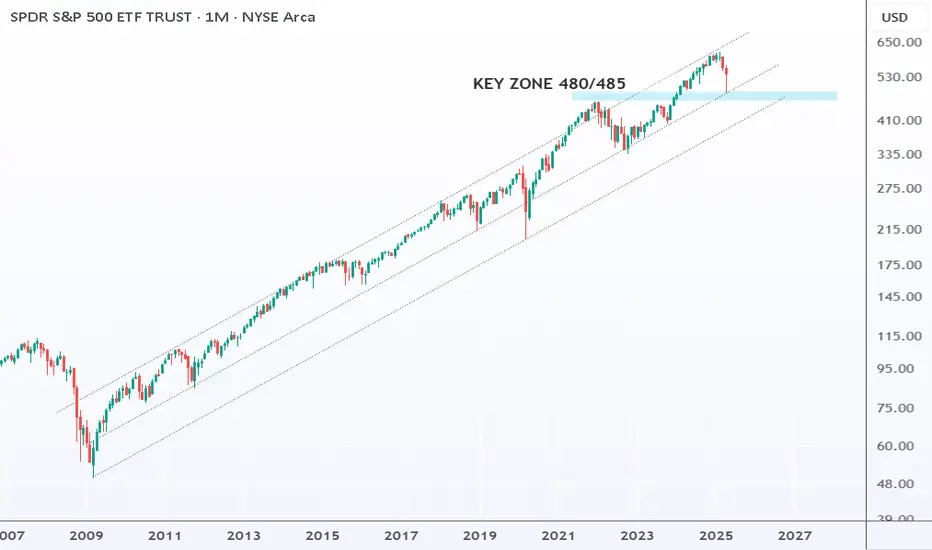
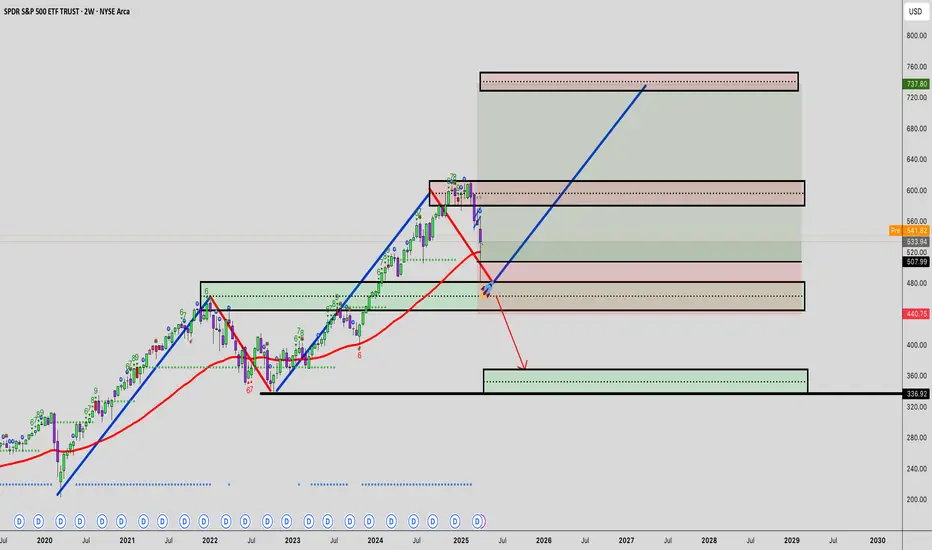
SPY Wave structureIf SPY sustains above 480 on monthly close, we can consider it as end of wave 4 and the beginning of wave 5. 640 will act as a resistance and once 640 is broken, SPY target would be 695-740 zone where SPY will complete its wave structure. The move from 640 to 700 is most likely retail fomo. Good zone for booking short term profits and for the stocks bought at end of wave 4

$SPY - Recap of April 14 2025
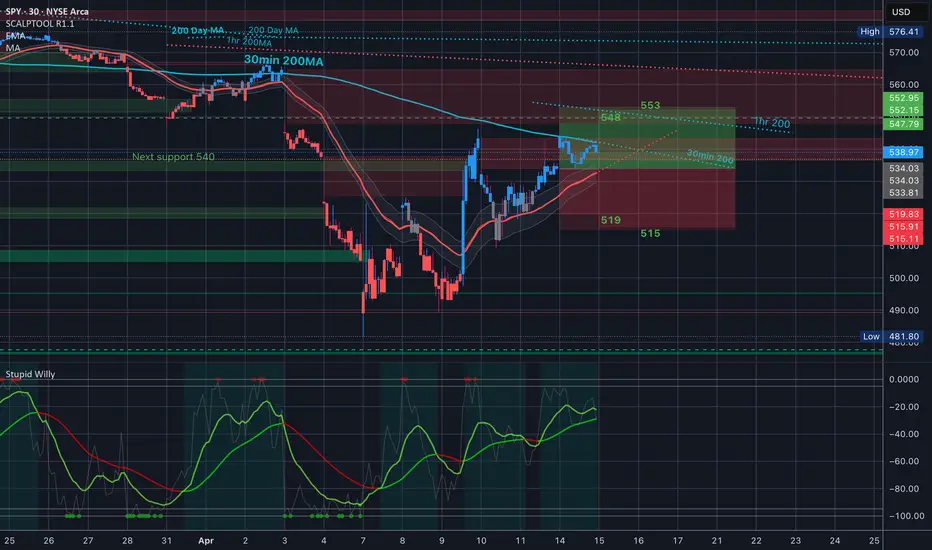
Today, Monday April 14th we opened with a gap UP to the 30min 200MA and we also gapped right to the top of the bear gap (always considered resistance and strengthened by the downward momentum of the 30min 200.
We did see resistance with those combined bearish levels and we brought is back down to the middle, closed the gap from open and took it back to the 30min 200MA and got pushed back at close.
This chart setup was bearish today - even though we closed green - how? The 30in 200MA pointing down. The bear gap under that. And the 35EMA trading Under the 30min 200MA.
It was an easy trading day and just looking at the momentum you could feel that price was going to stay in the center of the implied move. At least I mentioned that in last night’s video.
Excellent day. How did you guys do??
Spy will 509ish hold if not watch out belowspy support. 509ish played out well for good profit will it hold this time

Nightly $SPY / $SPX Scenarios for April 15, 2025🔮 🔮
🌍 Market-Moving News 🌍:
🏦 Major Bank Earnings: Bank of America (BAC) and Citigroup (C) are set to report Q1 earnings before the market opens. BAC is expected to post an EPS of $0.81, while Citigroup anticipates $1.84. Investors will closely watch these reports for insights into the financial sector's health amid ongoing market volatility.
💊 Healthcare and Consumer Goods Reports: Johnson & Johnson (JNJ) is also scheduled to release its earnings, with forecasts indicating an EPS of $2.57. These results will provide a glimpse into the performance of the healthcare and consumer goods sectors.
📊 Key Data Releases 📊
📅 Tuesday, April 15:
📈 Import Price Index (8:30 AM ET):
Forecast: +0.1%
Previous: +0.4%
Measures the change in the price of imported goods, indicating inflationary pressures.
🏭 Empire State Manufacturing Survey (8:30 AM ET):
Forecast: -10.0
Previous: -20.0
Assesses manufacturing activity in New York State, providing early insights into industrial performance.
🗣️ Fed Governor Lisa Cook Speaks (7:10 PM ET):
Remarks may offer perspectives on economic developments and policy considerations.
⚠️ Disclaimer: This information is for educational and informational purposes only and should not be construed as financial advice. Always consult a licensed financial advisor before making investment decisions.
📌 #trading #stockmarket #economy #news #trendtao #charting #technicalanalysis

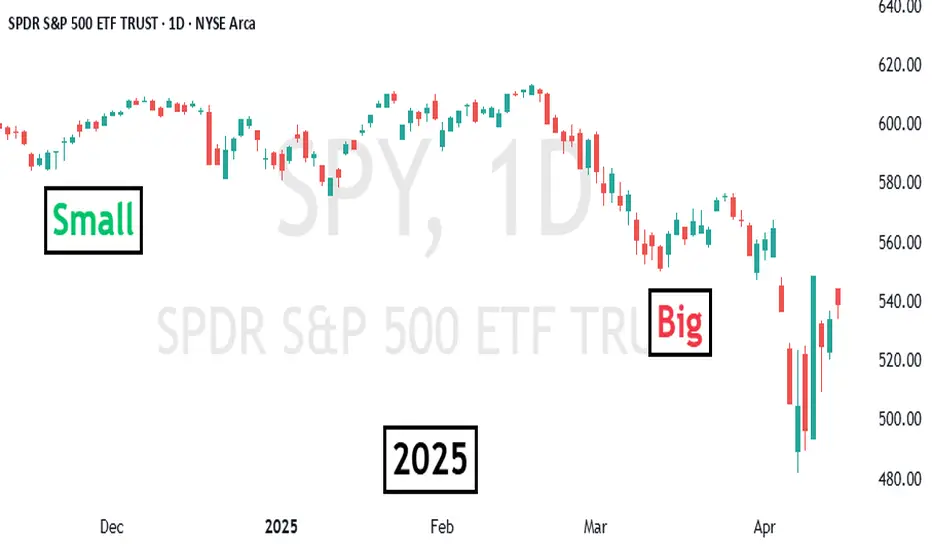
Bulls agree, Bears argueIf you look historically at price volatility, what you see is that bear markets make big candles, while bull markets churn out a lot of small ones. Even though a rebound seems imminent, don't overlook the fact that the candles, relatively speaking, are still big.
SPY Short From Resistance! Sell!
Hello,Traders!
SPY went up again
To retest a wide horizontal
Resistance level of 551.00$
And as the political situation
Remains unstable we are
Bearish biased and we will
Be expecting a local move down
Sell!
Comment and subscribe to help us grow!
Check out other forecasts below too!
Disclosure: I am part of Trade Nation's Influencer program and receive a monthly fee for using their TradingView charts in my analysis.

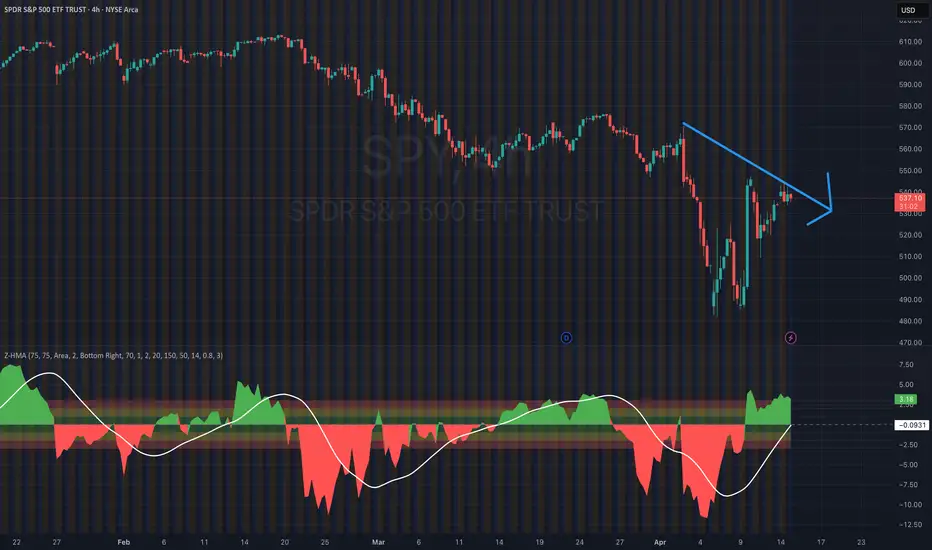
S&P 500 Technical Analysis: Z-Score HMA Indicator OutlookOutside of the obvious news on Tarriffs, let's just focus on technicals for a moment:
In case you’re in a hurry:
My HMA Z-Score Probability Indicator is currently signaling overbought conditions.
The Z-Score has moved into the upper green zone, a level where reversals have historically occurred.
Hull Moving Average (HMA) remains upward for now, but is approaching a potential flattening point.
Price continues to respect a descending trendline, indicating resistance remains intact.
Unless the trendline is broken with conviction, the probability favors a bearish reversion in SPY.
HMA Z-Score Indicator Forecast: SPY Nearing Reversion Risk
This week, my HMA Z-Score Probability Indicator is signaling a statistically significant overbought condition in SPY. In case you are unfamiliar, this tool blends the statistical power of the Z-Score with the responsiveness of the Hull Moving Average to give us high-probability momentum and mean reversion setups.
Let’s break down what it’s showing right now and why a pullback may be imminent.
Z-Score in the Green: What That Means
The Z-Score component of my indicator is now in the upper green zone, which I’ve defined as statistically overbought territory. This isn’t arbitrary, it's based on historical distribution thresholds that flag when price has moved too far, too fast from its average.
In past instances when the Z-Score has reached these levels, the market has often reverted back toward the mean. It's not guaranteed, of course but the odds shift. This is one of the key features of my indicator: identifying these moments where the risk/reward tilts away from chasing price and toward anticipating a reversion.
HMA as a Momentum Filter
The Hull Moving Average (HMA) provides the trend context in this setup. Right now, the HMA is still pointing upward, but it’s starting to show early signs of rounding off. If it begins to flatten or turn downward while the Z-Score remains elevated, that would act as a confirmation of a momentum shift and strengthen the case for a pullback.
The HMA has consistently helped filter out false Z-Score signals when the trend is strong. But when both tools start aligning, that's when I pay closer attention.
Descending Trendline Holding as Resistance
On the chart, I’ve drawn a descending trendline connecting recent swing highs. So far, price has failed to break through this line, continuing a pattern of lower highs.
As long as price respects that line, it suggests sellers are still in control of the short-term structure. If SPY gets rejected again here, particularly while the Z-Score is elevated, the probability of a downside move increases significantly.
Bearish Bias: What the Data Suggests
The core logic behind this setup is based on reversion to the mean. When price extends beyond typical volatility bands (as measured by the Z-Score) and momentum stalls (as reflected by the HMA), it often precedes a return to more normalized levels.
Right now, we have:
A Z-Score reading in overbought territory,
A potentially topping HMA,
Resistance still holding at the descending trendline.
That’s a confluence of signals that, in my indicator's design, suggests a bearish reversion is more likely than a continuation.
What I’m Watching This Week
To confirm the setup, I’ll be watching for:
HMA flattening or beginning to roll over,
Break of recent short-term support to trigger downside momentum.
If these conditions start stacking up, the short bias becomes actionable. If instead we see a breakout above the trendline with conviction and volume, I’ll re-evaluate because no indicator is bigger than price.
The HMA Z-Score Probability Indicator is designed to anticipate high-probability turning points, and right now, it's signaling elevated risk for a short-term reversal in SPY.
As always, these are probabilities, not certainties.
I Am Selling Some Shares Into The Dead Cat BounceSelling into the rally guys not all keeping some we can higher
Not sure how far until u get that weekly turning up thru
30% selling into rally. Have a hedge on.

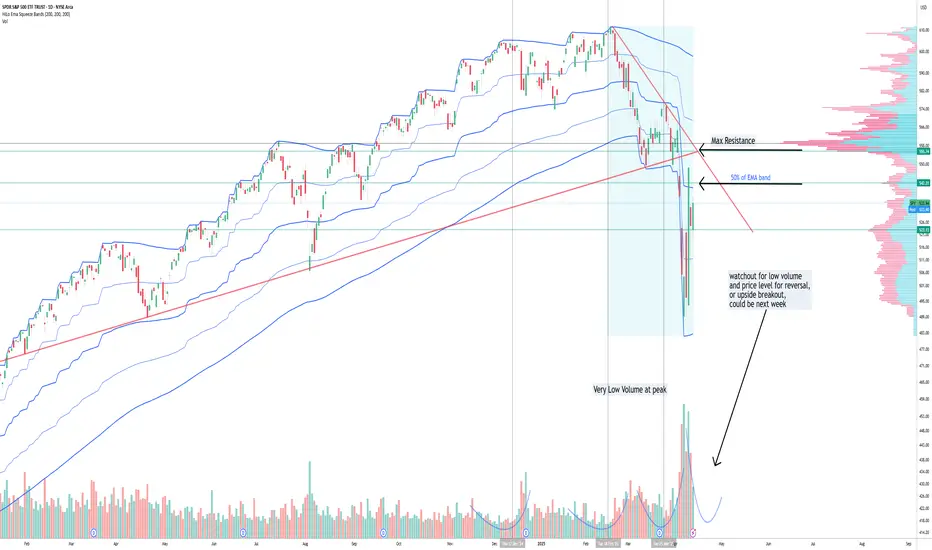
SPY Resistance coming upVolume and trend analysis showing key levels to watch. But in this market single chart analysis is not enough. I look at Dollar Index, Gold, 10Y Treasury Bonds. All indicate low confidence in USA economy. Unless these improve I will remain bearish even if SPX,SPY breaks to the upside.
But most likely the markets will reverse at max resistance, as the hedge funds who are under liquidity pressure will start selling again
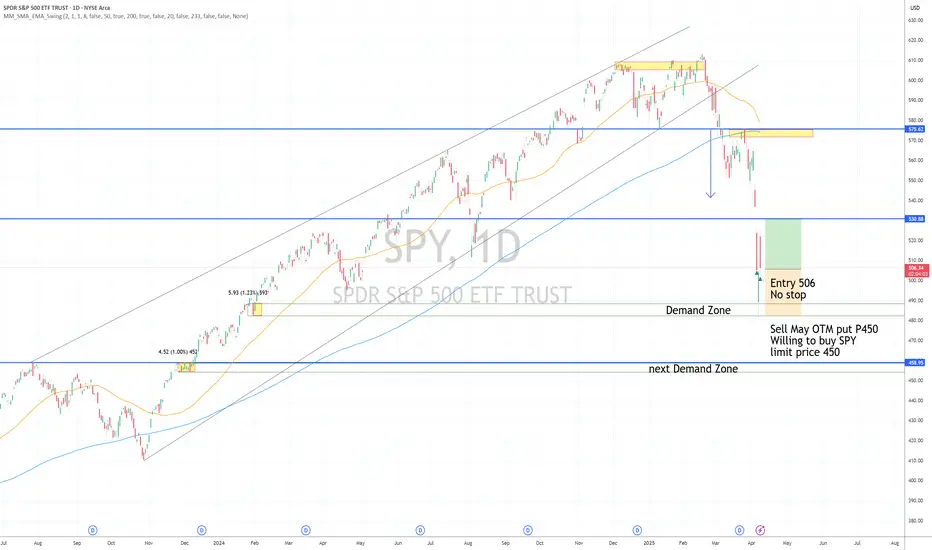
SPY Long and NeutralCurrent demand Zone confirmed, sell put below next demand zoon
Long entry 506
no Stop ,
Target 530
Risk management is much more important than a good entry point.
I am not a PRO trader.
In my trading plan, the Max Risk of each short term trade should be less than 1% of an account.
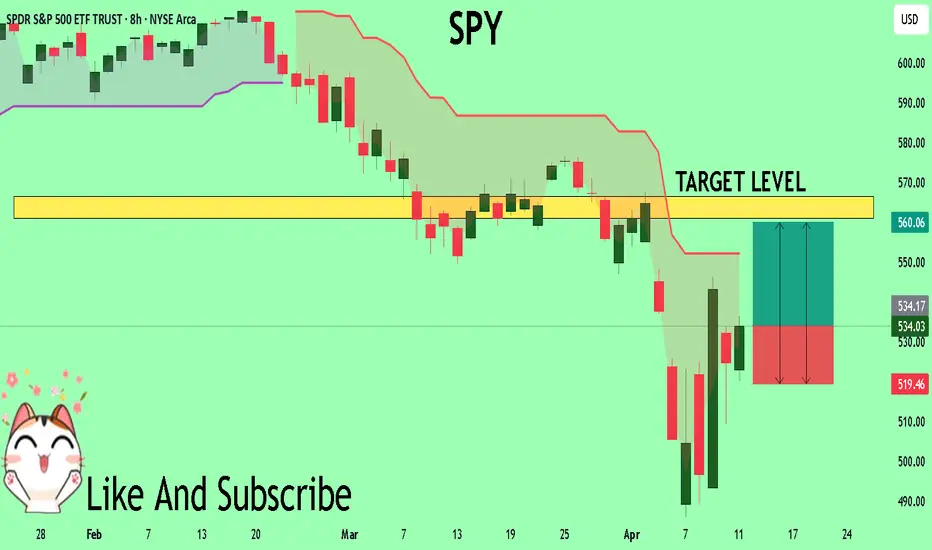
SPY Massive Long! BUY!
My dear subscribers,
SPY looks like it will make a good move, and here are the details:
The market is trading on 534.03 pivot level.
Bias - Bullish
My Stop Loss - 519.46
Technical Indicators: Both Super Trend & Pivot HL indicate a highly probable Bullish continuation.
Target - 560.94
About Used Indicators:
The average true range (ATR) plays an important role in 'Supertrend' as the indicator uses ATR to calculate its value. The ATR indicator signals the degree of price volatility.
Disclosure: I am part of Trade Nation's Influencer program and receive a monthly fee for using their TradingView charts in my analysis.
———————————
WISH YOU ALL LUCK
SPY/QQQ Plan Your Trade For 4-14 : Up-Down-Up PatternToday's pattern suggests the markets will move in a moderate upward price trend.
Although I don't expect anything huge today, I do believe the EPP structures/layers support this upward price move and that we'll see the SPY attempt to move back towards/above 550 over time.
The QQQ will likely follow the SPY higher over the next 5+ days.
Don't get too excited about this upward price move because it is structurally moving to setup a PEAK that will transition into a downtrend near April 22-25. This peak will create a downward price flag (a new inverted EPP) structure that will assist in developing a new sideways price structure carrying into June/July.
In other words, it looks like we are trapped between 480-585 on the SPY, and we will likely stay within that wide consolidation range for another 2-3 months.
Gold should attempt to rally this week, trying to break above $3300. I believe this is a critical level for Gold and also presents a breakaway level for Silver near $33.00
Bitcoin has moved into APEX VOLATILITY and will continue to trap BUYERS into believing BTCUSD is breaking away from the consolidation range. This is a BULL TRAP.
I believe BTCUSD will ROLL OVER within about 4-5 days - setting up a big breakdown move as the SPY/QQQ also roll downward in about 5+ days.
We still continue to see volatility and sideways price action. Still lots of opportunities for skilled traders.
Get Some..
#trading #research #investing #tradingalgos #tradingsignals #cycles #fibonacci #elliotwave #modelingsystems #stocks #bitcoin #btcusd #cryptos #spy #gold #nq #investing #trading #spytrading #spymarket #tradingmarket #stockmarket #silver

SPY LONG SET UP(BUY THE DIP)Entry 1 $500.00
Entry 2 $460.00
Stop loss $440.00
Take profit 1- $550.00
(Close 25%)
Take profit 2- $600.00
(Close 50%)
Take profit 3-$650.00
(Close 75%)
Take profit 4-$700.00
(Close 100%)
SPY Back Up To Fill GapWe have a nice little gap above us and there is a good chance we can fill it. Also, we have a bull-flag formation that is likely to play out. Not financial advice.
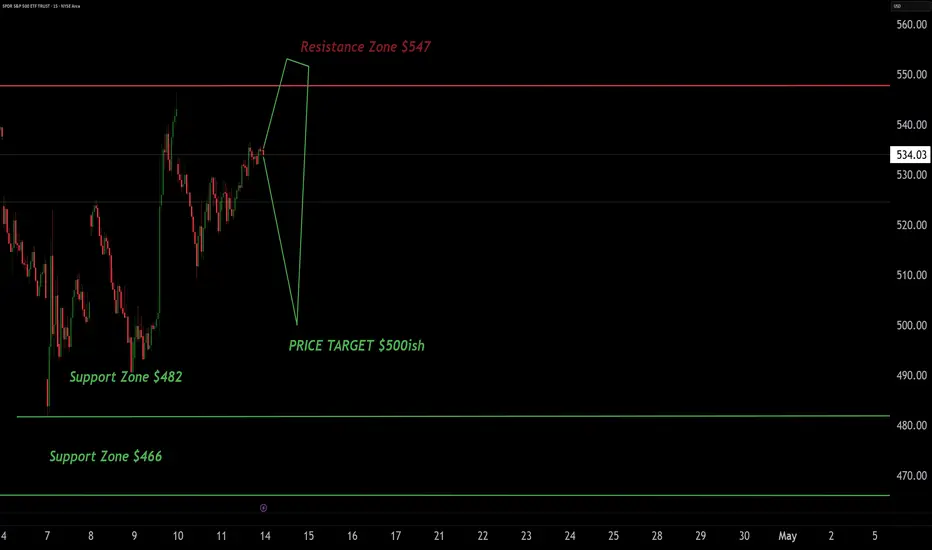
Spy Target $500I'm Basically Taking A Swing Trade All The Way Down To the $500 Target with a stop loss of about $545ish most likely being as stubborn as I am Probably Load up more at that price lol, if we even see that price to be honest but in all reality my absolute Stop out will be $547-$549. I Will be updating this post throughout the week... And if you need more advice Ill be here as always and check out some of my New Free Indicators on TradingView to help maximize your returns and as always Goodluck and safe trades