House of Cards - $585 before the crashHouse of Cards - $585 before the crash
I'm unable to update my previous idea that I originally posted in February when AMEX:SPY was at the top. Going to make this brief and will add screenshots and additional notes once the structure of Wave (B) is confirmed or invalidated.
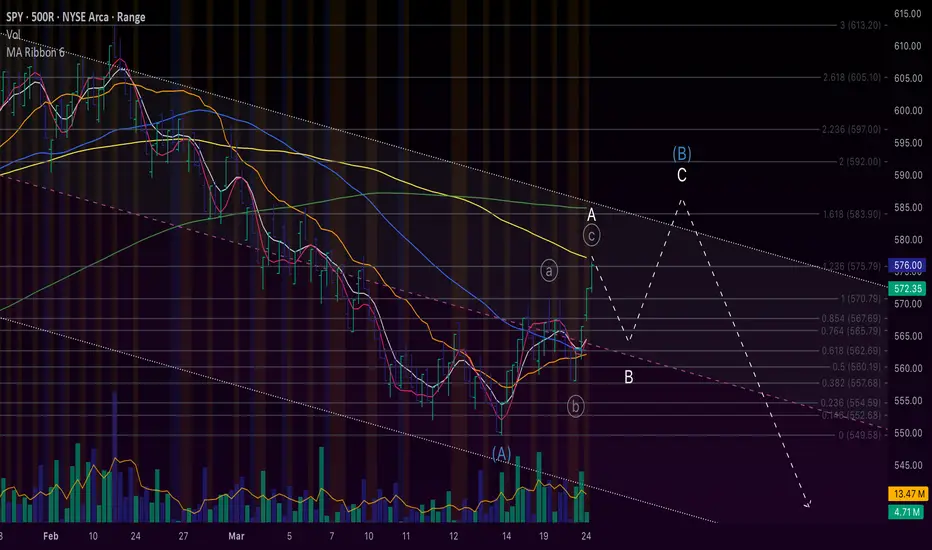
On the 500R chart ($5), the price has risen in a distinct 3-wave pattern labelled A-B-C, with C reaching the 1.236 extension of A and finding resistance at the 100SMA (yellow). The low of Wave (A) respected the boundary of the lower line of the regression trend I have added to the chart. While this trend started prior to what I am considering Wave (A), I still think it provides a good target for the top of the retracement.
Wave (c) of A of (B) (still following me?) is not confirmed as complete yet. It could extend as far as $584 without pulling back, however I anticipate the market building more liquidity on the way up while burning options in the process. I bought 3/28 $570p at the end of the day in case we see a 50%-61.8% pullback to $560-$563 by the end of the week. If that happens, we should have enough room to reach the upper band at $585, which would be a little over a 50% retracement of Wave (A). This would also cause the price to touch the 200 SMA (green), which is common in the first major retracement of a bear market.
Lastly, from a psychological perspective, the market reached an overwhelmingly bearish consensus from mid-February to mid-March. Sentiment during Wave (a) was mostly bearish, but sentiment has shifted positive since the price entered Wave (c) and gapped up on Monday, resulting in a >+1% day. This sets the stage for a rug pull and subsequent bear trap for late sellers who will assume the downtrend has resumed prematurely.
We'll see how this plays out. I'll switch to calls if a higher high is made Wednesday 3/26. Good luck to all.
SPY trade ideas
Nightly $SPY / $SPX Scenarios for April 2, 2025 🔮 🔮
🌍 Market-Moving News 🌍:
🇺🇸📈 President Trump’s 'Liberation Day' Tariff Announcement: President Donald Trump is set to announce new reciprocal tariffs on April 2, aiming to align U.S. import duties with those imposed by other countries on American goods. This move is expected to impact various sectors, including automotive and manufacturing, and may lead to market volatility as investors react to potential shifts in trade policies.
📊 Key Data Releases 📊
📅 Wednesday, April 2:
🏭 Factory Orders (10:00 AM ET):
Forecast: 0.6%
Previous: 1.7%
Indicates the dollar level of new orders for both durable and non-durable goods, reflecting manufacturing demand.
⚠️ Disclaimer: This information is for educational and informational purposes only and should not be construed as financial advice. Always consult a licensed financial advisor before making investment decisions.
📌 #trading #stockmarket #economy #news #trendtao #charting #technicalanalysis
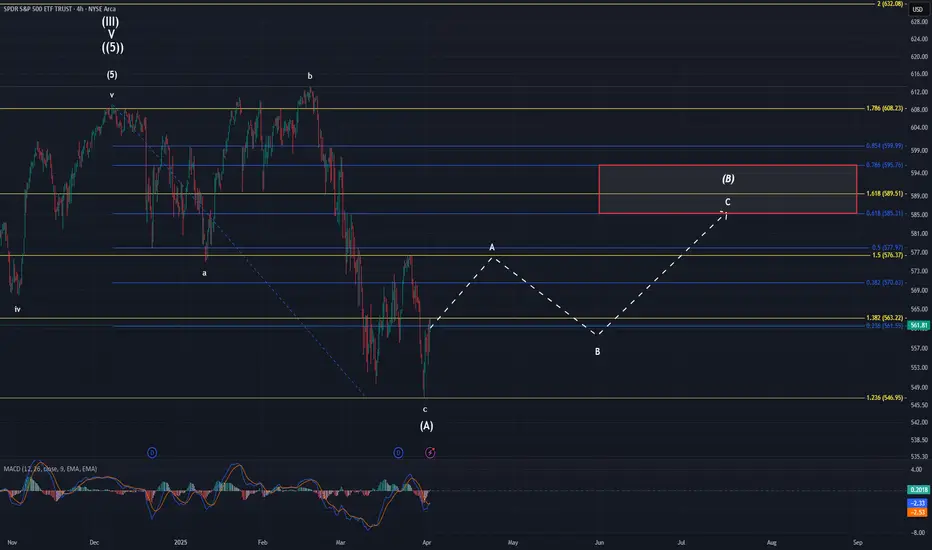
SPY UpdateIt appears that intermediate (A) had OML to give us before it was finished. Price literally moved $0.08 cents below the larger 1.236 and then gave us a reaction. We also got better pos div completing the reqs for a healthier consolidation higher. If we have in fact bottomed, then I would expect the ensuing price action to resemble the dotted line I have drawn on the chart. This doesn't mean that price will follow this pattern to the T. It is just what a standard abc pattern would appear like. Don't forget that b waves are extremely complex more times than not, so that could alter the way this pattern gets carved out. Also, the dotted line may look straight, but the structure will be far from it. People often times forget that price doesn't move in one direction, and there will be choppy overlapping moves. Regardless on how the pattern turns out, if the (A) wave is in fact complete, then the target box is the standard place for intermediate (B) to terminate at.
I expect this next move to take 2-4 months if it is to compare to the time duration of the (A) wave. There are no rules governing duration, though. Technically speaking, (B) could be over by the end of the week. The odds of that happening are extremely low, but it is possible.
SPY Shows Strong BOS, But Faces Gamma Resistance at $563 (?)Market Structure (1H – SMC View):
* Price rebounded after BOS at ~$552 and has since broken multiple minor structure levels to the upside.
* Multiple Breaks of Structure (BOS) confirm bullish shift, with recent CHoCH validating demand zone below $550.
* Price is consolidating near a supply zone around $561–$563 which acted as a prior CHoCH zone.
Key Price Zones:
* Demand Zone (Support): $546–$552
* Supply Zone (Resistance): $561–$563 (where price currently sits)
* Macro Support: $550 = PUT wall + gamma support
* Micro Resistance: $563 = strong GEX call resistance
Trendlines + Price Action:
* Clean stair-step move up into resistance.
* Price approaching apex of recent flag-like structure; breakout confirmation needed.
* Watch for either rejection at this gamma wall ($563) or breakout continuation above.
Indicators:
* MACD: Bullish crossover still intact but showing slight flattening—watch for histogram weakness.
* Stoch RSI: Near overbought, curling—possible minor pullback or consolidation.
* 9 EMA > 21 EMA: Trend remains bullish for now.
Options Sentiment & GEX (from GEX Chart):
* IVR: 41.8 — moderately elevated, shows short-term volatility interest.
* IVx Avg: 25.4 — indicating steady option pricing.
* Put/Call Ratio: 84.5% puts — extremely defensive positioning in options market.
* GEX: 🚦Red, Yellow, Green — Neutral-to-bearish gamma zone.
* Major GEX Levels:
* Resistance / Gamma Wall: $563 – Highest positive NETGEX (major level to watch).
* Support / Gamma Cushion: $550–$555 – Includes PUT wall and GEX support.
Scenarios to Watch:
🟢 Bullish Case:
* Break & hold above $563 → potential rally toward $568+
* Confirmation of continued structure shift and gamma squeeze likely if open interest reshuffles upward.
🔴 Bearish Case:
* Rejection at $563 + failure to hold $560 → fast pullback to $555 or test of $550 demand zone.
* Watch for bearish divergence in MACD or failure to maintain EMA trend alignment.
Trade Ideas (Not Financial Advice):
* Scalp Long: If price confirms breakout above $563 with volume, target $568+
* Put Credit Spread or Long Calls: If holding above $560 with strong tape.
* Fade Setup: If SPY rejects $563 with bearish engulfing or momentum stalling, consider short to $555–$550.
🧠 Final Thoughts: SPY is at a decision point. Gamma wall at $563 could act as a ceiling unless there’s sufficient momentum + institutional call flow to drive a breakout. FOMC or macro catalysts could also be trigger points. Stay nimble.
This analysis is for educational purposes only and does not constitute financial advice. Always do your own research and trade responsibly.

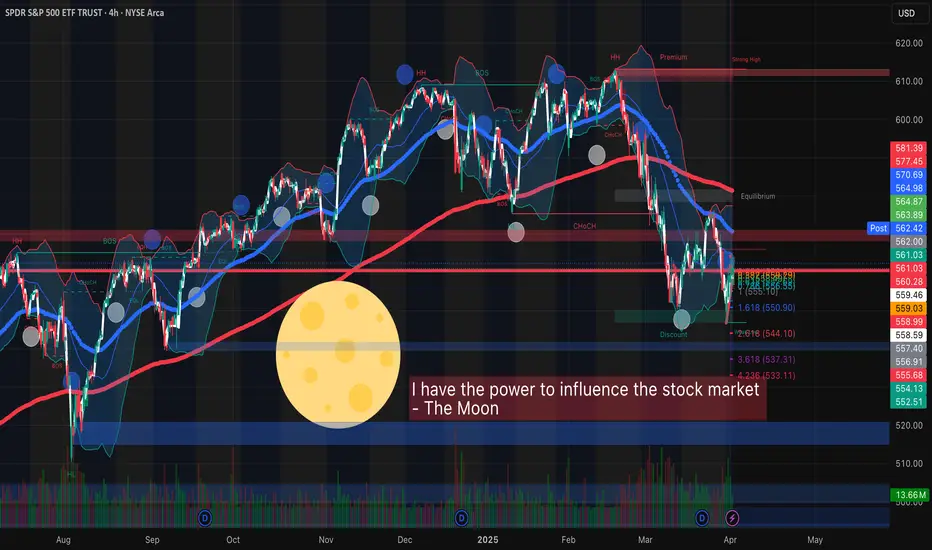
FULL MOON and SPYHello traders! One of the great legends, OSHO, explains that if the moon has enough power to cause turbulence in the oceans, then why can't it affect human beings thinking and behaviors when the human body is made up of roughly 60% water? OSHO further explains that in history many people have been enlightened and many become mentally disturbed on days like a FULL MOON, and he explained that there must be a connection between planets positions and human behaviors.
Now, if it comes to trading SPY based on the moon phases, then I have backtested a few full-moon dates, and I have found something interesting that makes me think of incorporating a full-moon strategy while trading SPY/SPX or any other major index. I am not promoting astrology or abnormal ideas, but I want to share my research with you all because I found a connection and patterns in the behavior of SPY and the full moon. You are not forced to think about astrology in trading, but having knowledge and the ability to see patterns in the world can help you build your intuitive thinking and deep subconscious knowledge.
This year, taking Los Angeles as a reference, full moon dates were on Jan 13, Feb 12, and March 13. On January 13, the price showed a bullish run all day with low and high points of about 575.36 and 581.69, respectively. The similar bullish run was observed on February's full moon day, i.e., on 12th February, when SPY showed a low of 598.41 and a high of 604.52, making the market bullish all day. In contrast, we have observed a sharp decline in SPY on March 13, 2025 (full moon), which could seem to invalidate the full-moon strategy, but in the long run, SPY and the SPX Index remain bullish most of the time.
Carefully observing previous year (2024) full-moon dates, I have found that SPY opened 4 times gap-up on full moon dates (May 23 2024, July 21 2024 (market off but gap-up next session), October 17 2024, December 15 2024 (market off but gap-up next trading session). 5 times out of 12 were classified as bullish to strongly bullish: January 20 2024 (Bullish after 11:00 AM PST), March 25 2024 (sideways market but bullish overall), April 23 2024 (Bullish), August 19 2024 (bullish), and September 18 2024 (bullish after 9:00 AM PST). The market remains gap-down and bearish two times on February 24 2024, and on November 15 2024.
Now, since I have found that the SPX Index remains bullish on most of the FULL MOON dates, and the chances of a gap-up opening on or the next day of the FULL MOON (in case the market is closed on the FULL MOON) are very high based on the results obtained from the PY 2024 and 2025 previous months. The next FULL MOON is on Saturday, 12th April 2025, and the market is closed on this date; therefore, on 14th April 2025, if the market repeats itself, then I can expect SPY to open gap-up, and it would be interesting to see if FULL MOON really has the power to influence the stock market. Let’s give it a try, and on 11th April, 2025, if the market gives signs of huge buying pressure, then I will be buying some calls expiring April 14th, 2025, to test the full moon strategy.
I am the only writer of this article, so there are high chances that I might have made some mistakes while publishing. Therefore, I would be happy to see if you can correct me if I'm wrong or if you can share your own knowledge and insights about the relationship between MOON and SPY. Thoughts and comments?
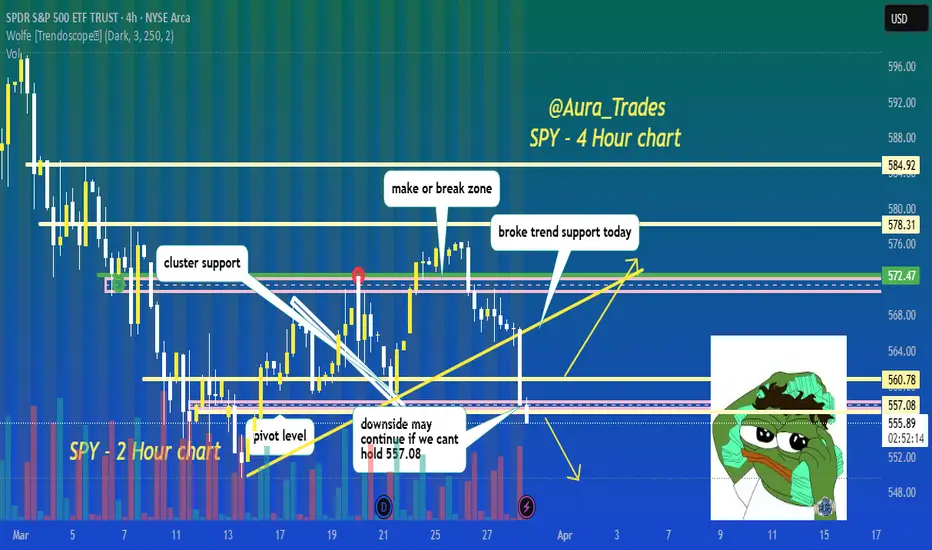
overview after the close quick overview after the close. I wasn't happy with the pump at the end of the day but I still lean bearish for some reasons I discuss.

Bear flag on 1hr chartDecent size bear flag on 1hr chart. It’s looks like it setting up for tomorrow. It is currently breaking the bottom trend line and completing the pattern. If it rejects we could see it bounce one more time before the drop tomorrow. If this closes at 555-556. We could see in the next couple of days 540-545.
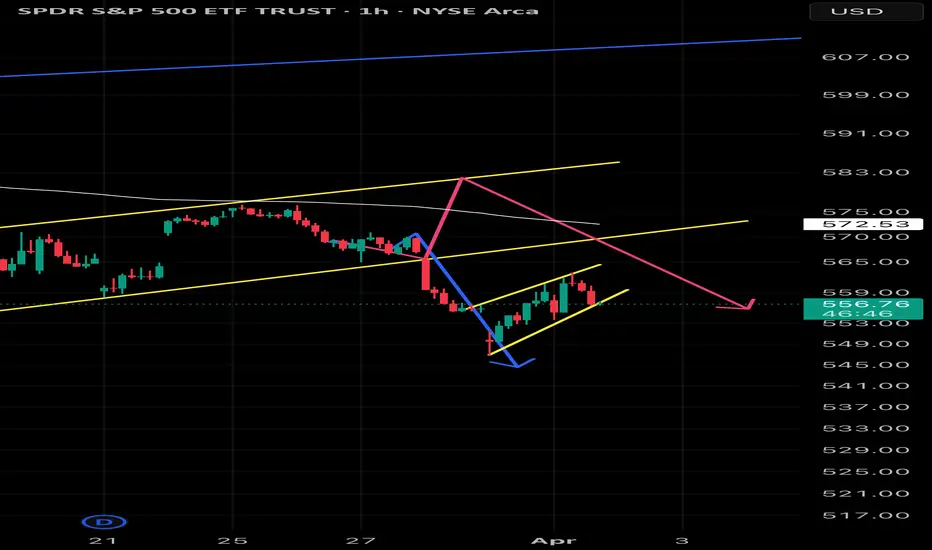
SPY is breaking support! can it reclaim?bearish break of trend support and pivot level today, if it cant reclaim 557 by close we probably see more downside next week, break above 560.78 and the bulls can start to run it back higher
boost and follow for more! 🔥
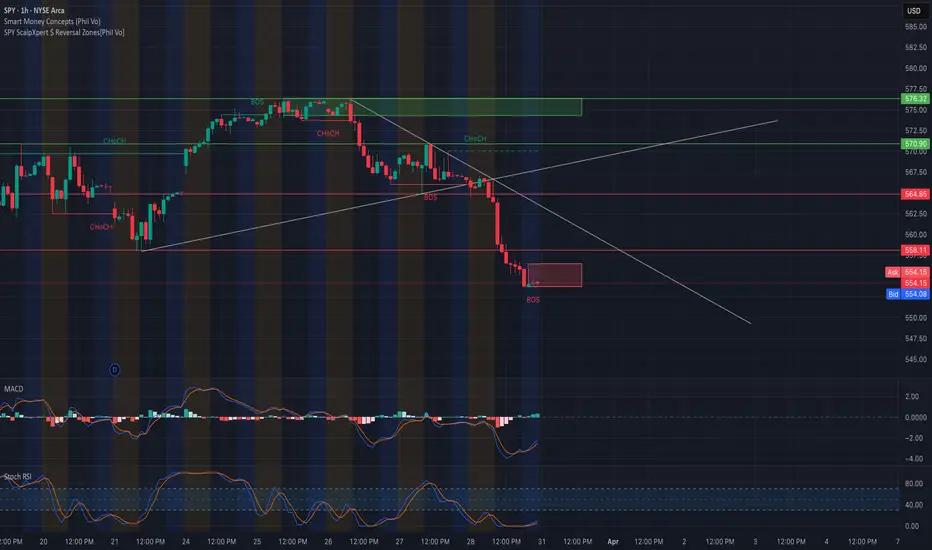
SPY at a Pivotal Zone – Bounce or Breakdown? 🧠 Market Structure + Price Action (1H)
* Trend: Downtrend confirmed. Recent Break of Structure (BOS) followed a Change of Character (CHoCH) from bulls to bears.
* Bearish momentum intensified after SPY broke support near 570.90, then plummeted through 564.85 and 558.11 key demand levels.
* Current price: 554.15 — bouncing slightly within a local demand/reaction box, but still under selling pressure.
* Price is now consolidating below structure, but inside a potential reaction zone (possible dead cat bounce or minor retracement).
🔍 Smart Money Concepts (SMC)
* CHoCH & BOS align with institutional exit behavior. The BOS confirms bearish intent.
* SPY has entered a minor demand zone, but hasn’t reclaimed any bullish market structure yet.
* If it breaks below 549.68, the next support zone opens toward the 540s.
🔁 Indicators
MACD:
* MACD is starting to curve up, with histogram showing decreasing red momentum – a potential bounce brewing.
Stoch RSI:
* Oversold condition with both lines crossing upward — supports a short-term relief rally or retracement.
🔥 GEX & Options Sentiment Analysis
* IVR: 37.8 (Moderate); IVx Avg: 22.6
* Put Positioning: Very high at 71% — bears are loaded up.
* GEX Sentiment:
* GEX is red 🔴🔴🔴 — strong gamma exposure to puts, favoring downward pressure.
* Highest negative NETGEX / PUT Support at 555.83, which is just above current price — this acts as a magnet and pivot.
* If SPY stays below this level, dealer hedging accelerates selling.
* Major Put Walls at:
* 545: GEX8 at -22%
* 544-540: Very deep bearish gamma — potential acceleration if we break lower.
* Call Resistance (Gamma Wall):
* 573 → 577 → 580 zone = Gamma ceiling.
* Dealers short calls here and hedge by selling, which adds resistance on rallies.
⚖️ Trade Scenarios
🐂 Bullish Reversal Setup:
* Trigger: Break & close above 555.83 with volume.
* Target: 558.11 → 564.85
* Invalidation: Below 549.68
* Risk/Reward: Favorable if volume confirms.
🐻 Bearish Continuation Setup:
* Trigger: Break below 549.68 with follow-through.
* Target: 545 → 540 zone (GEX & PUT walls)
* Stop-Loss: Above 555.83 or structure retest
* Confluence: GEX alignment + broken structure + dealer flow pressure.
🧭 Directional Bias:
Bearish bias still intact — but signs of short-term bounce forming. Likely we see a dead cat bounce unless 555.83 is reclaimed with conviction.
🎯 Actionable Strategy:
* Intraday scalp: Long toward 558 if price reclaims 555.83.
* Swing short: Below 549.68 toward 540 using SPY or PUT options.
⚠️ Disclaimer:
This analysis is for educational purposes only. It does not constitute financial advice. Always do your own research and manage your risk.
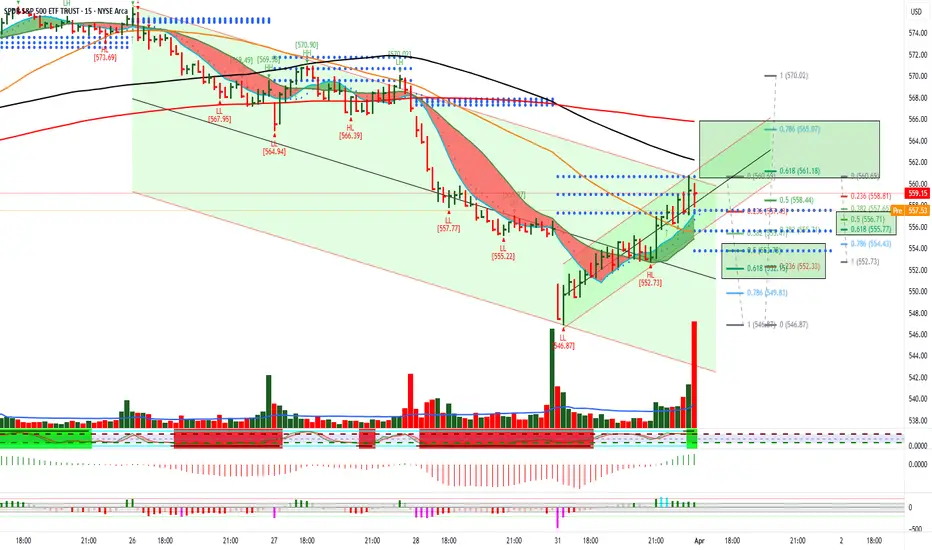
$SPY April 2, 2025AMEX:SPY April 2, 2025
15 Minutes
Downtrend intact as long below 200 in 15 minutes for the day.
For the fall 570.02 to 546.87 AMEX:SPY has retraced to 61.8 level around 561.
For the rise 546.87 to 560.69 holding 552-553 is important.
For the day consider the last rise from 552.73 to 560.69.
Holding 555-556 we can expect 561-563 as target for the day. It should be resisted around 564-565 being 200 averages in 15 minutes.
SPY/QQQ Plan Your Trade For 4-1-25 : Temp Bottom PatternToday's pattern suggests the SPY/QQQ will attempt to find temporary support near recent lows or a bit lower.
I'm not expecting much in terms of price trending today. I do believe the downward price trend will continue today with the SPY attempting to move down to the 548-550 level trying to find support.
The QQQ will likely attempt to move downward toward the 458-460 level trying to find the support/base/bottom level today.
Gold and Silver are in a moderate consolidation phase that I believe is transitioning through a Flag-Trend-Flag-Trend-Flag-Trend type of phase. Ultimately, the trend will continue to push higher through this phase as metals have moved into the broad Expansion phase. This phase should see gold attempt to move above $4500+ before the end of May/June 2025.
BTCUSD is rolling within the 0.382 to 0.618 Fibonacci price levels related to the last price swing. I see this middle Fib level and the "battle ground" for price. I expect price to stall, consolidate, and roll around between these levels trying to establish a new trend.
Thus, I believe BTCUSD will move downward, attempting to move back down to the $78,000 level.
Nothing has really changed in my analysis except that we are experiencing a 48-96 hour consolidation phase before we move back into big trending.
Play smart. Position your trades so that you can profit from this rolling price trend and prepare for the bigger price move downward (targeting the bigger base/bottom near April 15, 2025).
Get some.
#trading #research #investing #tradingalgos #tradingsignals #cycles #fibonacci #elliotwave #modelingsystems #stocks #bitcoin #btcusd #cryptos #spy #gold #nq #investing #trading #spytrading #spymarket #tradingmarket #stockmarket #silver

Nightly $SPY / $SPX Scenarios for April 1, 2025🔮 🔮
🌍 Market-Moving News 🌍:
🇺🇸📈 ISM Manufacturing PMI Release: The Institute for Supply Management (ISM) will release its Manufacturing Purchasing Managers' Index (PMI) for March. A reading below 50 indicates contraction in the manufacturing sector, which could influence market sentiment.
🇺🇸🏗️ Construction Spending Data: The U.S. Census Bureau will report on February's construction spending, providing insights into the health of the construction industry and potential impacts on related sectors.
🇺🇸📄 Job Openings Report: The Job Openings and Labor Turnover Survey (JOLTS) for February will be released, offering a view into labor demand and potential implications for wage growth and consumer spending.
📊 Key Data Releases 📊
📅 Tuesday, April 1:
🏭 ISM Manufacturing PMI (10:00 AM ET):
Forecast: 49.5%
Previous: 50.3%
Assesses the health of the manufacturing sector; a reading below 50% suggests contraction.
🏗️ Construction Spending (10:00 AM ET):
Forecast: 0.3%
Previous: -0.2%
Measures the total value of construction work done; indicates trends in the construction industry.
📄 Job Openings (10:00 AM ET):
Forecast: 7.7 million
Previous: 7.7 million
Provides insight into labor market demand by reporting the number of job vacancies.
⚠️ Disclaimer: This information is for educational and informational purposes only and should not be construed as financial advice. Always consult a licensed financial advisor before making investment decisions.
📌 #trading #stockmarket #economy #news #trendtao #charting #technicalanalysis
SPY/QQQ Plan Your Trade EOD Update : Rejecting The BreakdownDoes this big rejection bar mean the selling trend is over?
I doubt it.
In my opinion and experience, big rejection bars like this reflect a critical price level where the markets will attempt to REVISIT in the near future.
Normally, when we get a big rejection bar, like today, we are testing a critical support/resistance level in price and you can see the difference between the SPY, DIA and QQQ charts.
The QQQ price data is already below the critical support level and barely trying to get back above the rejection level. Whereas the SPY and DIA are still above the rejection lows.
I see this as a technology driven breakdown and because of the continued CAPTIAL SHIFT, we may move into a broader WAVE-C breakdown of this current trend.
I see the SPY already completing a Wave-A and Wave-B. If this breakdown plays out like I expect, we'll see a bigger breakdown in price targeting $525-535, then possibly reaching $495-505 as the immediate ultimate low.
If you follow my research, there is a much lower level near $465-475 that is still a likely downward target level, but we'll have to see how price reacts over the next 2+ days before we can determine if that level is still a valid target.
Watch for more support near recent lows tomorrow, then a potential breakdown in the SPY/QQQ/DIA.
Get some.
#trading #research #investing #tradingalgos #tradingsignals #cycles #fibonacci #elliotwave #modelingsystems #stocks #bitcoin #btcusd #cryptos #spy #gold #nq #investing #trading #spytrading #spymarket #tradingmarket #stockmarket #silver

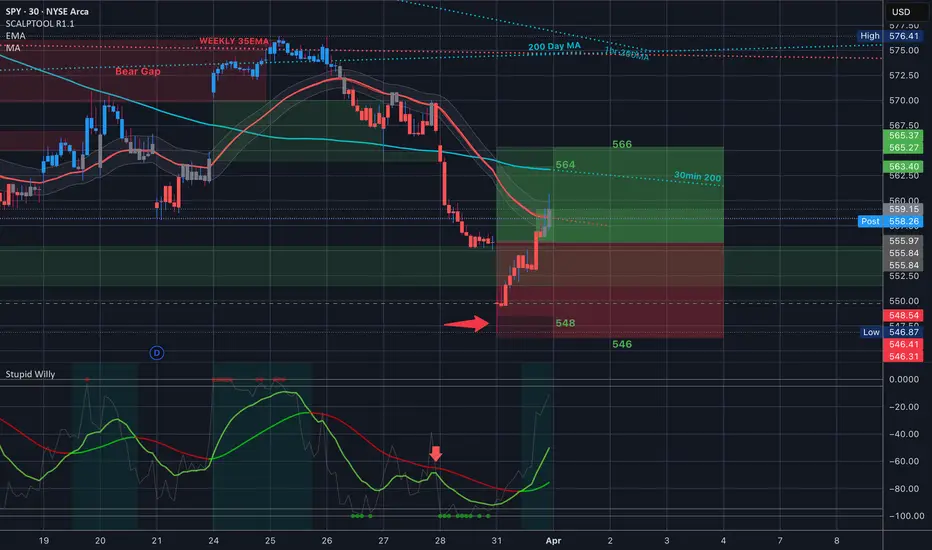
$SPY BOOOM Perfectly Nailed the Bottom in last nights video
548/546 Bull put spreads were the money play today on that drop. And of course that would have been the place to go long on the day.
SPY timing for low Tgt $585My short idea target was hit (and blown yesterday, tho QQQ idea was almost perfect), and if you saw the last idea, I mentioned the date of the 11th was in play. This seems accurate from what I'm getting now with my dowsing work.
I am quite pumped that the timing was so good. The upside target (repeating) is around $585. When I ask what date this hits by, I get 3/25. We shall see if lightning can strike twice!

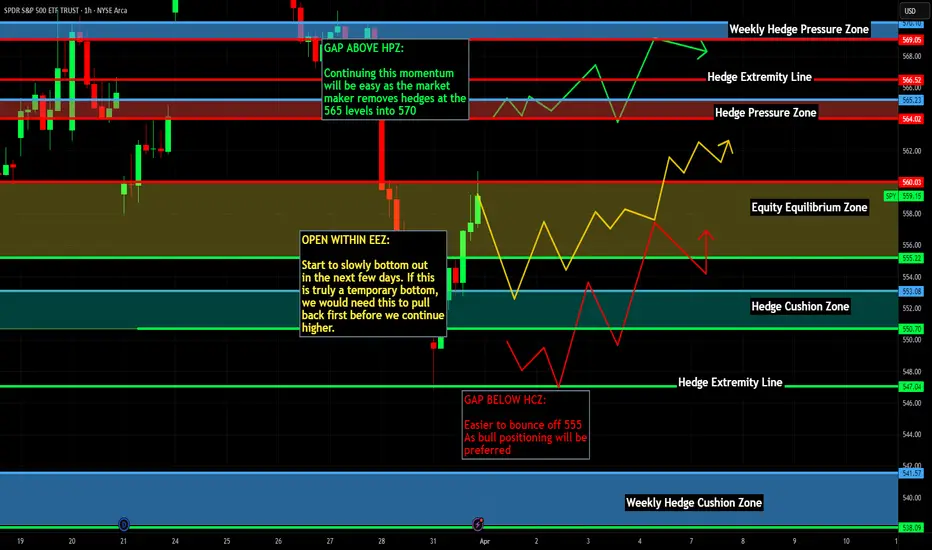
SPY - Macro-Market Overview and what the algorithms are sayingCurrently we are being guided by a strong selling teal on the LTF but we must keep in mind the HTF algorithms of red and white (which are bullish liquidity builders). Right now, we need to see who wins out in this fight between teal and red - if we break red and prove teal guidance, we are definitively in strong selling and can easily make our way toward the HTF white at the low $500's.
As always, let the algorithms guide you!
Happy Trading :)

$SPY March 31 2025
Looks like the structure is broken. No need to fight the trend as of now.
540 is the target for the last rise as marked.
As long as below 200 in lower time frames. No buys for me.
SPY/QQQ Plan Your Trade For 3-31 : Carryover PatternToday's pattern suggests the SPY/QQQ will attempt to carryover Friday's selling trend.
I do believe the SPY/QQQ will attempt to find some support as we move into a Temp Bottom pattern tomorrow. So be aware that the SPY/QQQ may attempt to find support near 535-540/450-455 over the next few days.
I would also urge traders to not get very aggressive in terms of trying to pick a bottom in this downtrend.
In my opinion, I don't see any reason why anyone should be buying into this breakdown unless you are prepared to take a few big lumps. Just wait it out - wait for a base/bottom to setup.
Gold and Silver are moving higher and I believe this trend will continue for many weeks/months.
BTCUSD should continue to move downward - trying to establish the Consolidation Phase range.
As we move into trading this week. Be aware that Tuesday/Wednesday of this week are more ROTATION type days. They may be wide-range days - but they are still going to be ROTATIONAL.
Get some.
#trading #research #investing #tradingalgos #tradingsignals #cycles #fibonacci #elliotwave #modelingsystems #stocks #bitcoin #btcusd #cryptos #spy #gold #nq #investing #trading #spytrading #spymarket #tradingmarket #stockmarket #silver

$Spy Road To $544well in summary this is the same chart i made 2 in a half weeks ago with no changes i never changed my thesis to bear lol allocating funds to the downside for my Short thesis!!! Lets see if we hit $544 this week Market sentiment is Bearish Terrif Reactions will most likely be priced in shortly so the market can actually choose its direction short bear market or bear market this week, this week will give a lot of insight and valuable information as always safe trades good luck traders and yes i will update this thread when in my theory and assessment analysis of $544 hits where i think the market go from there!!!!!

SPY: SPY looking a bit like scary hour? Continuous tariff new’s scaring the market. Many continue to say Bearish then some say Bullish.
Looking like it can retest the demand zone I see at the 1M at 584.83 but today 3/30 on AH looks like things may be gapping down already.
What are your thoughts?
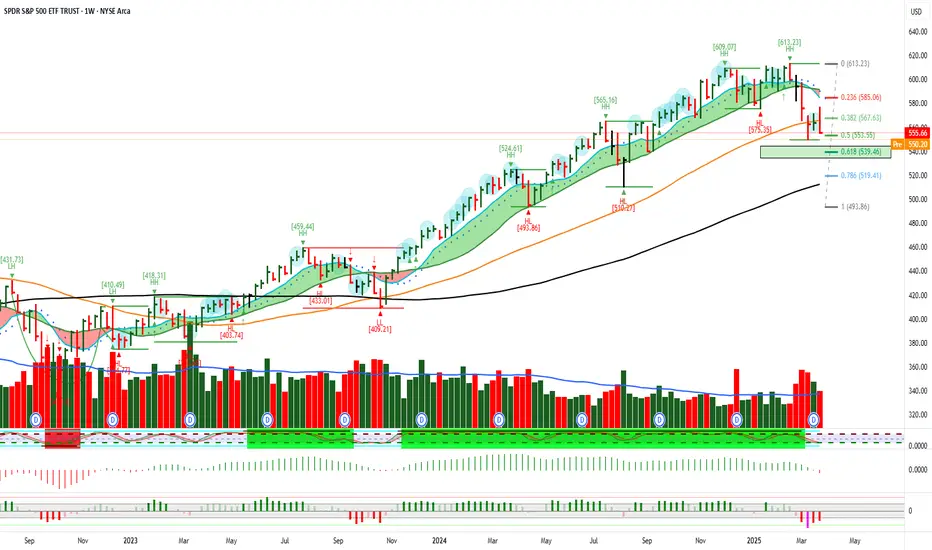
Chat, Are we Cooked?We had a very similar post-Covid run up all the way before breaking in January 2022.
We saw a similar run up since that time.
Round 2, or just an overreaction?

Weekly $SPY / $SPX Scenarios for March 31 – April 4, 2025🔮 🔮
🌍 Market-Moving News 🌍:
🇺🇸📈 Anticipated U.S. Jobs Report: The March employment data, set for release on Friday, April 4, is expected to show a slowdown in job growth, with forecasts predicting an increase of 140,000 nonfarm payrolls, down from 151,000 in February. The unemployment rate is projected to remain steady at 4.1%. This report will be closely monitored for signs of economic momentum and potential impacts on Federal Reserve policy.
🇺🇸💼 President Trump's Tariff Announcement: President Donald Trump is scheduled to unveil his "reciprocal tariffs" plan on Wednesday, April 2, dubbed "Liberation Day." The announcement is anticipated to include a 25% duty on imported vehicles, which could significantly impact the automotive industry and broader market sentiment. Investors are bracing for potential volatility in response to these trade policy developments.
🇺🇸📊 Manufacturing and Services Sector Updates: Key indicators for the manufacturing and services sectors are due this week. The ISM Manufacturing PMI, scheduled for Tuesday, April 1, is expected to show a slight contraction with a forecast of 49.5%, down from 50.3% in February. The ISM Services PMI, set for release on Thursday, April 3, is projected at 53.0%, indicating continued expansion but at a slower pace. These reports will provide insights into the health of these critical sectors.
MarketWatch
📊 Key Data Releases 📊
📅 Monday, March 31:
🏭 Chicago Business Barometer (PMI) (9:45 AM ET):
Forecast: 45.5
Previous: 43.6
Measures business conditions in the Chicago area, with readings below 50 indicating contraction.
📅 Tuesday, April 1:
🏗️ Construction Spending (10:00 AM ET):
Forecast: 0.3%
Previous: -0.2%
Indicates the total amount spent on construction projects, reflecting trends in the construction industry.
📄 Job Openings (10:00 AM ET):
Forecast: 7.7 million
Previous: 7.7 million
Provides insight into labor demand by measuring the number of job vacancies.
📅 Wednesday, April 2:
🏭 Factory Orders (10:00 AM ET):
Forecast: 0.6%
Previous: 1.7%
Reflects the dollar level of new orders for both durable and non-durable goods, indicating manufacturing demand.
📅 Thursday, April 3:
📉 Initial Jobless Claims (8:30 AM ET):
Forecast: 226,000
Previous: 224,000
Measures the number of individuals filing for unemployment benefits for the first time, providing insight into labor market conditions.
📊 Trade Balance (8:30 AM ET):
Forecast: -$123.0 billion
Previous: -$131.4 billion
Indicates the difference between exports and imports of goods and services, reflecting the nation's trade activity.
📅 Friday, April 4:
💵 Average Hourly Earnings (8:30 AM ET):
Forecast: 0.3%
Previous: 0.3%
Measures the change in earnings per hour for workers, indicating wage inflation.
⚠️ Disclaimer: This information is for educational and informational purposes only and should not be construed as financial advice. Always consult with a professional financial advisor before making investment decisions.
📌 #trading #stockmarket #economy #news #trendtao #charting #technicalanalysis

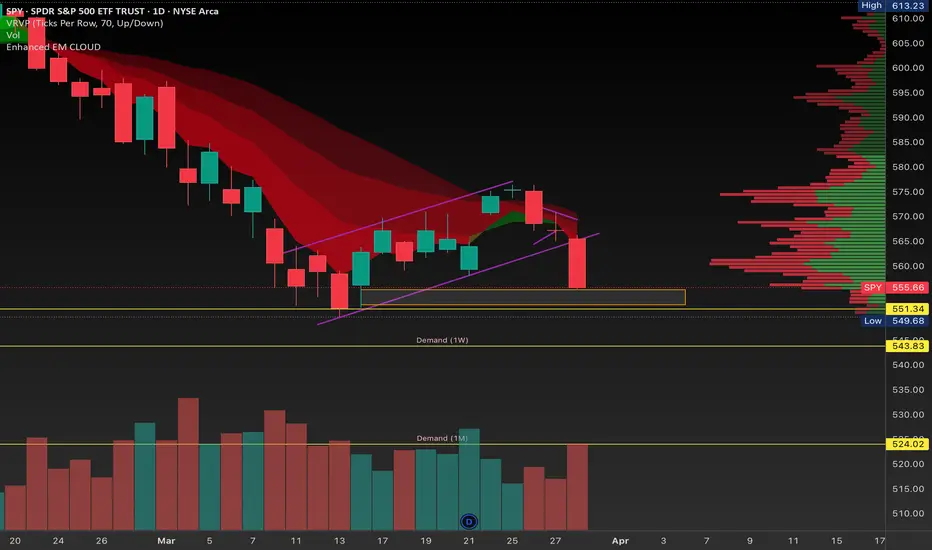
SPY $545 Downtrend ContinuesSymbol: SPY
Timeframe: 30-minute chart (for your analysis)
Bias: Short (after the anticipated bounce)
Prediction: I anticipate a short-term bounce in SPY from Friday's sell-off towards the upper level of the weekly regression channel, around 560. I plan to look for a short entry at this level, expecting the price to then continue its downtrend towards the monthly regression channel support around 545.
Analysis:
Weekly Trend Channel (Blue Double Lines): The blue double lines on my chart represent a weekly trend channel for SPY. This channel was determined by performing a linear regression on the price action over the past week. The upper and lower boundaries of the channel are set at two standard deviations away from this linear regression line. This method helps to identify the statistically probable range within which the price is likely to trade over the weekly timeframe.
Monthly Trend Channel (Yellow Double Lines): Similarly, the yellow double lines indicate a monthly trend channel. This channel is derived from a linear regression of SPY's price action over the past month, with the boundaries set at two standard deviations. I expect SPY to eventually find support within this monthly channel, with the lower boundary currently around the 545 level. This is my primary downside target.
Recent Price Action and Anticipated Bounce: The aggressive 2% downtrend on Friday likely pushed SPY towards the lower end of the weekly channel, potentially creating oversold conditions in the short term. I am anticipating a bounce from this sell-off towards the upper boundary of the weekly channel, which I estimate to be around 560. This level is expected to act as resistance.
Short Entry Opportunity: I will be closely watching price action around the 560 level, which coincides with the upper boundary of the weekly regression channel. If I observe signs of rejection or bearish confirmation at this resistance, I will look to enter a short position.
Contributing Factors: President Trump's aggressive tariff policies continue to contribute to market uncertainty and the overall bearish sentiment, supporting the technical outlook for further downside.
Conclusion:
I am predicting a short-term bounce in SPY to approximately 560, which aligns with the upper level of the weekly regression channel. I will be looking for a short entry at this level with the expectation of a subsequent move down towards the monthly regression channel support around 545. This strategy aims to capitalize on a potential retracement within the established downtrend, guided by regression-based trend channels and influenced by fundamental concerns regarding tariff policies.
Disclaimer: This is my personal analysis and not financial advice. Please conduct your own research before making any trading decisions.
