SPY trade ideas

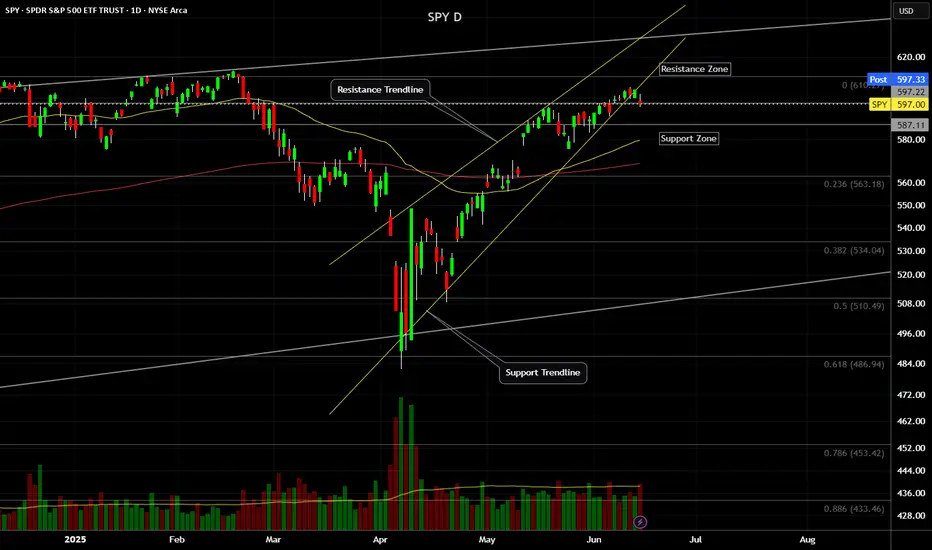
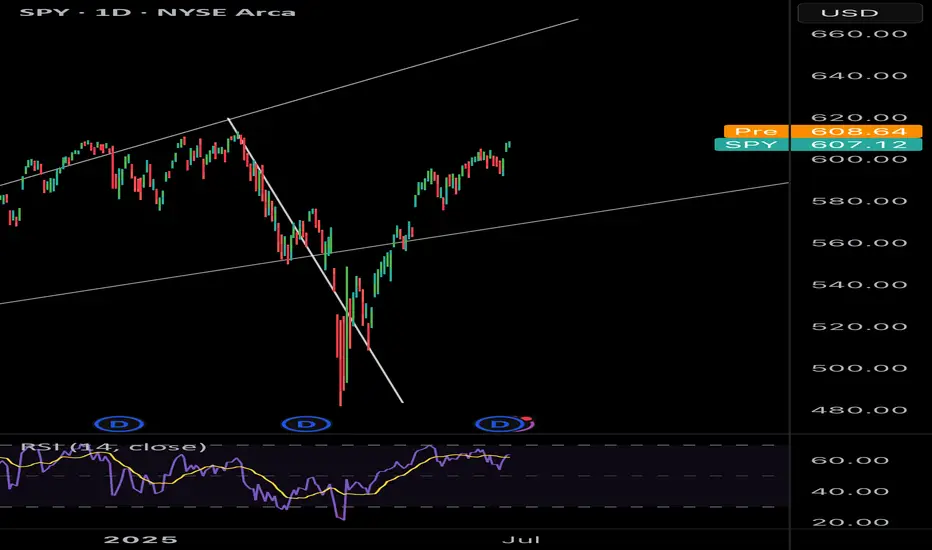
SPY (S&P500) - Price Testing Support Trendline - Daily ChartSPY (S&P500 ETF) price has just closed below $600 and is currently under a support trendline.
If price cannot breakout above the $600 and $605 resistance level this month, a pullback could occur down to the support zone.
SPY price could potentially pullback to various levels of support due to:
-USA domestic conflict
-International military conflicts
-Technical chart bearish divergence
-USA federal reserve interest rate news
-Government and corporate news
Support Levels: $595, $590, $585, $580.
Resistance Levels: $600, $605, $610, $615.
The 50EMA/200EMA Golden Cross is still on-going, and support prices of $580 and $568 have yet to be tested significantly.
Update into the closeAnd I cover other charts as well. I expect lower on SPX next weel. Higher on Gold and OIL. Likely higher on Nat Gas, lower on BTC

The Turn?spx should continue down, I also cover other markets. OIl long term looks very bullish. I'm sick so short video.

Spy Prediction Potential breakout of bull flag if it bounces back after retest of 200 SMA. Could see an attempt for new ath.
Spy needs to reach 602.23 and hold that floor before the breakout. Watch for volume spike and close above 603. Watch for confirmation on the breakout.
Potential entries based on risk - 603.61 & 602.95
If volume or momentum declines, we could see a potential breakdown back towards 598.
Watch out for fakeouts.
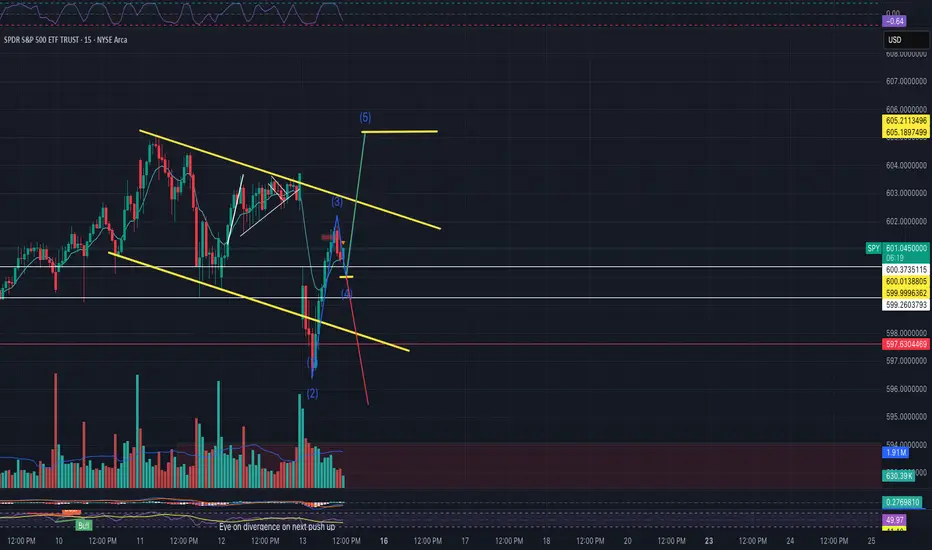
SPY/QQQ Plan Your Trade For 6-13 : Harami-Inside PatternToday's pattern suggests the markets may stall into a sideways price range.
After the news of Israel targeting Iran in a preemptive strike late yesterday afternoon, the markets moved dramatically lower while Gold & Silver moved higher on the news.
I, personally, see this market trend as a shift in thinking ahead of a long Father's Day weekend.
I see traders trying to position their accounts/trades for uncertainty.
I believe we could see a bit of a shift today - particularly in Metals and the QQQ/NASDAQ/BTCUSD.
Overall, I strongly suggest traders prepare for extreme volatility this weekend as any further news of a counter-strike or further military action in the Middle East could roil the markets.
Happy Friday the 13th - everyone.
Going to be an interesting day to say the least.
Get some.
#trading #research #investing #tradingalgos #tradingsignals #cycles #fibonacci #elliotwave #modelingsystems #stocks #bitcoin #btcusd #cryptos #spy #gold #nq #investing #trading #spytrading #spymarket #tradingmarket #stockmarket #silver

SPY . Market Corrections IncomingHey Guys it's been a long time but I'm going to be more consistent in publishing more. The S&P 500 has hit a level of resistance 4 times on the daily chart. which is very very telling. Yes I understand we have news and war being a major catalyst in the stock market rallying a lot lately but this is only temporary. This previous witching was last Friday if you weren't aware which also caused the small pull back. So for further bullishness to continue let's look at the earnings for the magnificent 7 and the rest of the tech sector. More war means more money for the market . we have the next witching in September . and so here are my projections. We take a step higher in July as we go into the peak of SOLAR Maximum . please do your research. and then after that by September we go into pull season . Happy trading
SPY soars to new all time highsThere has been a lot of speculation about where SPY is going next. I believe a significant correction will happen in the near future. However, today SPY is creeping back into the strong uptrend it once had. Looking at chart patterns, SPY is building momentum once more and will be hitting another yet another all time high.
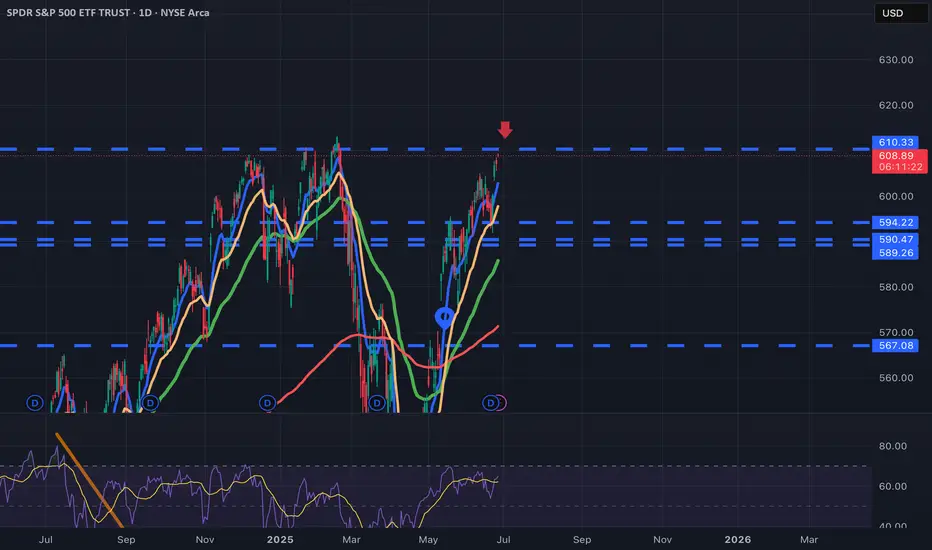
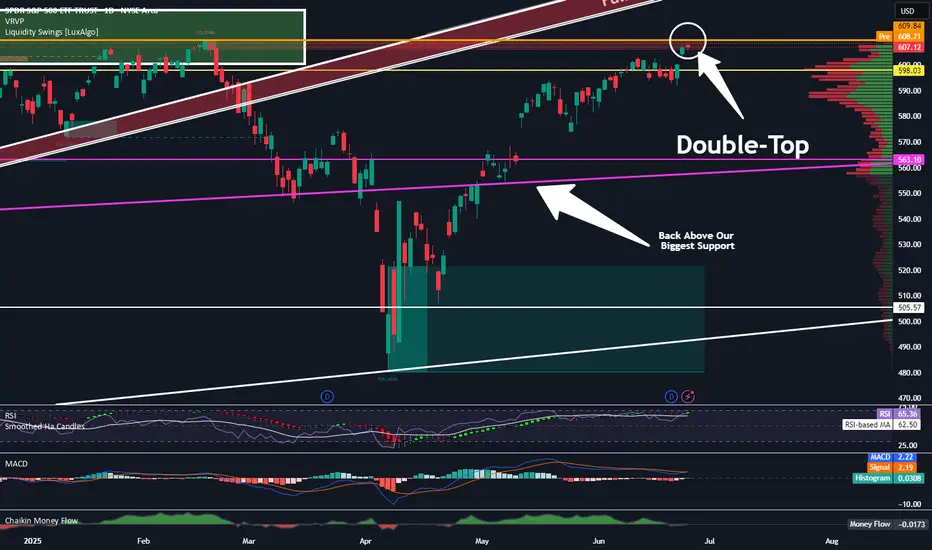
What Is The Market Waiting For?Good Morning Trading Fam,
Our stock and crypto markets seem to have stalled. You may be wondering what they are waiting for. Quite simply, the S&P 500 has reached a double-top. That's all. There may be some more pause here for the next week or so. Barring any significant bearish geopolitical or other events, I expect us to move higher. Any FUD at all will send the market back down again. So yes, unfortunately, the next move(s) will be mostly predicated on news. Traders are rather fragile rn. Trade accordingly.
Best,
Stew
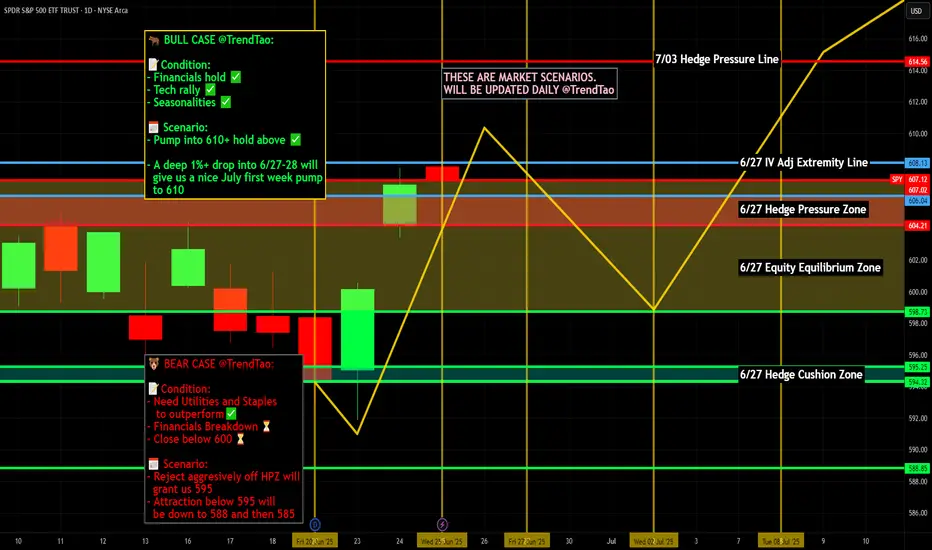
Nightly $SPY / $SPX Scenarios for June 26, 2025🔮 Nightly AMEX:SPY / SP:SPX Scenarios for June 26, 2025 🔮
🌍 Market-Moving News 🌍
💱 Dollar Mounts Decline on Fed Credibility Concerns
The U.S. dollar dropped to a 3½-year low against the euro after reports that President Trump is considering replacing Fed Chair Powell as early as September or October. The move fueled market concern about the Fed’s independence and prompted traders to raise the likelihood of a July rate cut to 25%, with nearly 64 bps of rate cuts priced in by year-end
📉 Markets Stay Cautious Ahead of Powell’s Testimony
Traders remain on edge as Fed Chair Powell’s Capitol Hill testimony continues. He reiterated caution, noting inflation risks tied to tariffs despite growing calls for easing, keeping interest-rate expectations in limbo .
📈 S&P 500 Nears All-Time Highs in Second-Biggest Bi‑Monthly Rally
The S&P 500 has notched its second-largest May–June rally on record (6.2% in May, further gains in June), bolstered by cooling inflation, easing Middle East tensions, and strong AI earnings momentum led by Nvidia. Bull-case scenarios could push the index to fresh highs
📊 Key Data Releases 📊
📅 Thursday, June 26:
(No major U.S. economic release—markets are focused on Powell’s remaining testimony and global risk dynamics.)
⚠️ Disclaimer:
This information is for educational and informational purposes only and should not be construed as financial advice. Always consult a licensed financial advisor before making investment decisions.
📌 #trading #stockmarket #economy #Fed #inflation #geopolitics #technicalanalysis
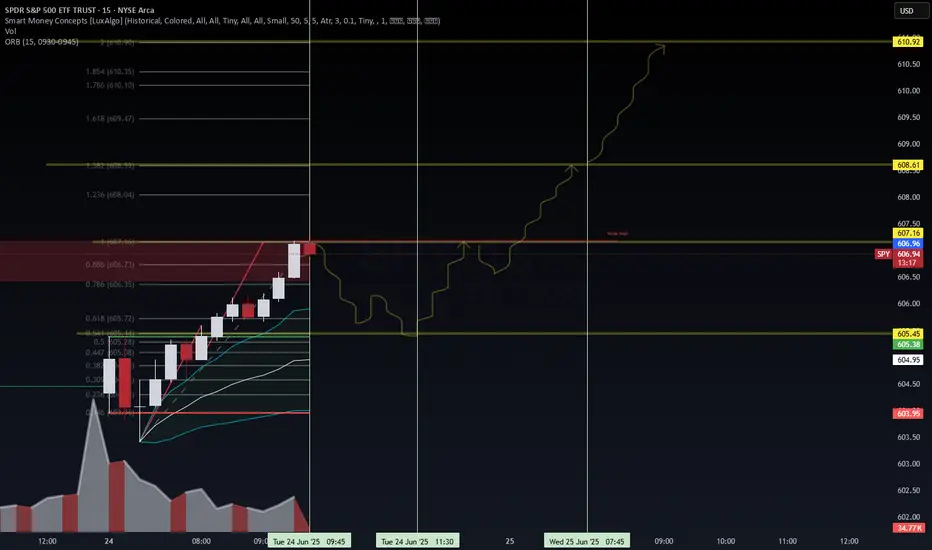
SPY 15-Min — Weak-High Sweep in Play• Discount BOS at 603.95 → impulsive leg to 606.7 (0.886)
• Weak high tagged at 607.16 – expecting continuation to 1.382 ≈ 608.61 then 1.854 ≈ 610.92
• Invalidation if price closes below 605.45 session VWAP band
• Targets: 608.61 → 610.92
• Risk: stop 604.9 (below 0.5 Fib)
VolanX bias remains risk-on while micro structure stair-steps above the 9-EMA channel.
Educational only – not financial advice
#SPY #SMP500 #OrderFlow #Fib #VolanX #WaverVanir
Monday UpdateSPX and SPY both look like they are trying to decide if the 18ma will hold as support or not, we have to wait for the close. Gold looks like it wants to go higher. Oil and Natural Gas as well. I forgot BTC, I'll do it tomorrow.

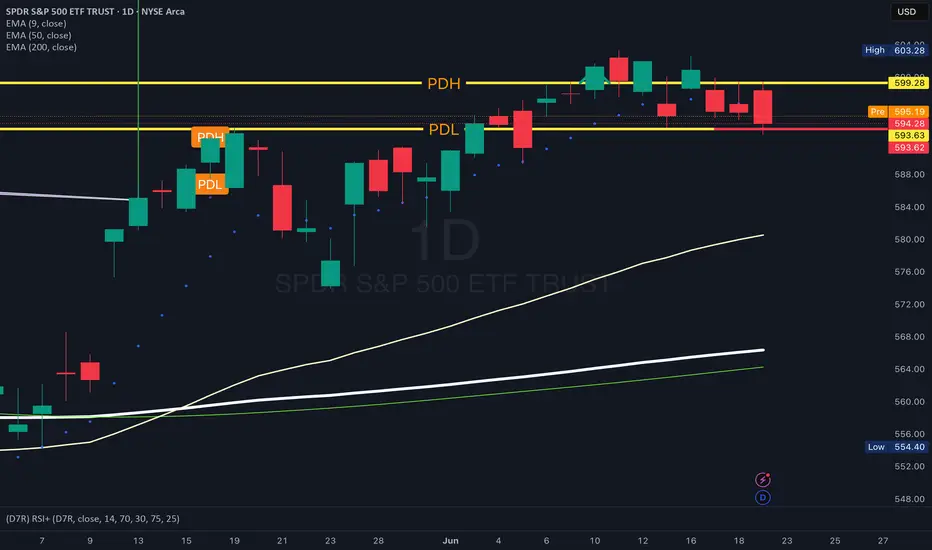
SPY- Premarket readPre-Market Read – June 23
AMEX:SPY
Premarket High: 595.15
Premarket Low: 592.15
Bias: Leaning Bearish
Price got rejected again at that 600–602 zone — that’s been a wall.
All the EMAs (9/50/200) are stacked tight, which usually means something’s brewing.
Institutions bought heavy down around 572–579 — they’re already green, so they might start selling into strength.
I’m expecting chop between 593–595 off the open.
I’ll probably wait out the first 15 min and let the ORB build.
If we break out, I’m watching both sides, but I lean put.
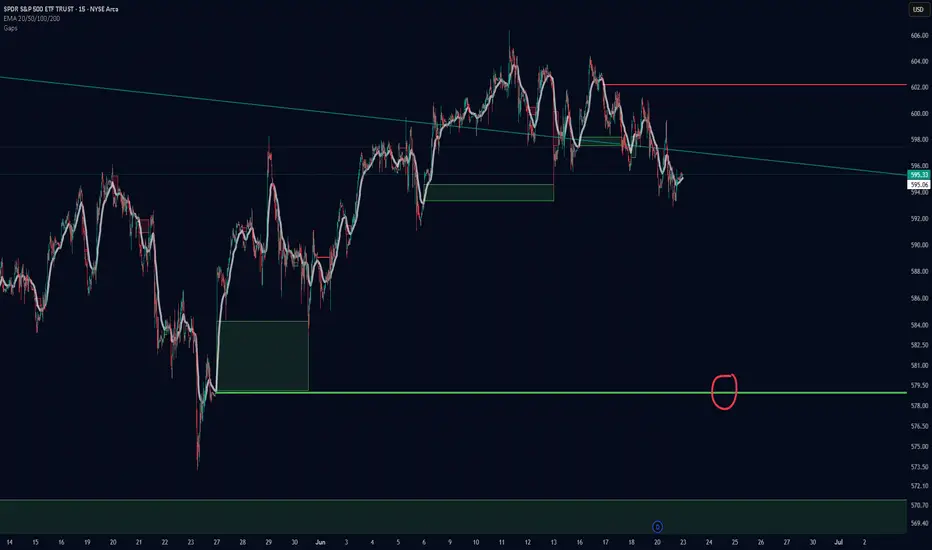
579 spy incoming?I posted this a week or so ago. I think we are finally going to have the momentum, or lack thereof, to make it down to fill the rest of that gap. I have noticed that large gaps that leave a small gap below(you must adjust the indicator to show it) almost always get filled before continuing up. This 579 level also matches up perfectly with the 20ema on the weekly which should provide further support. I will be looking for this level all week while being aware of any short squeezes that could occur on the way down. Will definitely go long at this 579 level as I think we will have a very green July.
Weekly $SPY / $SPX Scenarios for June 23–27, 2025🔮 Weekly AMEX:SPY / SP:SPX Scenarios for June 23–27, 2025 🔮
🌍 Market-Moving News 🌍
🌐 Geopolitics Add to Risk Aversion
The S&P 500 is up about 0.9% so far in June, but analysts warn it’s facing a “precarious” phase amid renewed Middle East conflict and looming U.S. tariff deadlines in July–August. Elevated oil prices could fuel inflation, while fiscal and debt ceiling pressures weigh on sentiment
🎙️ Powell Heads to Capitol Hill
Fed Chair Powell will testify before Congress this week. His remarks on inflation and rate outlook—particularly regarding the Fed’s recent dot-plot revisions and monetary policy uncertainty—will be central to market direction
📈 Nike, FedEx & Micron Earnings Under Focus
Key corporate earnings (Nike, FedEx, Micron) could provide fresh insight into how tariffs and supply-chain disruptions are impacting major U.S. businesses
🛢️ Oil Prices Elevated
Oil remains range-bound at multi-week highs near $75–80/bbl following U.S.–Israel military action in Iran, which briefly spiked prices ~7–11%. Continued dependence on Middle Eastern supply may keep energy complex volatile
⚖️ NATO Summit Tightens Security Focus
NATO leaders meet in The Hague, marking an elevated global defense posture amid geopolitical uncertainty. Defense and aerospace stocks may remain pressured or volatile depending on summit outcomes
📊 Key Data Releases & Events 📊
📅 Monday, June 23
9:45 AM ET: S&P Global Flash U.S. Services & Manufacturing PMI (June)
10:00 AM ET: Existing Home Sales (May)
📅 Tuesday, June 24
10:00 AM ET: Consumer Confidence Index (June)
Testimony: Fed Chair Jerome Powell appears before Congress
📅 Wednesday, June 25
10:00 AM ET: New Home Sales (May)
📅 Thursday, June 26
8:30 AM ET: Advance Q1 GDP (Final Estimate)
📅 Friday, June 27
8:30 AM ET: Core PCE Price Index (May) — Fed’s preferred inflation gauge
⚠️ Disclaimer:
This is for educational and informational purposes only. It does not constitute financial advice. Always consult a licensed financial advisor before investing.
📌 #trading #stockmarket #economy #geopolitics #Fed #oil #charting #technicalanalysis
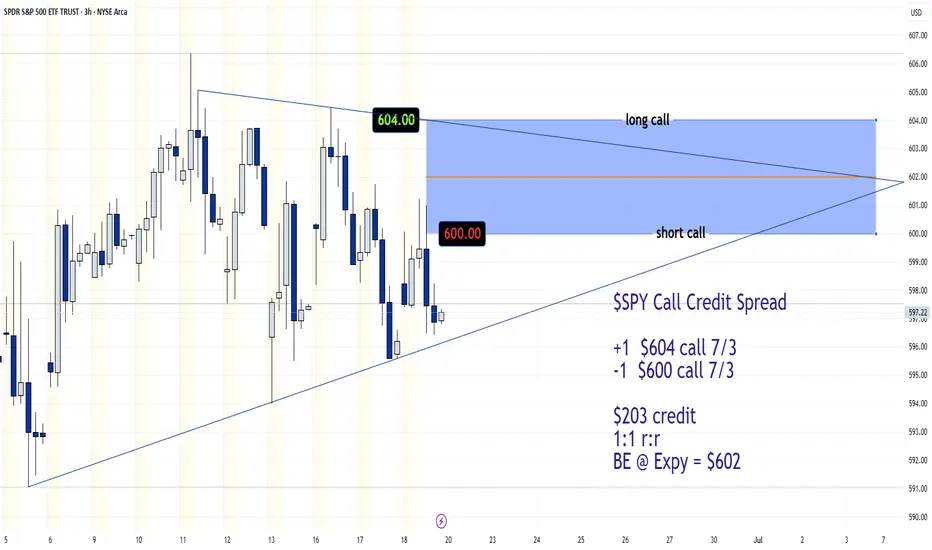
$SPY Call Credit Spread for 7/3 Expy IdeaAMEX:SPY Call Credit Spread
+1 $604 call 7/3
-1 $600 call 7/3
~$200 credit
1:1 risk:reward
Breakeven @ Expy = $602
We'll see...
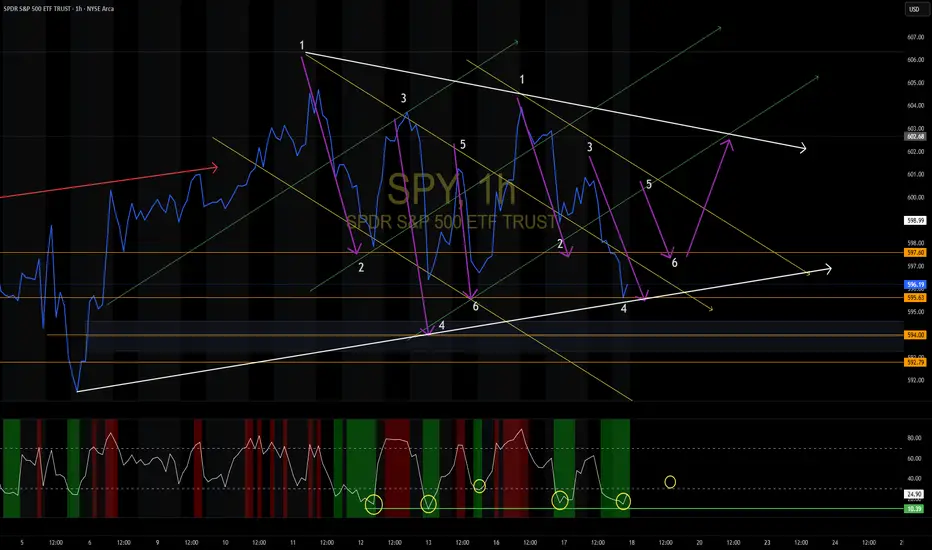
SPY repeating patternsSo just look at patterns that coincide with the RSI. Just keep an eye on the levels & channels & paly it smart
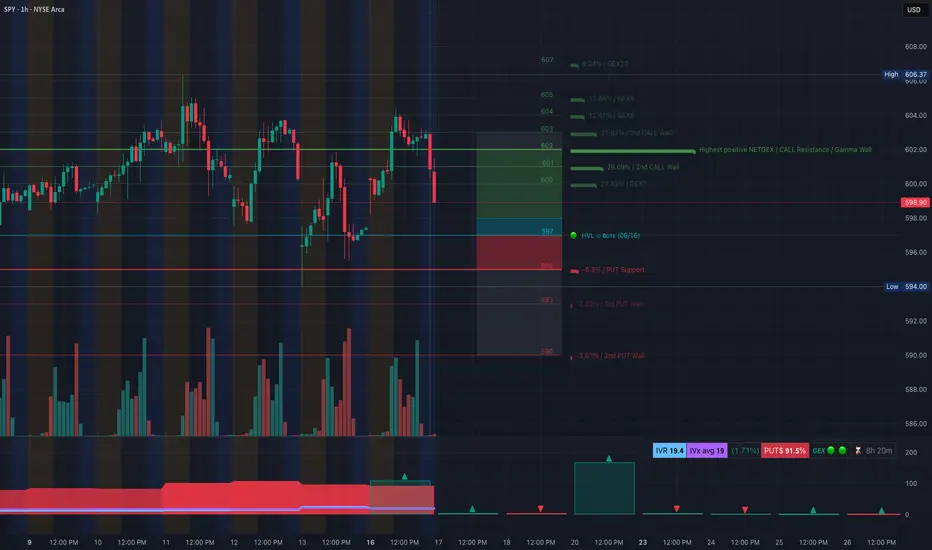
SPY Breaks Rising Wedge! Gamma Wall Rejected. Jun 17SPY Breaks Rising Wedge! Gamma Wall Rejected — Bearish Momentum Building Into OPEX 🔻
🔬 GEX (Gamma Exposure) Sentiment Breakdown:
* Gamma Resistance Above:
* Gamma Wall / Call Resistance: $602
* $603–$604.50 = additional CALL walls (2nd & 3rd tier resistance)
* $606.37 = Local high; unlikely to reclaim without macro tailwind
* PUT Walls / Downside Zones:
* $597 = HVL + Key Flip Level
* $595 = 1st Major PUT Support (Highest negative NET GEX)
* $593 / $590 = deeper GEX-supported flush zones
* Options Flow Metrics:
* IVR: 19.4 (slightly below avg)
* IVx avg: 19
* PUT Flow: 91.5% 🟥
* GEX Sentiment: 🔴🔴🔴 (Bearish dealer positioning + skewed delta exposure)
* Interpretation:
* Heavy call rejection at $602 combined with high PUT flow suggests dealers are short gamma.
* If SPY closes below $597, gamma exposure flips net negative — potential acceleration into $595/$593.
🧠 15-Minute SMC Breakdown:
* Current Price: $598.00
* Structure Overview:
* Clean rising wedge break
* Two CHoCHs confirmed at top → shift from bullish to bearish control
* Price broke into demand box (~$597–$598), testing support
* Volume spiked on breakdown = institutional participation confirmed
* Trend View:
* Uptrend is broken.
* Now entering potential distribution-to-downtrend transition phase
🧭 Trade Scenarios:
🟥 Bearish Breakdown Setup (High Probability):
* Trigger: Clean breakdown below $597
* Target 1: $595 (GEX Put wall)
* Target 2: $593 / $590
* Stop-loss: Above $600.50
Gamma flip + SMC structure shift supports downside. Dealer flows likely exacerbate drop under $597.
🟩 Bullish Reclaim Setup (Low Probability):
* Trigger: Reclaim of $602 with volume
* Target 1: $604.50
* Target 2: $606.50 (high)
* Stop-loss: Below $597.50
Only possible with major market strength, such as dovish Fed cues or macro catalysts.
📌 My Thoughts:
* SPY is showing signs of weakness across the board — structure, options flow, and volume confirm sellers stepping in.
* Put flows are extreme (>90%), so bounces may be brief and used to reload shorts.
* This is not a dip to buy blindly — best play is momentum PUTs under $597, tight risk control.
* Ideal setup for zero-day or 1DTE options trades with defined exits.
📉 Conclusion:
SPY failed to hold $602 Gamma Wall, rejected hard, and now tests $597 support. With options sentiment flipping negative and SMC structure breaking down, a drop to $595 or lower is increasingly likely.
Disclaimer: This analysis is for educational purposes only. Always manage risk and trade based on your plan.
S&P 500 OutlookS&P closed below the 9-EMA, showing there is weakness going into next week. Starting to build my watchlist when we get the bounce. If it closes back above the 9-EMA, then I'll start to look for entries.

Bearish Trend Starting SP500 SP:SPX AMEX:SPY Cannot Across 605 with MACD crossdown & RSI top lower
Last Support 593 If Breakthrough That Signal Confirm Complete Down Trend

Jeremy Chew SPY Notes 6/12/2025🧠 SPY (SPDR S&P 500 ETF) — Technical Summary
Chart Timeframe: Daily (1D)
Latest Close: ~$603.75
After-Hours Price: ~$595 (notable drop of ~1.45%)
🟩 Recent Price Action:
Strong rally off March/April lows (~458) has pushed SPY through major Fibonacci levels.
Sharp uptrend support (green line) has held since bottom, but is now being tested.
Today’s after-hours drop to $595 places price back below the 78.6% Fib retracement level (~587) — a potential warning sign of a reversal or short-term weakness.
🔍 Fibonacci Levels (from ~644 to ~458 swing):
Level Price Status
23.6% ~518.2 Support (cleared)
38.2% ~536.4 Support
50.0% ~551.4 Support
61.8% ~566.1 Support
78.6% ~587.2 Currently being tested
100% ~644 Major resistance
🔺 Support Levels (Key Areas to Watch):
~587.2: 78.6% Fib + Bollinger Band middle (critical support now at risk).
~566–568: Fib 61.8% + horizontal consolidation support.
~551: Fib 50%, secondary support if breakdown continues.
Green uptrend line: Dynamic support — near convergence zone with ~587.
🔻 Resistance Levels:
~603–606: Immediate resistance (price rejected here intraday).
~615–620: Horizontal price shelf from Feb highs.
~644: Major swing high from earlier in 2025.
📈 Bollinger Bands (20, 2):
Price was hugging the upper band earlier today — sign of bullish momentum.
After-hours dip to $595 pushes price toward the 20-day SMA (~593) — possible mean reversion or early correction forming.
📉 Volume & Momentum:
Volume during the rally has been moderate to low, suggesting limited conviction.
No major volume spike despite the recent breakout attempt.
If selling volume increases tomorrow, it may confirm a short-term bearish reversal.
⚠️ Interpretation:
The after-hours dip to $595 is a yellow flag. It:
Falls below the breakout level of ~603.
Threatens the 78.6% Fib (which is a typical exhaustion zone in retracements).
May break below the sharp uptrend support line, triggering profit-taking.
Short-term bias: Shifting from bullish to neutral/bearish unless it reclaims 603 quickly on volume.
🧭 Next Key Watchpoints:
Bulls want to see:
A bounce from ~593–587 zone.
A reclaim of 603 with strong volume.
Bears want to see:
Breakdown below 587 with follow-through.
Confirmation below trendline and push toward 566.
