SPX SPY Trading Range or BO? Daily Chart Analysis - 5 Mar 2025
• The market traded lower earlier in the day. The market then reversed higher for most of the day around noon time. The SPX then pulled back off its high in the final 30 minutes of the day.
• The bulls see the market trading in a broad bull channel and want the move to continue for months. They want an endless pullback bull trend.
• They want a retest of the all-time high (Dec 6) followed by a breakout and trend resumption. They see the current move as a bull leg within the trading range.
• They want a reversal from a double bottom bull flag (Jan 13 and Mar 4) and a wedge (Feb 25, Feb 28, and Mar 4).
• They hope the bottom of the 22-week trading range will act as support. They want a failed breakout below the January 13 low.
• At the least, they want a retest of the middle of the trading range (around the 20-day EMA).
• If the market trades lower, they want the November 4 or October 3 low to act as support.
• The bears got a reversal from a higher high major trend reversal, a wedge top (Dec 6, Jan 24, and Feb 19), and a smaller double top (Jan 24 and Feb 19).
• They see the market as being in a 22-week trading range.
• They hope to get a bear leg to retest the January 13 low followed by a breakout below. They got it yesterday (Mar 4).
• Next, the bears want a breakout below the January 13 low, followed by a measured move based on the height of the 22-week trading range.
• If the market trades higher, they want the bear trend line or the 20-day EMA to act as resistance.
• They want at least a small second leg sideways to down to retest the March 4 low.
• So far, the market is trading in a 22-week trading range.
• The SPX broke below the January 13 low yesterday (Mar 4) and traders want to see if there are any follow-through selling.
• Or will the market form a pullback, followed by a second leg sideways to down to retest the March 4 low after that?
• Traders may BLSH (Buy Low, Sell High) within the trading range until there is a breakout from either direction with follow-through buying/selling.
• The bears must create a strong breakout below the January 13 low with follow-through selling to convince traders a breakout could be underway.
SPY trade ideas
Nightly $SPY / $SPX Scenarios for March 5, 2025🔮 🔮
🌍 Market-Moving News 🌍:
🇨🇳📉 China's Manufacturing Activity Contracts 📉: China's official Manufacturing Purchasing Managers' Index (PMI) fell to 49.9 in February, down from 50.1 in January, indicating a contraction in manufacturing activity for the second consecutive month. This downturn raises concerns about global economic growth and could impact markets worldwide.
📊 Key Data Releases 📊:
📅 Wednesday, March 5:
📄 ADP National Employment Report (8:15 AM ET) 📄:
Forecast: +160K jobs
Previous: +183K jobs
This report provides a monthly snapshot of private-sector employment, offering insights into labor market trends ahead of the official government employment data.
🏢 ISM Services PMI (10:00 AM ET) 🏢:
Forecast: 53.0
Previous: 52.8
This index assesses the performance of the U.S. services sector. A reading above 50 indicates expansion, while below 50 signifies contraction.
🏭 Factory Orders (10:00 AM ET) 🏭:
Forecast: -0.5%
Previous: +1.2%
This report details the dollar level of new orders for both durable and non-durable goods, providing insight into manufacturing demand.
⚠️ Disclaimer: This information is for educational and informational purposes only and should not be construed as financial advice. Always consult with a professional financial advisor before making investment decisions.⚠️
📌 #trading #stockmarket #economy #news #trendtao #charting #technicalanalysis

S&P500: Reasons of DeclineThe S&P 500 has been experiencing a clear downtrend, characterized by a progression of lower highs and lower lows meaning that each attempt at a rebound is met with increased selling, preventing the market from establishing a meaningful recovery.
The current formation suggests that bearish sentiment is still dominant, with investors possibly looking for further downside support levels before a potential reversal. Until we see a shift in this downtrend structure, such as series a higher lows followed by a higher highs, the market is likely to remain under pressure. Another confirmation would be a breakout from line that connects ATH and 2 lower highs.
Main factors in play:
Geopolitical instability affecting investor confidence.
Tariffs and trade wars increasing costs for businesses and consumers.
Weakened global alliances leading to market uncertainty.
Rising economic risks impacting corporate earnings and economic growth expectations.
Protectionist policies can backfire
U.S. tariffs negatively impact the economy by increasing costs for businesses and consumers, disrupting trade relationships, and fueling economic uncertainty. Recent tariffs on imports from trading partners like Mexico and Canada raise prices on goods such as automobiles, energy, raw materials, and food, leading to inflationary pressures that hurt both companies and consumers. Businesses reliant on imported components face higher production costs, forcing them to either absorb the costs, reducing profitability, or pass them on to consumers, decreasing demand. Retaliatory tariffs from affected countries further compound the issue by making U.S. exports less competitive abroad, harming industries like agriculture, manufacturing, and technology. The threat of supply chain disruptions and escalating trade conflicts creates market volatility creating discouraging investment climate and prompting sell-offs in equities. Additionally, fears of a broader economic slowdown due to weakened global trade relations further erode investor confidence, contributing to stock market declines.
Impact of recent geopolitical shift
The S&P 500 likely fell in response to the geopolitical instability and uncertainty stemming from recent events. Investors tend to react negatively to signs of weakening U.S. leadership on the global stage, especially when it leads to disruptions in alliances and strategic partnerships that have historically provided economic and military stability. Seeing the U.S. aligning with autocracies while European and NATO allies are preparing for a future without American leadership introduces concerns about global security and long-term economic consequences. Furthermore, the perception that adversaries of free world may become more aggressive, potentially escalating conflicts, obviously adds to market anxieties. Investors fear that heightened geopolitical tensions could lead to disruptions in trade, energy markets, and global supply chains, all of which can negatively impact corporate earnings and economic growth. As a result, market participants likely sold off equities in favor of safer assets, leading to a decline in the S&P 500.
This demonstrates how political decisions can have far-reaching effects on financial markets and beyond.
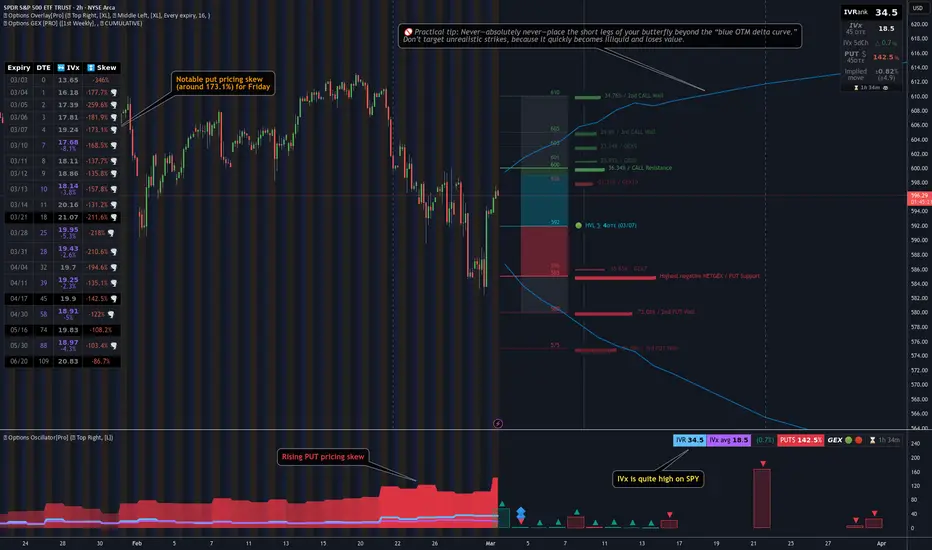
[03/03] SPY GEX Analysis (Until Friday Expiration)Overall Sentiment:
Currently, there’s a positive GEX sentiment, suggesting an optimistic start to the week following Friday’s bounce. However, the key Call resistance appears at 600, and it may not break on the first attempt. If optimism remains strong, there’s a chance SPY 0.09%↑ could still push above that zone after some initial back-and-forth.
🟢Upside Levels:
600–605 Zone: This is a major resistance area. Should SPY move decisively through 600/605, the next potential target could be 610.
610: This is currently the largest positive GEX zone for the week. Current option pricing suggests only about a 9% chance of closing at or above 610 by Friday, so it might require a particularly strong move to break through.
🔵 Transition Zone: Roughly 592–599. The gamma flip level is near 592, and staying above that keeps the market in a positive gamma range for now.
🔴 Downside Risk:
If 592 Fails (or HVL climbing up during the week, and after that HVL fails…): A drop could accelerate toward 585, which may act as the first take-profit zone for bears. Below that, 580 could be in play if selling intensifies.
Lower Support: 575 is the last strong support mentioned, but current option probabilities suggest about an 88% chance of finishing above that level, making a move below 575 less likely—though still possible given the higher put skew.
🟣Volatility & Skew:
IVR (Implied Volatility Rank) is quite high on SPY, with a notable put pricing skew (around 173.1%).
This heightened put skew indicates the market is pricing in faster, more volatile downward moves compared to upside.
S&P500 $SPY | SPY’s All-Time High - Where to Next? | Feb23'25S&P500 AMEX:SPY | SPY’s All-Time High - Where to Next? | Feb23'25
AMEX:SPY BUY/LONG ZONE (GREEN): $597.50 - $613.23
AMEX:SPY DO NOT TRADE/DNT ZONE (WHITE): $584.88 - $597.50
AMEX:SPY SELL/SHORT ZONE (RED): $574.00 - $584.88
AMEX:SPY Trends:
AMEX:SPY Weekly Trend: Bullish
AMEX:SPY Daily Trend: Bullish
AMEX:SPY 4H Trend: Bullish
AMEX:SPY 1H Trend: Bearish
AMEX:SPY just reached a new all-time high! How did price get there?
AMEX:SPY experienced a small range between 602.45 – 604.00, followed by bearish momentum, leading to a 3% drop in price. However, bullish momentum quickly stepped in, pushing the price up before continuing downward again. This bearish trend was short-lived and appears to have formed a developing range rather than a sustained downtrend.
Shortly after, price broke back above 597.50, signaling the start of a new bullish trend. SPY then established a ranging pattern between 597.50 - 608.00 before ultimately breaking out to a new all-time high of 613.23. Despite the breakout, price action has now dropped back into the range between 597.50 - 608.00.
Where to next? Will SPY hold its new highs, or is this the start of a reversal?
This is what I would personally look at before entering trades, everything is subject to change on a daily basis and as I analyze different timeframes and ideas.
ENTERTAINMENT PURPOSES ONLY, NOT FINANCIAL ADVICE!
trendanalysis, trendtrading, priceaction, priceactiontrading, technicalindicators, supportandresistance, rangebreakout, rangebreakdown, rangetrading, chartpatterntrading, chartpatterns, spy, sp500, s&p, fed, federalreserve, fedrate, AMEX:SPY , snp, snp500, usmarket, usmarkets, stockmarket, overallmarket, spyath, spyalltimehigh, all-time high, price action, bullish trend, bearish momentum, trading range, breakout, support and resistance, choppy market, untradable zone, stock market, technical analysis, market trends, price breakout, volatility, trend reversal, stock trading, SPY analysis, market momentum, trading strategy, sparros, sparrosexchange,

S&P - No surprise here! We were prepared! Now what? How can we get involved to the downside if we missed the initial dump? Well, here's how! Look out for guiding algorithms and keep in mind larger/higher time frame algorithms at play as well.
Even though we take the elevator down, you don't want to get stuck bagholding puts when a necessary pullback/liquidity build comes!
Happy Trading :)

broke long term trend. hold cashbroke long term trend. hold cash and buy when we hit the 236 line on the spy

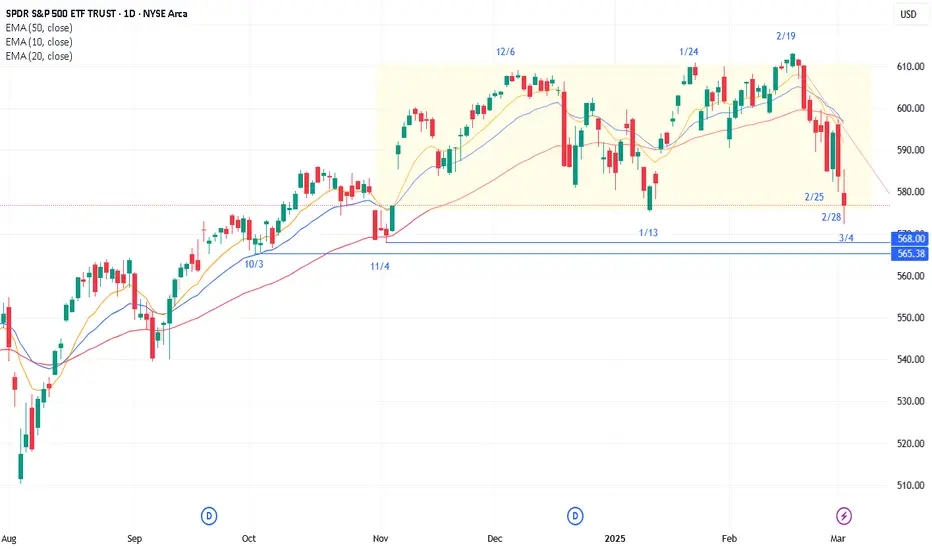
Time to Prepare | $SPY Options Bull & Bear Week 1 March 2025AMEX:SPY
Last week's AMEX:SPY $595 Put 3/10 ran for 66% from $480 up to $1,420.
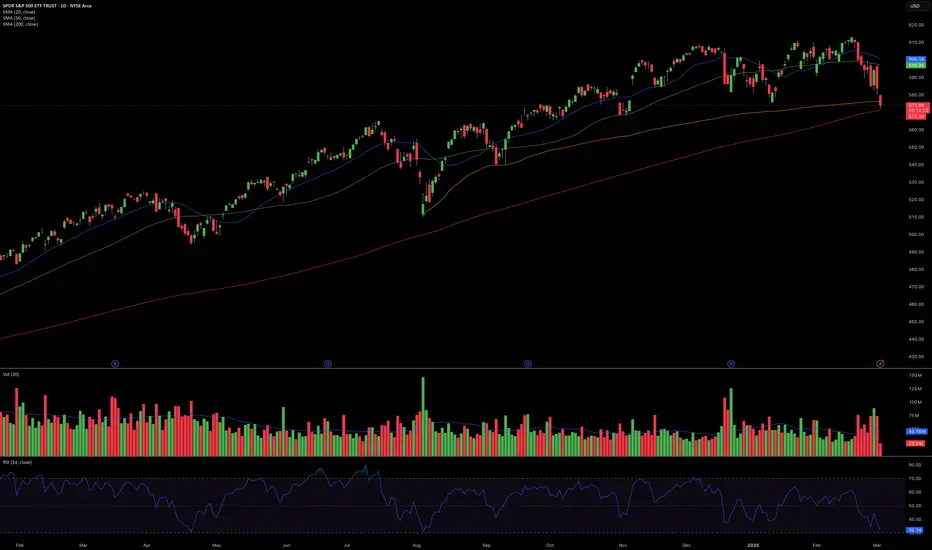
The last two weeks, the market has suffered a controlled pullback. So far it has been cautious selling rather than outright panic. While fear has entered the market, it has yet to reach capitulation, where there would be significantly more potential downside. The key level to watch long-term is the 200SMA on the daily chart, currently at $568.45. This level, which hasn't been tested in 16 months, could signal a Stage 4 selloff, a more aggressive and potentially prolonged downward trend.
Here are this week's AMEX:SPY Options:
(15-30 minute candle closes for confirmation and stop-loss)
📜 $580 PUT 3/17
Entry: Breakdown and failed retest of $584.50
Target 🎯 : $580, $574, $571
📜 $590 CALL 3/17
Confirmed breakout over $584.50
Target 🎯 : $590, $591.50, $594

$SPY March 4, 2024AMEX:SPY March 4, 2024
15 Minutes.
Yesterday retraced near 200 averages and fell.
So, for the fall 570 is the 1.618% extension which is possible as it is also 200 in daily.
For the day or tomorrow my target is 575 levels first.
If 575 is broken, we can go towards November lows.
586-588 is good level to short for the day.

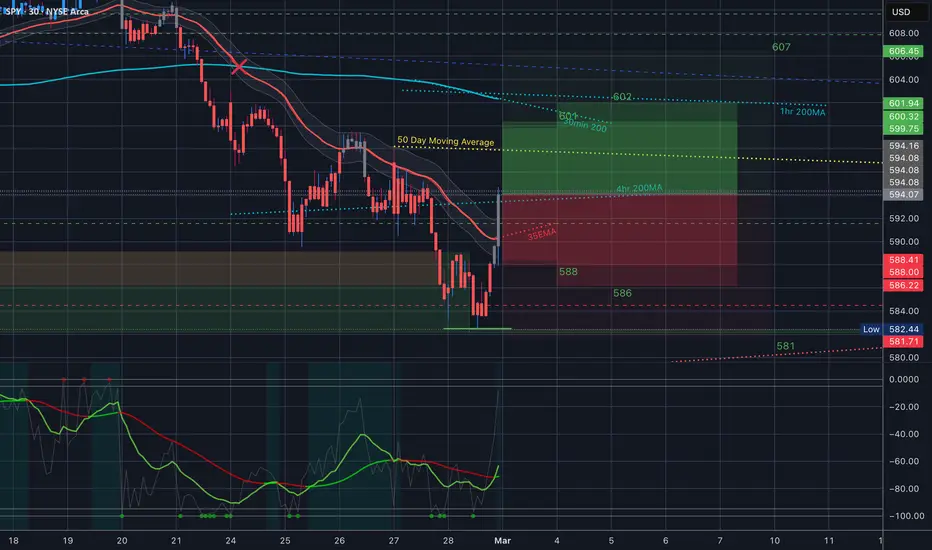
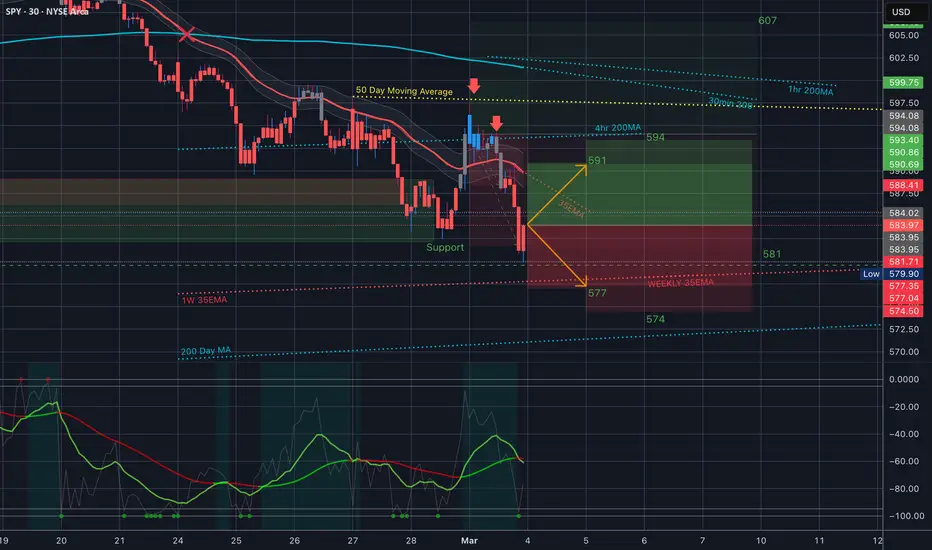
$SPY Analysis, Key Levels & Targets for March 4rd
We have to levels in tomorrow’s Trading range to be aware of -
1. The 1W 35EMA and that’s at the bottom of the trading range. Really important level to hold
2. And the 35EMA on the 30min timeframe.
That’s it in the trading range but of course you can see a lot around it and I went over it all in tonight’s video.
Gonna be a wild one - let’s go!!!
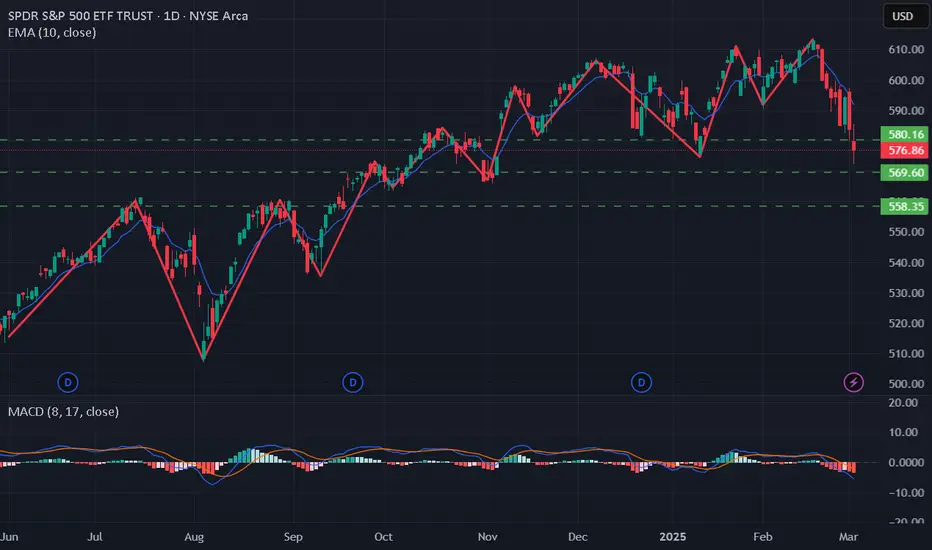
SPY at Critical Support! Reversal Incoming or More Downside? 📊 Technical Analysis (TA):
Trend & Structure:
SPY is in a clear downtrend, with multiple Break of Structure (BOS) signals confirming bearish dominance.
A recent Change of Character (ChoCH) attempt suggests a potential reversal, but confirmation is needed.
Key Resistance: ~598-610 (supply zone)
Support Zone: ~575-580 (current demand area)
Indicators Suggesting a Possible Reversal:
MACD: Showing signs of flattening, indicating potential momentum shift.
Stochastic RSI: Deeply oversold, increasing the likelihood of a short-term relief rally.
Volume Spike: Large volume at support, suggesting potential accumulation.
🔹 GEX & Options Flow:
Call Walls (Resistance) 🚧
610-615: Strong resistance area where gamma positioning is high.
620: Major call wall, indicating an upper limit if a strong rally occurs.
Put Walls (Support) 🛑
575: Highest negative NETGEX, meaning a break below this level could accelerate selling pressure.
570-560: Next major support levels if 575 fails.
IV Rank & Skew:
IVR 44.4, indicating mid-range implied volatility.
Puts are heavily favored at 112.2%, showing strong downside hedging.
Implied move ±0.33%, suggesting possible large swings.
📌 Trading Plan & Suggestions:
Bullish Reversal Scenario:
If SPY holds 580-585, we could see a bounce toward 598-610.
Ideal trade: April 590C or 600C, targeting a relief rally.
Bearish Breakdown Scenario:
If SPY loses 575, downside targets extend to 570-560.
Ideal Put Play: Buy March-April 580P or 570P, targeting 560.
⚠️ Key Warning: If SPY does not reclaim 590 quickly, expect continued selling pressure.
🔥 Conclusion: SPY at a Make-or-Break Level – Watch 575!
SPY is testing a key support zone with early reversal signals forming, but strong put positioning still favors downside risk. The next sessions will determine if bulls defend this zone or if we see another leg lower. Watch 575-580 closely before making a move! 🚀📉
🚨 Disclaimer:
This analysis is for educational purposes only and does not constitute financial advice. Always do your own research and trade responsibly.

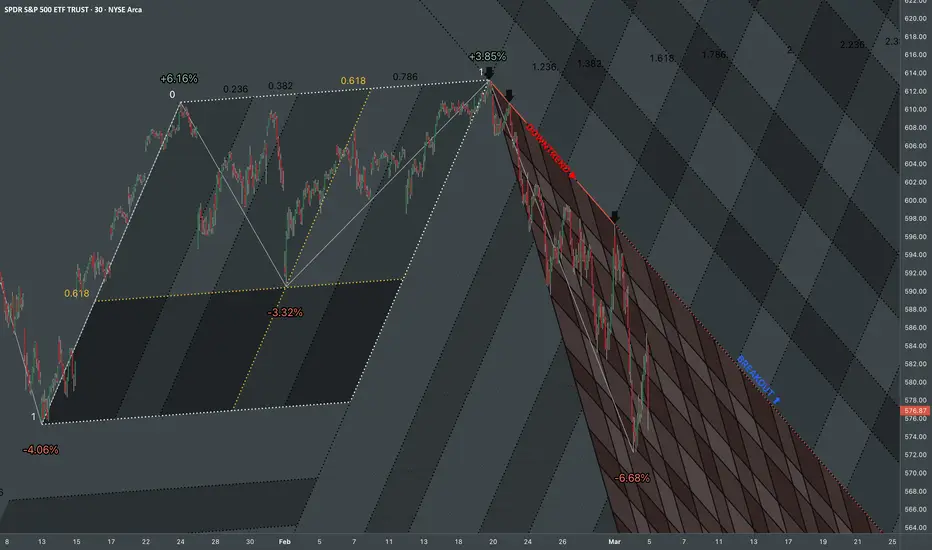
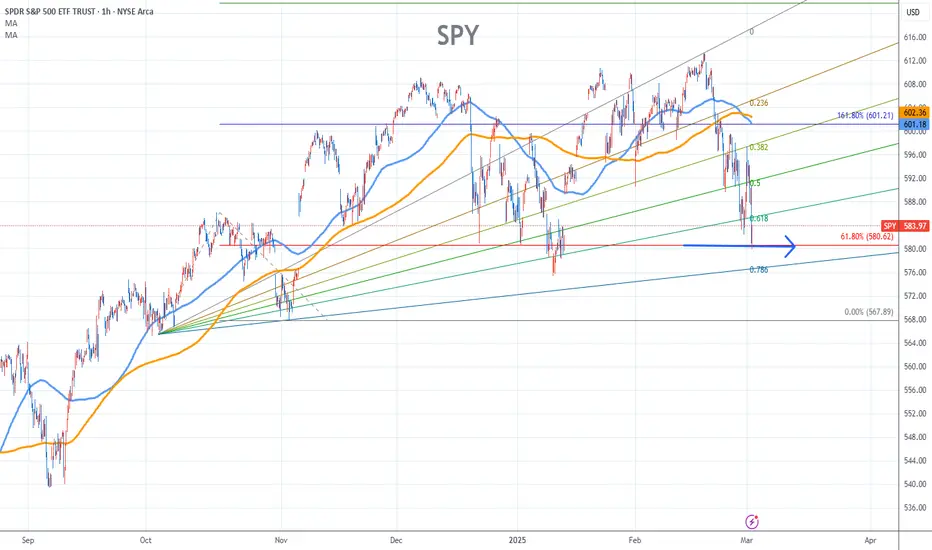
SPY Chart Fibonacci Analysis 030325Trading Idea
1) Find a FIBO slingshot
2) Check FIBO 61.80% level
3) Entry Point > 580/61.80%
Chart time frame: B
A) 15 min(1W-3M)
B) 1 hr(3M-6M)
C) 4 hr(6M-1year)
D) 1 day(1-3years)
Stock progress: C
A) Keep rising over 61.80% resistance
B) 61.80% resistance
C) 61.80% support
D) Hit the bottom
E) Hit the top
Stocks rise as they rise from support and fall from resistance. Our goal is to find a low support point and enter. It can be referred to as buying at the pullback point. The pullback point can be found with a Fibonacci extension of 61.80%. This is a step to find entry level. 1) Find a triangle (Fibonacci Speed Fan Line) that connects the high (resistance) and low (support) points of the stock in progress, where it is continuously expressed as a Slingshot, 2) and create a Fibonacci extension level for the first rising wave from the start point of slingshot pattern.
When the current price goes over 61.80% level , that can be a good entry point, especially if the SMA 100 and 200 curves are gathered together at 61.80%, it is a very good entry point.
As a great help, tradingview provides these Fibonacci speed fan lines and extension levels with ease. So if you use the Fibonacci fan line, the extension level, and the SMA 100/200 curve well, you can find an entry point for the stock market. At least you have to enter at this low point to avoid trading failure, and if you are skilled at entering this low point, with fibonacci6180 technique, your reading skill to chart will be greatly improved.
If you want to do day trading, please set the time frame to 5 minutes or 15 minutes, and you will see many of the low point of rising stocks.
If want to prefer long term range trading, you can set the time frame to 1 hr or 1 day.
Nightly $SPY / $SPX Scenarios for March 4, 2025 🔮🔮
🌍 Market-Moving News 🌍:
🇺🇸📈 Implementation of U.S. Tariffs 📈: Effective today, the United States has imposed a 25% tariff on imports from Canada and Mexico, and a 10% tariff on imports from China. These measures aim to address trade imbalances and protect domestic industries.
🇺🇸🏛️ Presidential Address to Congress 🏛️: President Donald Trump is scheduled to deliver his first address to Congress since his re-election, where he is expected to discuss the newly implemented tariffs and their anticipated impact on the U.S. economy.
investopedia.com
📊 Key Data Releases 📊:
📅 Tuesday, March 4:
🏛️ Treasury Auctions 🏛️:
8-Week Bill Auction (6:00 AM ET): The U.S. Department of the Treasury will auction 8-week bills, providing insights into short-term government borrowing costs.
17-Week Bill Auction (10:00 AM ET): A 17-week bill auction will also take place, offering additional perspective on investor demand for U.S. debt instruments.
4-Week Bill Auction (10:00 AM ET): The Treasury will auction 4-week bills, contributing to the understanding of immediate-term borrowing conditions.
⚠️ Disclaimer: This information is for educational and informational purposes only and should not be construed as financial advice. Always consult with a professional financial advisor before making investment decisions.⚠️
📌 #trading #stockmarket #economy #news #trendtao #charting #technicalanalysis


SPY/QQQ Plan Your Trade Update for 3-3-25 : Absolutely PerfectThis quick little update is for everyone who follows my research.
Today was absolutely PERFECT in terms of my expectations and how the SPY moved so far today.
A nearly perfect downward price trend targeting the 588 level.
Now, we'll see if we get a base and a squeeze higher before the end of trading today.
I'm so impressed with my ability to pinpoint these type of opportunities for everyone.
Remember, trading is about taking the opportunity to position your assets for gains.
Get some.
And please share your success stories if you have them.
#trading #research #investing #tradingalgos #tradingsignals #cycles #fibonacci #elliotwave #modelingsystems #stocks #bitcoin #btcusd #cryptos #spy #es #nq #gold

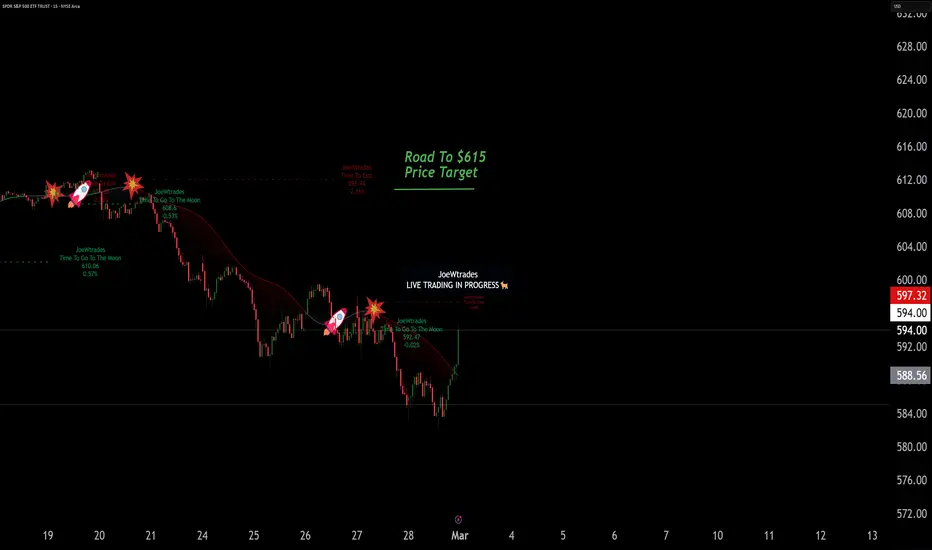
Spy $615 What? is it happening this is a short thesis road bk to $615 last time we were so close we hit $613 now my assessment is seeing Road back to $615 I do anticipate it open Monday around $598-$601 Max target we do have very strong support around 588ish which I don't think we see unless markets grab liquidity to wipe out calls and trap shorts Which is very common these Days.. I will Keep updating this is my personal thesis i think the correction is over and we are heading back to $615 Come Monday Morning Ill post and see what my bot foresees as well as my Price forecast to give an extra confidence boost on the thesis... as Always traders good luck and safe trades
SPY/QQQ Plan Your Trade For 3-3-25 : Up-Down-UP Pattern CounterToday's pattern, and Up-Down-Up in counter-trend mode, suggests the markets will attempt to move downward after the open and attempt to retrace some (or most) of Friday's gain.
I do believe this downward price move is essential for the markets to build a moderate base before attempting to move higher into the march 11-16 topping pattern my research suggests will prompt another breakdown in price.
Ultimately, these moves up and down over the past 30+ days are establishing a sideways (mega-phone type) price structure that I warned was likely to happen more than 90+ days ago (back in December 2024).
What we are seeing right now is a rolling of price while uncertainty continues to drive capital away from technology, semis and innovation - moving into safety and security.
This will continue until July or August 2025, then capital will suddenly shift back into risk-ON in my opinion.
By the time everyone thinks the markets are breaking downward (crashing), that is when I think the markets will make a sudden shift toward growth and innovation as the US resumes a growth phase in late 2025 (carrying into 2026).
Currently, we are in a minor little "pause/rally" phase after the last bout of selling. This rally will likely end sometime after March 11 - leading to a breakdown in price starting between 3-14 and 3-17.
This is a trader's market.
Gold/Silver appear to have found a footing and seem to be bouncing. We'll see if Gold/Silver move above critical resistance and continue to rally higher.
BTCUSD has rebounded back to support/resistance, but has also moved into a new DUAL Excess Phase Peak pattern that suggests increased price volatility for Bitcoin. I still believe we are moving into a very side-range consolidation pattern for Bitcoin.
I suggest staying fairly cautious today and setting up some trades for the pause/rally I expect to carry through this week for the SPY/QQQ. No need to get too greedy on a Monday.
Get some.
#trading #research #investing #tradingalgos #tradingsignals #cycles #fibonacci #elliotwave #modelingsystems #stocks #bitcoin #btcusd #cryptos #spy #es #nq #gold

$SPY March 3, 2025AMEX:SPY March 3, 2025
15 Minutes.
we had divergence in the last two LL at 583 and 582 levels.
For the rise 582.44 to 594.74 holding 591-592 is important for short term uptrend to continue.
For the fall 610.7 to 582.44 61.8% retracement is around 599 which is also 200 averages in 15 minutes.
Hence that is the first target for the day, holding 592.

Analyzing the S&P - Understanding algos on a fresh chartThis will be very helpful for those looking at a bare chart and are not certain how to proceed.
This is a somewhat advanced but also very basic walk through of how we can analyze the S&P and broader market in 10 minutes. I can do this for hours and get into way more detail as I do with my students but this will be a helpful refresher for those following my videos - which have already built in algorithms drawn - as to how to start from scratch and what all these lines mean.
Keep in mind however that I do not touch on creating and understanding supply & demand levels here which is a very important part of the confirmation process for actual trading.
Happy Trading all :)

Long SPY: Watch Key Levels for Recovery Next Week
- Key Insights: The SPY is showing signs of recovery after a substantial
decline, bouncing off critical support around $590. Maintaining above this
level is crucial for a bullish outlook. Traders should focus on the
resistance at $600, as surpassing this could ignite further upward momentum.
The external economic factors, including declining oil prices and
fluctuations in interest rates, are providing a supportive backdrop for
equities.
- Price Targets: Next week targets are set at T1=$620 and T2=$630. Stop levels
will be S1=$590 and S2=$583, providing a safety net for long positions while
aligning with current market conditions.
- Recent Performance: SPY recently faced a challenging period with six
consecutive days of decline, hitting lows around $585. However, in the last
sessions, it has rebounded over 1.5%, reflecting a shift in market sentiment
toward a more optimistic outlook.
- Expert Analysis: Analysts remain mixed on the pace of recovery, with some
expecting a V-shaped rebound toward $620 by March. The consensus is that
maintaining above vital support levels will be essential for sustaining
bullish sentiment, while any breach below $580 could trigger further market
pessimism.
- News Impact: The broader market dynamics are being significantly shaped by
external factors such as interest rates, which have recently declined from
4.5% to 4.23%. Additionally, falling oil prices under $70 a barrel are seen
as beneficial for reducing inflationary pressures, further adding to the
favorable environment for equities like SPY.

$SPY Analysis, Key Levels & Targets for March 3rd AMEX:SPY Analysis, Key Levels & Targets for March 3rd
Alright, y’all… I am still sick and still dealing with the fatigue so I’m not going to write a whole lot but here are the levels.
You know what to do with them… lol
And we will go over it all tonight.
Don’t forget to hit the “Grab this Chart” button under this chart is you want to use it.