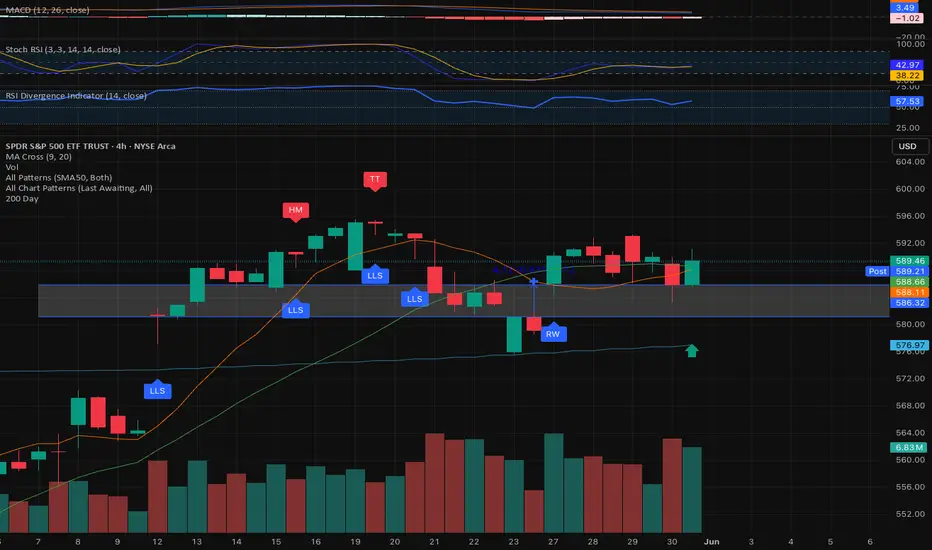
SPY dowsing roadmap for this weekI've been posting the weekly readings my dowsing has given for SPY's potential price movement the past couple months and it's really interesting.
I go week by week, but am starting to include each day of the week looking forward. I left on the chart the prior notations from those ideas I've posted & you can reference what I had versus what actually occurred.
This week is quite negative. I've had the number around $562-62 coming up for a while, & beyond that, around the $542-48 area as I recall. I don't really get any positive gain over last week's close.
We'll see what happens.
SPY trade ideas

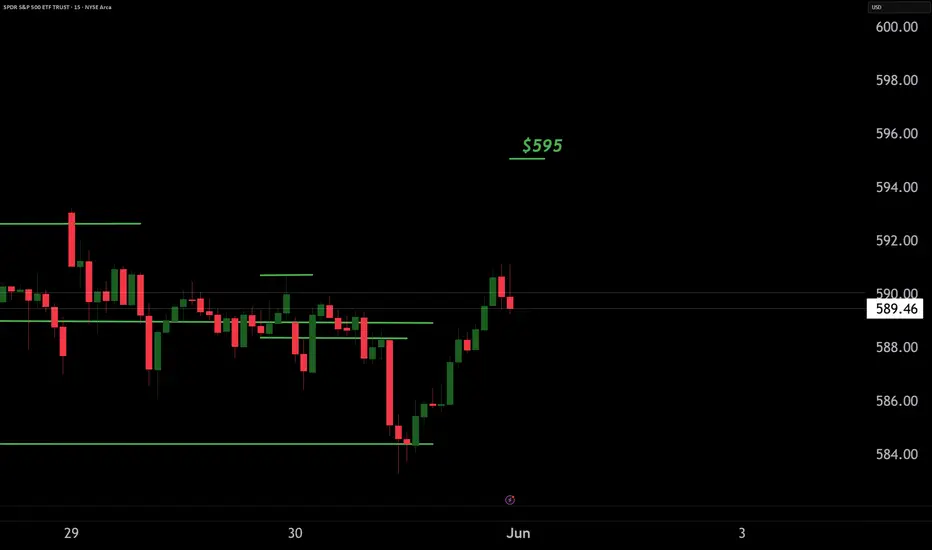
Spy Road To $600 🔥 SPY Price Thesis – Breakout or Breakdown Setup
SPY is setting up for a potential breakout above the $595 extension level, with upside to $602–$608. However, $582 remains a key support. A break below $582 could trigger a momentum flush to $567.
Level
🔵 $595.60 – Fib Extension (161.8%) from the March → April swing High-probability breakout trigger
🟢 $602.40 – $608.20 – Fib 200% and exhaustion zone from the same swing Final extension if bullish momentum sustains
🟡 $582.00 – Institutional VWAP reaccumulation zone Strong demand/support
🔴 $567.40 – Prior weekly pivot low + anchored VWAP bounce level Breakdown target if $582 fails
Trend Signal: Bullish bias confirmed — Higher Highs + EMA Cloud still pointing up
Momentum: MACD Histogram turning back up, crossover brewing
Volume: Above average on green days; no true distribution yet
Supertrend Zone: Still green on 4H and 1D
Custom Signal Confluence Score: > 75% (Strong Buy Zone aligning above $588)
🔁 Fibonacci Analysis
Measured from April swing low (~$505) to May high (~$573):
🔹 161.8% = $595.60
🔹 200% = $602.40
🔹 261.8% = $608.20 (max extension target)
📉 On Breakdown:
From $573 high to $558 retracement low:
0.618 retrace = $582.00 ← Current support zone
Full retrace & bear trap zone = $567.40
Smart Money Strategy:
Above $595: Long breakout entries (Calls, zero DTE)
Below $582: Hedge with Puts or inverse ETF
Key Catalyst Triggers: Jobs data, CPI, or Fed commentary could force the move
As Always Safe Trades and JoeWtrades
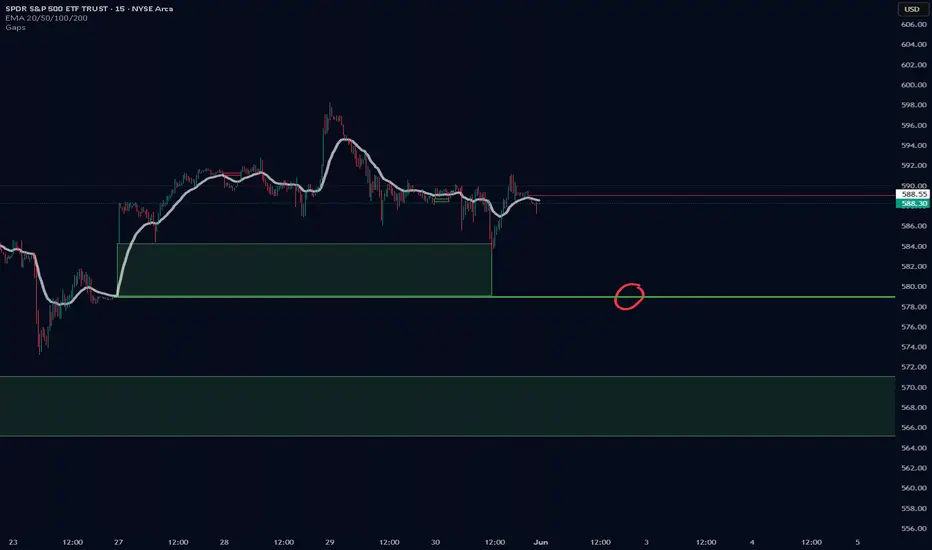
579 gap will be filled.Happens all the time. Chart shows an incredibly large gap. if you lower the deviation on your gap indicator a small gap can appear below this very large gap. i have seen on numerous... NUMEROUS occasions when this gap gets filled and then has a nice rebound(not necessarily sustained). I don't know if it will happen tomorrow, but if there starts to be a sustained selloff in the days ahead i will feel confident that this is the target. 579 is the price. again, it could happen on monday or it could happen next monday. i have no idea what the market is going to do from day to day, but keep this level in mind.
$spyyieahhh
Back after getting crushed last 2 months, but hey at least we are having fun 'they say'.
Interesting set of patterns. long term uptrend. Looking at a dip to 563 over next month hopefully.
Bunch of confluences there:
1. High volume at 560 (there's a volume gap right below 585 which would make this a quick move down.
2. Mid point of the long term parallel channel.
3. 61% fib of entire move down.
You would expect next long term target to be the upper test of the channel, 620s. Let's see how this move down, if we have any goes. Yieahhhh

SPY Trapped in Gamma – Big Move Loading or Just Dealer Chop?
📊 SPY GEX Daily (Options Sentiment Breakdown)
SPY closed at $589.39, and we’re now seeing tight compression between call resistance at 592–595 and heavy put walls down at 586 and 580. Gamma is stacked on both sides — a dealer tug-of-war. Unless we break cleanly above or below this zone, expect whipsaw chop.
GEX Breakdown:
🟩 Call wall at 595, with strong dealer hedging from 592 up to 600.
🟥 Massive negative GEX starting at 586 → 580 → 575, all with dense put walls (–79.88% at PUT Support).
🔻 IVR is 18 and falling – nobody’s paying up for protection yet, but things could move fast once they do.
💡 Options Playbook (Based on GEX):
Neutral-to-Bearish: Fade pops near 592–595, use 595c/600c credit spread or play 585p/575p vertical if 586 breaks.
Bullish Flip: If we break and hold over 595, gamma flips positive fast → play Jul 19 600c or 595/605 spread.
This is a gamma box — price likely stuck 586–595 unless volume shifts dealer hedging or macro breaks out.
🕵️♂️ 1H Price Structure (Swing & Intraday Planning)
SPY 1H still showing weak structure. Multiple CHoCHs and BOSs bouncing around the same zone. Price got rejected from the purple supply at 592, and is now hovering around 589–590, still trapped under a descending trendline.
What stands out:
📉 Structure = lower highs + broken BOS → short-term bearish.
📦 Supply pressure between 590.5–593.9, demand sits down at 573–576.
💣 Bearish readings across BBP, MACD, Stoch — and market breadth thinning.
📈 Swing Bias:
Short under 590–592 → target 586 first, then 580 if momentum kicks in.
Bullish case only resumes on clean break above 595.
📊 Intraday Plan:
Fade pop to 590.5–592 for scalp short (look for lower highs).
Bounce off 586 is playable for scalp long — but keep stops tight.
Until SPY breaks out of this gamma trap, you want to scalp or spread trade with discipline. No need to swing for home runs here.
🧠 Final Thoughts
SPY is pinned between high call resistance and aggressive put support. The GEX box says: "Be patient or get chopped." We need either macro news or volume spike to break the hedging stalemate. IV is low, so positioning ahead of a breakout (via spreads or small directional bets) could pay off — just manage size tightly.
⚠️ Disclaimer:
This is educational commentary only. Always manage your own risk, and never trade based on someone else’s analysis alone.

SPY Weekly Options Outlook — June 1, 2025📉 SPY Weekly Options Outlook — June 1, 2025
🚨 AI Model Consensus: Moderately Bearish into June 6 Expiry
🧠 AI Model Breakdown
🔹 Grok (xAI)
Bias: Moderately Bearish
Technical: Price below 10-EMA, RSI cooling, MACD divergence.
Trade: Buy $589P @ $4.72 → PT +50%, SL if SPY > $591
🔹 Claude (Anthropic)
Bias: Moderately Bearish
Technical: Short-term cooling, daily trend still intact.
Trade: Buy $573P @ $0.94 → PT 100%, SL 50%, exit by Wed
🔹 Gemini (Google)
Bias: Neutral
Technical: M5 bearish, daily bullish = mixed.
Trade: No trade today due to inconclusive bias
🔹 Llama (Meta)
Bias: Slightly Bullish
Technical: M5 bullish EMAs, daily MACD bearish
Trade: Buy $590C @ $5.20 → PT +20%, SL −50%
🔹 DeepSeek
Bias: Moderately Bearish
Technical: Breakdown below support, MACD/RSI bearish
Trade: Buy $588P @ $4.27 → PT near $585, SL at $590.50
✅ Consensus Takeaways
4 of 5 models favor bearish or moderately bearish direction
Max Pain at $585 = common gravitational level
Momentum showing weakness, especially intraday
Only Llama sees upside bias; Gemini stays out due to signal conflict
🎯 Recommended Trade Setup
💡 Strategy: Bearish Naked Weekly Put
🔘 Ticker: SPY
📉 Direction: PUT
🎯 Strike: $588
💵 Entry: $4.32 (ask)
🎯 Profit Target: $6.00 (+39%)
🛑 Stop Loss: $2.16 (−50%)
📏 Size: 1 contract
📅 Expiry: 2025-06-06
⏰ Entry Timing: Market Open
📈 Confidence: 70%
⚠️ Key Risks to Monitor
⚖️ Daily uptrend still intact — bounce possible at support
📉 Low VIX = limited volatility expansion (slower premium growth)
🔺 Watch for quick reversals or news spikes above $590 that can hit stop-loss
⌛ Theta ramps midweek — trade must move early
📊 TRADE DETAILS (JSON)
json
Copy
Edit
{
"instrument": "SPY",
"direction": "put",
"strike": 588.0,
"expiry": "2025-06-06",
"confidence": 0.70,
"profit_target": 6.00,
"stop_loss": 2.16,
"size": 1,
"entry_price": 4.32,
"entry_timing": "open",
"signal_publish_time": "2025-06-02 09:30:00 UTC-04:00"
}

SPY: New Month of June! :O Hey everyone,
Entering a new month, how exciting.
Hope you all had a great weekend and have a great week ahead!
As always, safe trades and take care!

Bullish on SPY!What I have understand is that market negatively reacts to Tariff implementation. This is the market sentiment.
Since Tariffs have been paused, cut off, or delayed to another time. Most courts are suspending the Trump Tariff.
Market has been behaving positively, It has also broken the previous small resistance at the price $575. And has also retracement. If you put moving average of 10, you can see it has retested below level but closes above the MA which is a good signal.
I believe SPY will touch $607 within 2 weeks from now, and hopefully a fundamental news will break the $610 level.
And it is common sense if SPY moves rapidly upwards, almost all of the SP500 companies will go up ( not all).
And I think buying stocks that are already at the high resistance level is good if what I think will happen.

Here's what we've got going into next weekSo here's what I see going into next week, The SPY is in a tight little area and what that means is expect extreme volatility, we break to the downside were heading to the gap, if we break to the upside we're going to new all time highs, my bias is to the down side because we've got a lot of bad news coming in especially with China Looking at Taiwan, also it seems market sentiment Is to the downside, but darn it this thing still keeps climbing higher. I'm going to be going short and buying put options,,this is in my opinion, and what I am doing for myself,, you do you, do your own analysis and research. I blame no one for my mistakes, Even though I would like to, but nobody makes me buy or sell, I am the one that must enter that order and I take responsibility for my actions, I have come to learn that I am gifted with making money on the short term scalping markets, but will quickly become a loss because I hold on longer, my education has costed me thousands and thousands of dollars over the decades, And I am still learning, Praise be to God.

Stock Market Forecast | TSLA NVDA AAPL AMZN META MSFTStock Market Forecast | CME_MINI:NQ1! CME_MINI:ES1! SPY QQQ
Mag 7 Forecast | NASDAQ:TSLA NASDAQ:NVDA AAPL AMZN META MSFT GOOGL

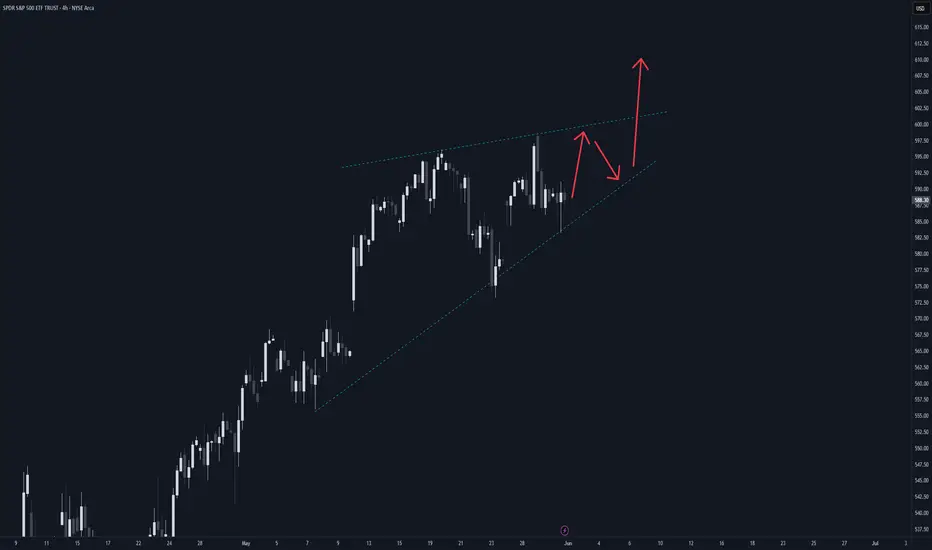
SPY to touch 600 soon Looks like it's in a large rising wedge, which should resolve upwards imho
Yesterday was another buy the dip moment, as bulls defended a break below 583 and rallied all the way up to the 591 level.
A break above 600 which lead to explosive price action which may or may not happen, however 600 is a strong psychological resistance. We will see how this pattern develops...
BREAKING $SPY Ultra Rare Holy GrailBREAKING AMEX:SPY Ultra Rare Holy Grail
Inside week trap is here a massive breakout is coming!
The key is to watch the futures open all will be alerted here on TV no charge
Low risk high reward setups only ill share it all going for 6 figures
All I ask is drop a 👍

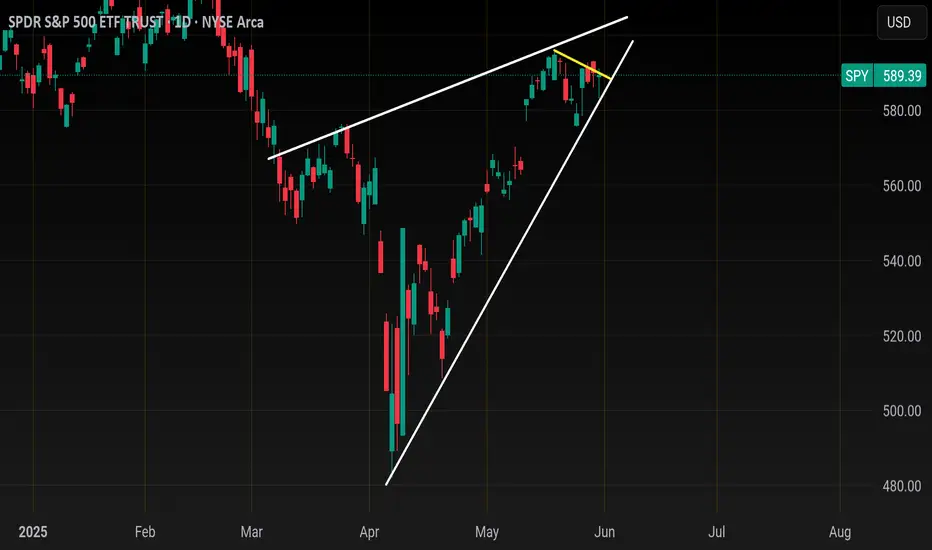
SPY (S&P 500 ETF) – Fibonacci Reversal + Bullish Continuation SeThis chart highlights a potential retracement zone before a major continuation leg to the upside, based on Fibonacci levels and price structure.
📊 Technical Breakdown
Current Price: $589.39
Recent High: $595.54 (Fibonacci 1.0)
Key Fibonacci Levels:
0.618 → $562.28 (First retracement target)
0.5 → $555.57
0.382 → $547.38
Critical Support: $552.15 (confluence with historical demand & fib zone)
Projected Target (1.382 Fib Extension): $629.02
🧠 Probabilistic Interpretation
🔻 Short-term pullback toward $552.15 = 60% probability based on multiple rejections from 0.886/1.0 Fib zones.
🔼 Continuation to $629.02 = 70% probability if price finds support at golden ratio (0.618) or 0.5 zone.
🧠 Structure favors smart money re-accumulation after engineered liquidity grab.
🌐 Macro Context (as of May 31, 2025)
Fed Watch: Market pricing in 70% chance of no rate cut in June. July data will be crucial.
VIX: Suppressed, but starting to rise—indicative of market hedging short-term volatility.
Earnings season: Mixed signals—AI sector outperforms while cyclicals lag.
🚨 Trade Plan for Professionals
Watch for price action near $555–552.
Enter long upon bullish engulfing or SMC confirmation at demand zone.
First TP: $595.50
Final TP: $628.80–$629.02
SL: Below $541.72 (Fib 0.382)
🧠 Final Note
This chart reflects a classic Fibonacci retracement & extension structure that institutional traders often monitor. Aligns with DSS and WaverVanir’s discretionary outlook.
#SPY #SMP500 #FibLevels #SmartMoney #LiquiditySweep #WaverVanir #TechnicalAnalysis #FibonacciTrading #TradingView

SpyGoing over
Spy
Dow jones
NYA
I'll keep this mostly cylicals and broader market.. I've written up a qqq post where I cover most tech indexes..
Let's start with NYSE or TVC:NYA
This covers 3000 stocks.. you ever read about weak breadth in the market? Well when ever this is Lagging behind nasdaq and the market is being dragged along by 6 tech stocks then that's what it means.
Ok so last week when the Spy dumped from 595 to 575 in 2 days, a big part of that was NYA ran into a brick wall here at 20,000 as you can see. Add to that price had formed a rising wedge from the melt up from April lows..
So price rejected at 20,000 on NYA but bounced at its 200sma similar to Spy at 575 which let's you know how connected the 2 are
So now we go into this week here literally 1% away from that same resistance.. Nothing moves NYA and IWM more than the monthly jobs, this is because Job numbers reflect economic strength and a weaker economy will impact Cylicals and small caps the most ..
I don't think we break above that trendline resistance, too much uncertainty around Tariffs, Also here's the weekly RSI on NYA dating back 2yrs
At resistance and divergent... I think we break below the 200sma this week Either with Wed ADP or Friday nonfarm payrolls..
Usually to get below the 200sma it takes a GAP down so that's why I think the action takes place pre market on some data.
TVC:DJI
Dow jones
I'm conflicted a little here.
Price is stuck below trendline resistance and 200ma
But price is also showing a possible bullish H&S inside a Pennant.
Dow jones would only be bullish above 43,000..
As you can see there is not anymore room fawk around.. price will break in either direction come next week..
I'm leaning to the bearish side here but things only get seriously bearish back below 40,000 because that would put it back inside that April box
2 of the sectors that really moves the dow is Financials and Health
Look at this XLF weekly chart
Price is distributing at a 15yr resistance
Zoomed in
Looks like a 2022 repeat about to happen as early as this fall
The position XLF is in makes me doubt Financials will lend a boosting hand here .
XLV - health care on the other hand looks really bullish short term
Daily channel shows a 7% upside to channel top
Daily rsi showing bullish Divergence
So health could offset some of the dow losses but not enough if tech and Financials rollover.
Lastly my number one reason I'm bearish on the dow is DJT or dow jones transportation
Weekly candle stuck below 15,000, trendline resistance , 20 and 200ma.
Seasonality June and July is bullish for DJT because of the traveling but if they can't break above this area in the middle of its best seasonality then nothing is safe
Lastly Spy
ALWAYS KNOW WHERE YOUR MOVING AVERAGES ARE BEFORE YOU TAKE A TRADE!
Me personally I only use 20,50,200.. EMA and SMA.
I say this because the area of spy 572-577 has a powering of moving averages on both weekly and daily time frames
If spy breaks below 570 then we are headed straight for this box.
547-550
Below that and it's death for the bulls.. if it bounces there then we'll see what happens
Weekly RSI same as NYA .. at resistance
So here's a 4 hr chart..
As you can see, rising wedge..
But pay attention to the yellow trendline resistance. That range is 590-584..
A open below 582 and it's a short to 575..
A open above 593 and it's one last long to 600 before the big short
585-592 is choppy and I wouldn't trade it
Like I said earlier, you normally never see price intra day slide below the daily 200sma .. so if they are going to break below 575 this week ( I believe) then they will do it pre market.
I don't think this week will be all doom and gloom. Why? Because of NQ 4hr moneyflow.. it's gotten too oversold so they are likely to have a tech pop this week probably Tues or wed which I think will be your opportunity to position short

$SPY demand zone: Chinese+Canada+Mexican tariffsDaily SPY demand zone is $581-$586, lots of buys within that range. We´d need a major and negative catalyst to break lower than that, especially with the daily 200ma @$577.
Worsening China tariff and regressive trade news next week to push SPY to it´s $577 200 MA or at least some positive news from the Canadian and Mexican pause ending June 9th to at least continue to hold us at the higher end of the range ?
GAP Fill on the table. We going lower according to the DSSDSS predicted the right moment in time. Time series analysis combined with my technical insight could be my edge that's working right now.

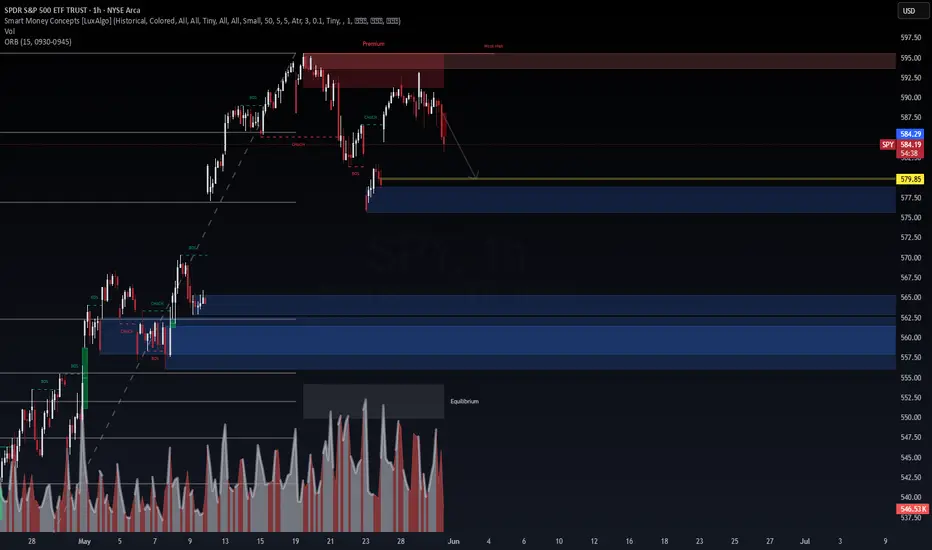
SPY Breakdown Watch – Smart Money Concepts (1H Chart)🔎 Chart: SPY | TradingView 1H
At Wavervanir International LLC, our discretionary analysis on SPY (S&P 500 ETF) using SMC + ORB logic is signaling potential downside.
🔍 Market Structure:
CHoCH (Change of Character) confirmed after BOS (Break of Structure), suggesting buyer exhaustion.
Premium zone rejection with multiple failed attempts to reclaim the weak high.
Liquidity has shifted toward discount zones, aligning with volume imbalance and OB zones below.
🎯 Target Zones:
Immediate liquidity pool: 579.85
Demand block confluence: 575–565 zone
Deep mitigation OB: 560–557.50 zone
📊 Macro Context:
Bond volatility rising (MOVE index)
Fed holding rates steady, inflation stickiness remains
Liquidity tightening into quarter-end
🧠 Strategic View:
SPY looks poised to fill inefficiencies into the 575–565 range unless macro tailwinds emerge. Volume supports this as market seeks equilibrium post-premium rejection.
SPY: Maybe today we could see this. Just a random thought and analysis. Would be fun if we see this waterfall today.

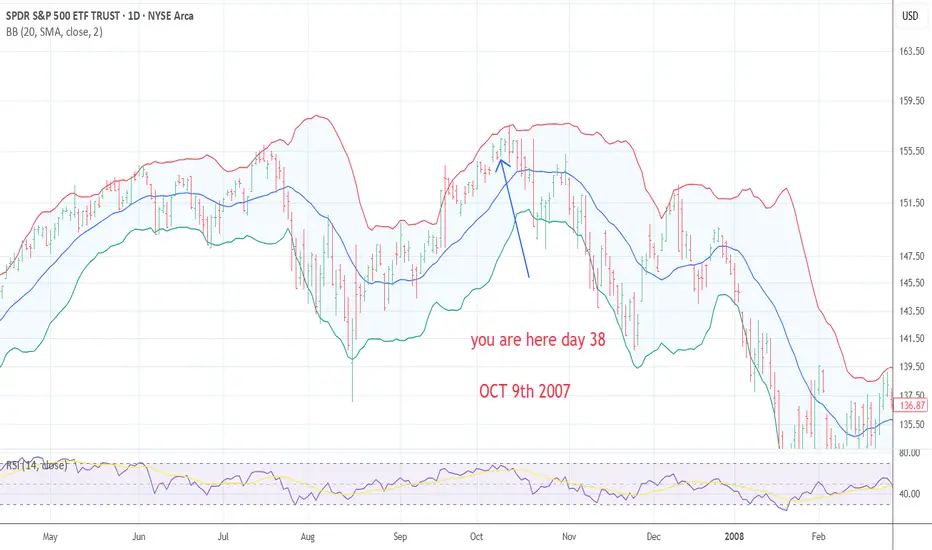
2007 Top /2025 day 38td t-minus 2.5 days Major TOP The chart in focus is the 2007 chart we are now day 38 in the pattern and in 2007 we took 40td to make a new high And I have posted my models .I see the next rally to reach anywhere from 6035/on the low end to 6177 on the high end focus 6147 where Ax 1.618 = wave C or 3 Best of trades WAVETIMER
Opening (IRA): SPY September 19th 500 Short Put... for a 5.02 credit.
Comments: Adding at intervals at strikes better than what I currently have on, targeting the <16 delta strike paying around 1% of the strike price in credit. Will look to manage positions as I come to them.

$SPY // May 30 2025 // Analysis & Targets for Day TradersAMEX:SPY // May 30 2025 // Analysis & Targets for Day Traders

SPY/QQQ Plan Your Trade for 5-30 : CRUSH PatternToday's CRUSH pattern should result in a continued downward price trend in my analysis is accurate. I have seen CRUSH pattern trend upward sometimes. So, please understand I'm reading the chart and pattern as a rolling top type of pattern leading to a CRUSH (downward) price trend today.
I highlight the potential for a FAILED CRUSH (downward) price bar - whereas a reversion back to the upside is a potential. But, I estimate that potential at only 20-25% at this time.
My analysis suggests the breakdown in price will likely continue, and we'll likely see the SPY/QQQ/Bitcoin continue to try to trend downward.
Gold and Silver are moving into a fairly solid Gap-Stall-Revert-Flush pattern that may see Gold attempt to rally back above $3400 today. Silver is currently trading very close to a STDDEV Reversion level, so Silver may not see a big move today (like Gold).
I'm hopeful we start to see a big breakaway move in Gold/Silver today and carry into next week.
My TTScanner algos generated new BUY triggers for GDX, GDXJ, and NUGT yesterday. That's a very good sign we are getting into a BUY/BULLISH mode in metals again.
I got up late today. Somehow, my alarms got turned off.
Happy Friday.
Get some.
#trading #research #investing #tradingalgos #tradingsignals #cycles #fibonacci #elliotwave #modelingsystems #stocks #bitcoin #btcusd #cryptos #spy #gold #nq #investing #trading #spytrading #spymarket #tradingmarket #stockmarket #silver
