Bullish Setup Suggests Rally Towards $350 Zone
- T1 = $340.00
- T2 = $350.00
Stop Levels:
- S1 = $315.00
- S2 = $310.00
**Wisdom of Professional Traders:**
This analysis synthesizes insights from thousands of professional traders and market experts, leveraging collective intelligence to identify high-probability trade setups. The wisdom of crowds principle suggests that aggregated market perspectives from experienced professionals often outperform individual forecasts, reducing cognitive biases and highlighting consensus opportunities in Tesla.
**Key Insights:**
Tesla continues to receive robust interest as macroeconomic conditions favor growth-oriented companies, particularly in the electric vehicle sector. The recent earnings showed signs of stabilization in gross margins, thanks to operational efficiency and cost reductions. Similarly, the company's megapack energy storage segment is gaining traction, which provides an ancillary growth avenue outside its core vehicle business. Technical indicators suggest strong momentum, with Tesla's Relative Strength Index (RSI) approaching bullish levels while trading volume supports the ongoing price recovery.
Furthermore, global EV adoption continues to rise, with increased government support for sustainable energy initiatives securing Tesla's place as a leading player. Supply chain constrictions, previously a concern, are relaxing, providing tailwinds for smoother production cycles.
**Recent Performance:**
Tesla's stock has gained over 8% in the past two weeks, recovering from its support levels around $305. The recent breakout above $320 signals renewed buying interest, accompanied by increased institutional participation. Short-term volatility has brought manageable dips, but overall momentum indicates bullish consolidation towards higher highs in its near-term trading range.
**Expert Analysis:**
Market strategists highlight Tesla’s ability to outperform its competitors due to vertical integration, advanced battery technologies, and scaling of operational efficiencies. Technical analysts note Tesla hovering near an ascending triangle formation with breakout potential above $330. Analysts also observe robust support around $310, which acts as a safety net for downside risks. Moving averages, especially the 50-day and 200-day lines, are converging as they indicate sustained bullish sentiment.
**News Impact:**
Recent news regarding expanded production facilities in Europe and positive developments in autonomous driving technology have fueled optimism among investors. Further bolstering sentiment is CEO Elon Musk’s strategic focus on prioritizing volumes over short-term profit metrics—a move widely seen as prudent given the current competitive landscape in EV markets.
**Trading Recommendation:**
Tesla is primed for upside momentum and presents an attractive long opportunity for traders targeting $340 and $350 next price zones. Its technical and fundamental outlook support the bullish case as macroeconomic tailwinds and company-specific factors align for higher valuations. Focus on maintaining risk discipline by exiting trades if stops at $315 or $310 are breached. For patient investors, Tesla is likely to remain a candidate for continued capital appreciation.
TSLA trade ideas
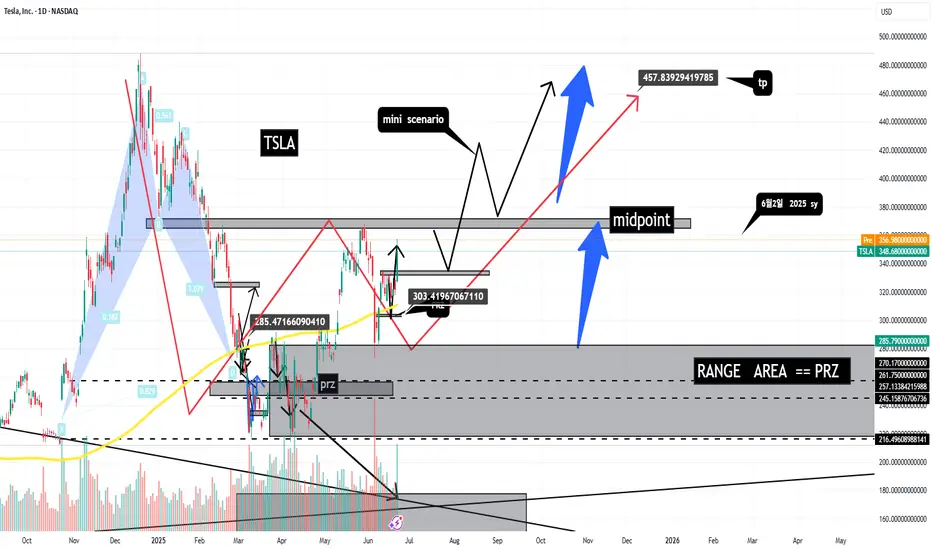
TSLA long scenario
TSLA long scenario
1.. important Registance ( $370 )
if break midpoint ( $370 ) next TP $457
2. i expect some correction near $ 330
it will be one more buy chance
-----------------------------------------
based on price action
harmonic theory
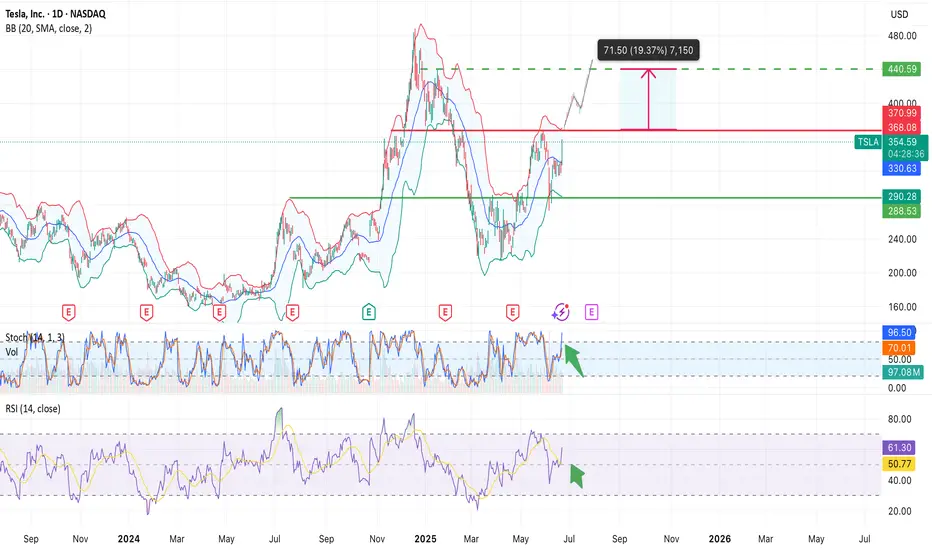
Tesla: Robotaxi Hype and Breakout WatchNASDAQ:TSLA surged nearly +10% today, driven by growing anticipation around the upcoming robotaxi unveiling on August 8.
Investors are positioning early, speculating this innovation could open new revenue streams for Tesla and redefine mobility.
📊 Technical Setup:
• Price broke out of local resistance near $330
• Approaching major resistance at $370–371 (Bollinger Band + prior support)
• If $370 is broken and held, the stock could enter a new trading range: $370–$440
• RSI and Stochastic are heating up, but no signs of reversal yet
⚙️ Robotaxi Catalyst:
• Elon Musk confirmed the Robotaxi event set for August 8
• Analysts speculate this could boost valuation through AI and self-driving revenue potential
• Option volume and retail interest are rising fast
📌 Levels to watch:
• Breakout level: $370
• Target: $440
• Support zone: $330
• Invalidation: Close below $310
👀 Watch for pre-event momentum. A break above $370 could trigger a squeeze.
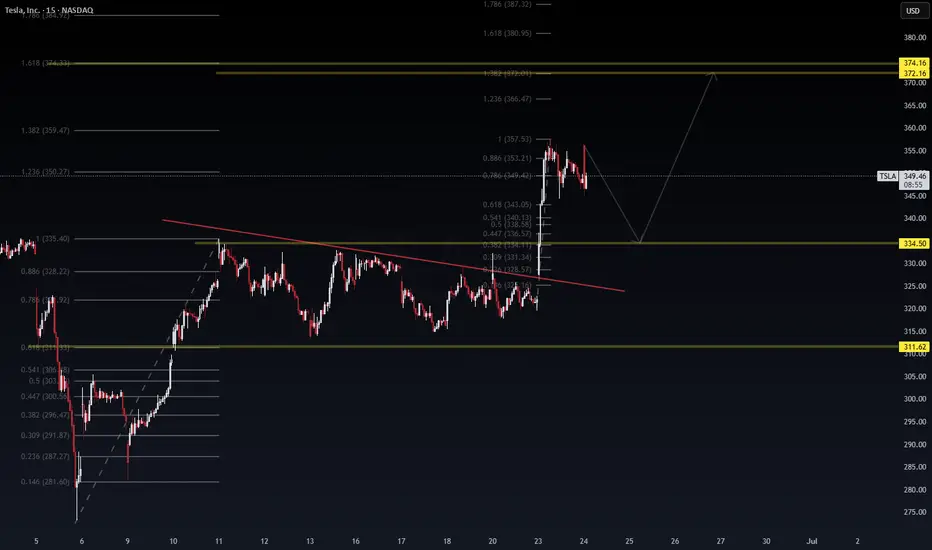
Technical Analysis – TSLAChart Summary:
Current Price: ~$349.21
Local Top: ~$357.53 (100% Fib extension)
Bearish Rejection: Notable wick + retrace from 0.886–1.0 zone
Probable Pullback Zone: 343.00–338.50 (Fibonacci 0.618–0.5 retracement)
Major Support Levels:
$334.50 – Prior key horizontal + Fib confluence
$311.62 – Historical demand zone
Projection:
Intraday double-leg correction toward $338–$343
Possible bounce and continuation toward the golden target zone:
$366.47 (1.236 Fib)
$374.16–$380.95 (1.618 zone)
🌍 Macro Alignment
Bullish backdrop:
Tech sector leading broader rally
Tesla’s robotaxi and AI narrative lifting sentiment
Oil down → margin relief for EV production
Catalysts this week: Powell testimony, PCE inflation
📈 Trading Plan
Type Direction Entry Target(s) Stop Loss Confidence
Intraday Bearish $352–$353 rejection zone $343 → $338.5 Above $357.5 🔶 Medium
Swing (Buy the dip) Bullish $338–$334 zone $366.47 → $374.16 Below $330 🟢 Strong
📌 Suggested Strategy
Scalp short if rejection at $353.2–$357.5 confirms with bearish candle on volume.
Add long exposure if price consolidates or reverses from the $338–$334.5 support area.
Monitor Powell’s remarks – Any dovish tilt could accelerate tech upside.
TSLA sentiment remains strong, but intraday shakeouts are expected.
✍️ Summary Signal
“TSLA remains bullish on a swing basis, but intraday looks set for a Fibonacci pullback to $338–$334. Buy dips if structure holds. Macro backdrop (robotaxi + Fed pause) supports continuation to $366–$374.”
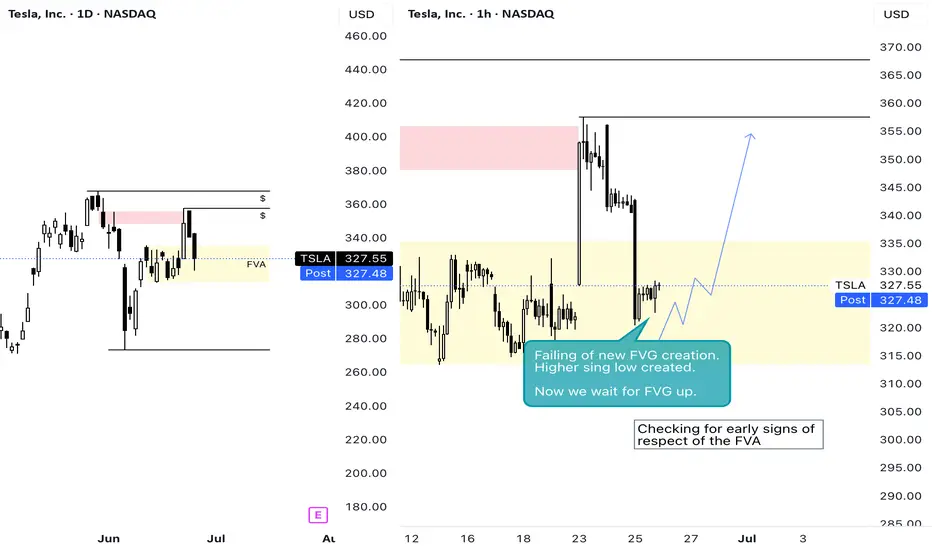
AoO Series No.3Wed - Monitoring the FVA reaction. The last swing high on the D is the last line of defence of the bearish FVG. If we run that high, there is no resistance left and we enter an area of opportunity.
Monitoring on the 4H and 1H early signs of respect of the FVA.
V-Bottom + Apocalypse news => Going UpV bottom was formed.
News are clearly bearish in a conclusive way =>> fool the public to sell shares to the big fish while the market will go up...
Overall market sentiment under the hood is bullish. Public is in huge fear of banks that collapsed and will continue to collapse, so the masses will sell stocks on an up wave fearing it will go down.
How else you will make the mass public sell their stocks? if there is no apocalypse on the way...? think about it...
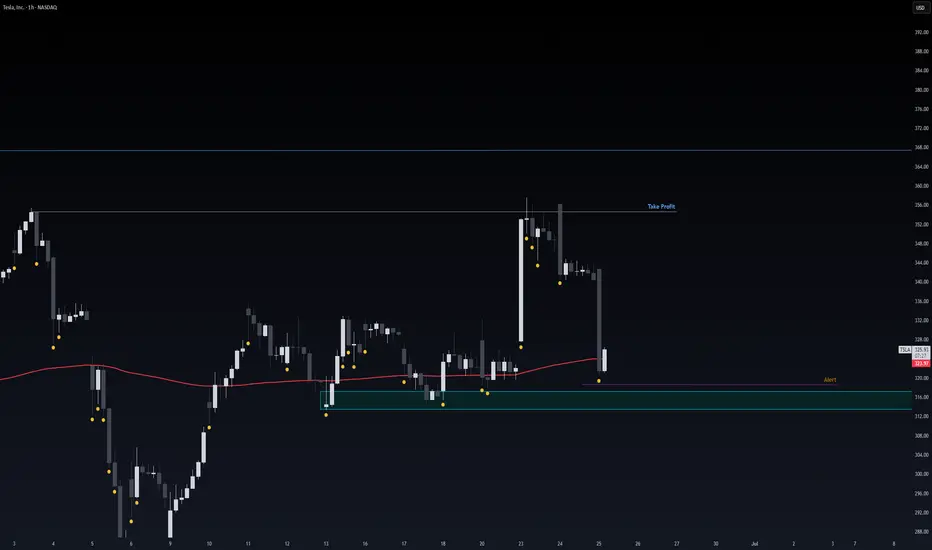
Safe Entry Zone TeslaGreen Zone is Safe Entry Zone.
Target is Take Profit line.
Note: 1- Potentional of Strong Buying Zone:
We have two scenarios must happen at The Mentioned Zone:
Scenarios One: strong buying volume with reversal Candle.
Scenarios Two: Fake Break-Out of The Buying Zone.
Both indicate buyers stepping in strongly. NEVER Join in unless one showed up.
2- How to Buy Stock:
On 15M TF when Marubozu Candle show up which indicate strong buyers stepping-in.
Buy on 0.5 Fibo Level of the Marubozu Candle, because price will always and always re-test the imbalance.
TSLA : Up trend is becoming weakNASDAQ:TSLA is in Up trend. But the uptrend is becoming weak. Bullish momentum may become weak here. It has pull backed from the down trend line. So It may enter in sideways trend. Down trend line may act as resistance and up trend line may act as support.
Will the Robotaxi euphoria continue to push TSLA higher?NASDAQ:TSLA pushing higher the last few days thanks to the start robotaxis. Will this rally continue? the answer is yes until the LIS gets broken.
LIS is at 311, any break below will give a retrace. If you are long, get out and get back in when the next LIS gets broken on the upside. This is efficient investing. Don't waste time doing HODL.
LIS is evolving over time, I will keep you updated on it.
This is really simple trading based on important levels. Keep following my post, so you can see it by yourself.
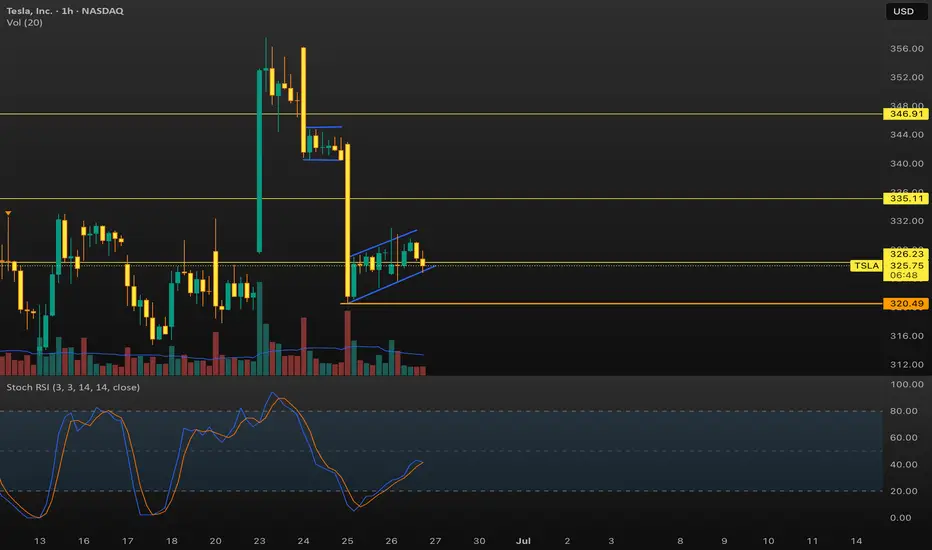
TSLA: GEX Points to Bounce Setup. Is This the Dip to Load Calls?📊 GEX-Based Options Suggestion
Gamma Exposure (GEX) data paints a bullish opportunity if TSLA holds the critical support zones:
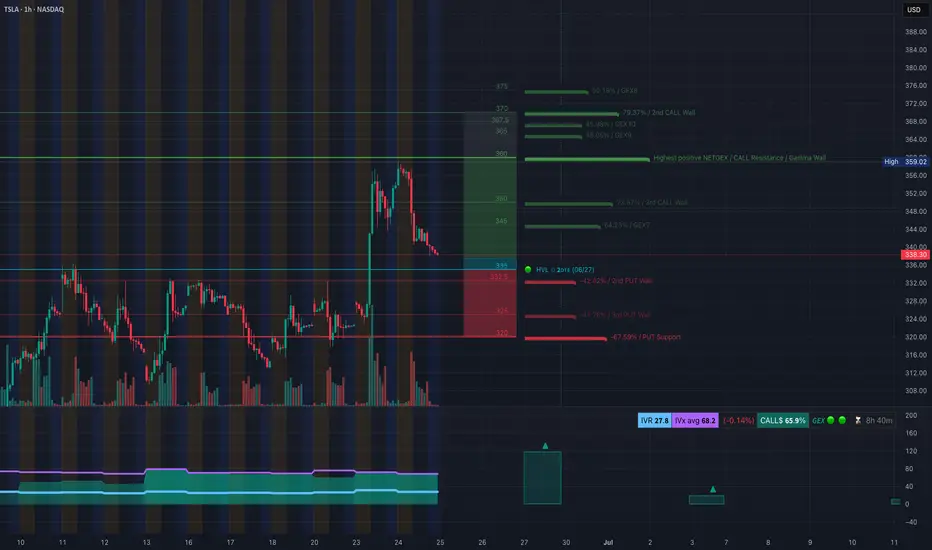
* ✅ Key GEX Levels:
* $338: Near current price, minor GEX flip zone.
* $345–$350: Strong upward magnets (3rd Call Wall + GEX build-up).
* $359: Gamma Wall + Highest Net Positive GEX — market makers may pin price near this into end of week if bulls hold.
* 🛡️ Below Support:
* $330: Light PUT defense.
* $320: Major Put Support (-67.5%) — strong bounce zone if downside accelerates.
🔔 Option Trade Idea Based on GEX:
With TSLA near the $338 zone and GEX showing stacked resistance above + positive net exposure, a high-risk/reward call entry is forming.
* Play: Buy 345C or 350C expiring 06/28 or 07/05
* Trigger: Only if price holds $335+ and shows strength with volume bounce
* Target: $345 → $350 → potential pin near $359 (Gamma Wall)
* Stop: Close under $332 invalidates the bounce setup
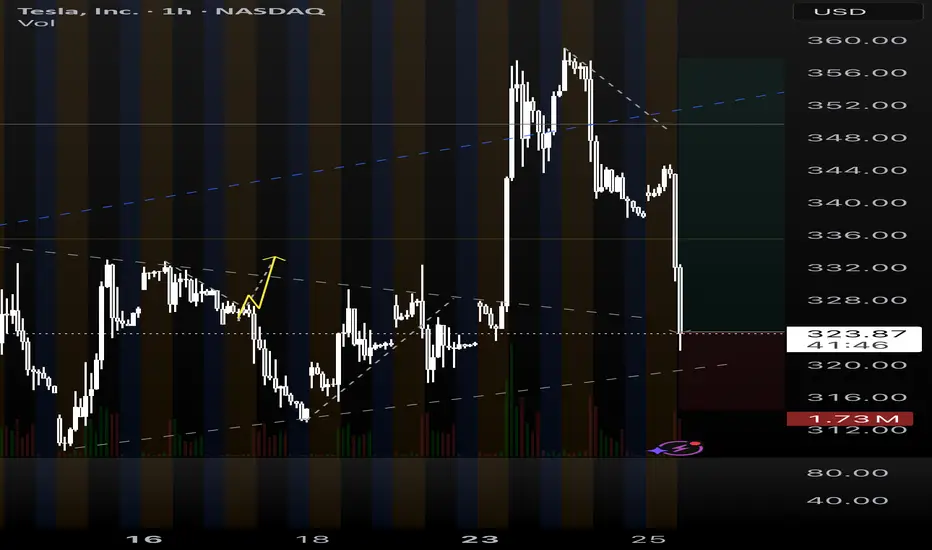
🧠 Trading Setup – 1H Chart (Second Image)
From the second image, we analyze price action and structure to validate the GEX idea:
📉 Market Structure:
* Price is pulling back into a prior demand zone from $335–$338.
* Trendline support + Fair Value Gap zone + SMC CHoCH aligning at this base.
* Multiple bullish CHoCHs suggest potential reaccumulation if support holds.
🎯 Trading Plan Based on Price Action:
Bullish Case (Base Holds):
* Entry: $335–$338 zone (bounce off trendline and demand zone)
* Target: $345 (GEX level) → $348 → $350
* Stop-Loss: $331
High confluence with GEX option play. Use volume spike for confirmation.
Bearish Breakdown Scenario:
* Trigger: Loss of $331 + trendline break
* Target: $325 → $320 (strong PUT wall support)
* Put Options: 325P or 320P if breakdown triggers with momentum
⚠️ Summary:
TSLA is entering a decision zone — GEX shows bullish opportunity if $335 support holds, with upside targets toward $350–$359. But if price breaks under $330, expect a flush toward PUT support.
Patience is key — let price confirm the bounce or the break.
This setup is for educational purposes only. Trade with discipline and use stops. Always do your own research.
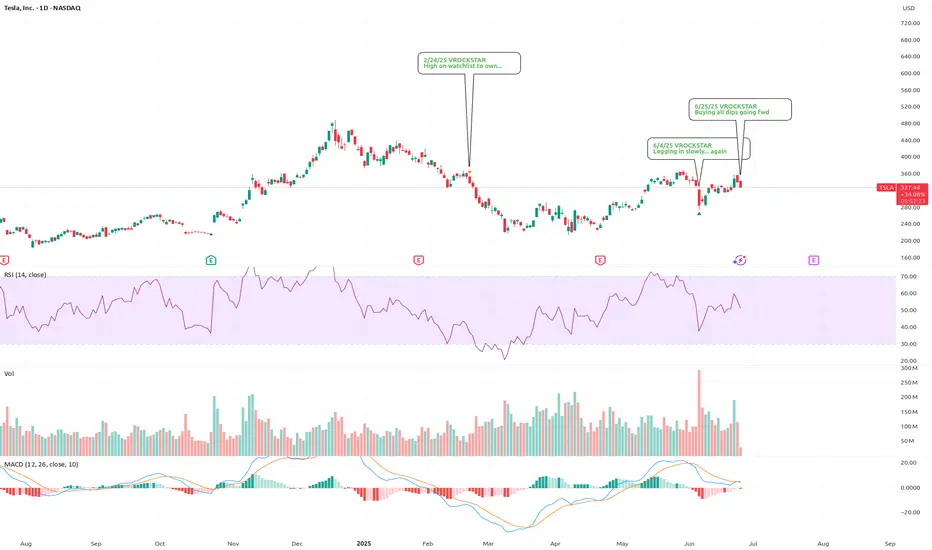
6/25/25 - $tsla - Buying all dips going fwd6/25/25 :: VROCKSTAR :: NASDAQ:TSLA
Buying all dips going fwd
- "successful robotaxi or not successful robotaxi"
- elon's clearly won the vision game
- scaling hardware (cars, infra, optimus, solar) is m-o-a-t
- so is a humanoid and robotaxi robotics company that doesn't burn cash worth a trilly in today's world if the upside is perhaps 5-10 tn in the coming decade (worst case) and your downside here is what? 30... 40... 50%? Is it more? unlikely.
- so "yes" we remain entering consumer recessy. yes "tsla" shares r not cheap. and that's for a reason.
- buy scarce paper.
- buying all dips here.
- i like the dec '27 deep ITM leaps. allows me to wrangle size with a bit more flexibility in the coming months.
- but this rocketship has yet to make any meaningful moves.
- $1,000/shr is the 2Y tgt.
V
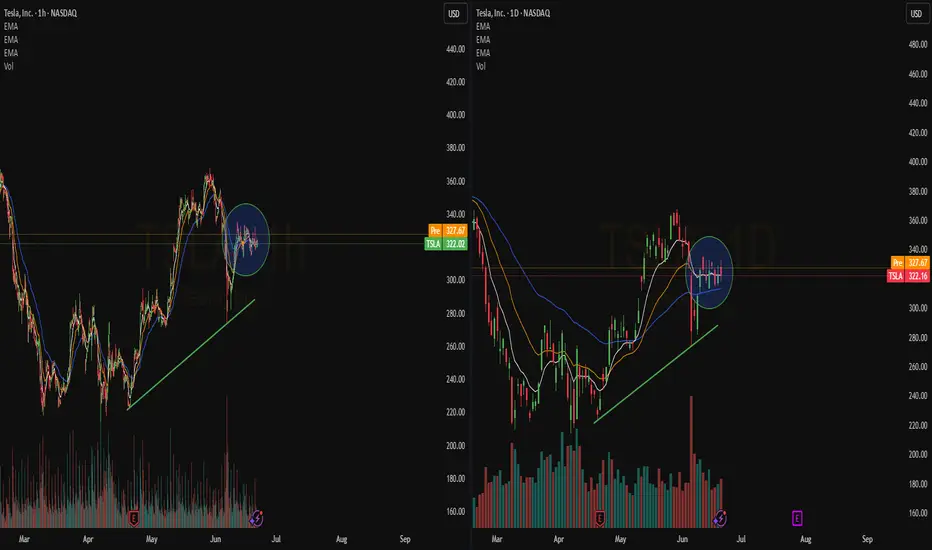
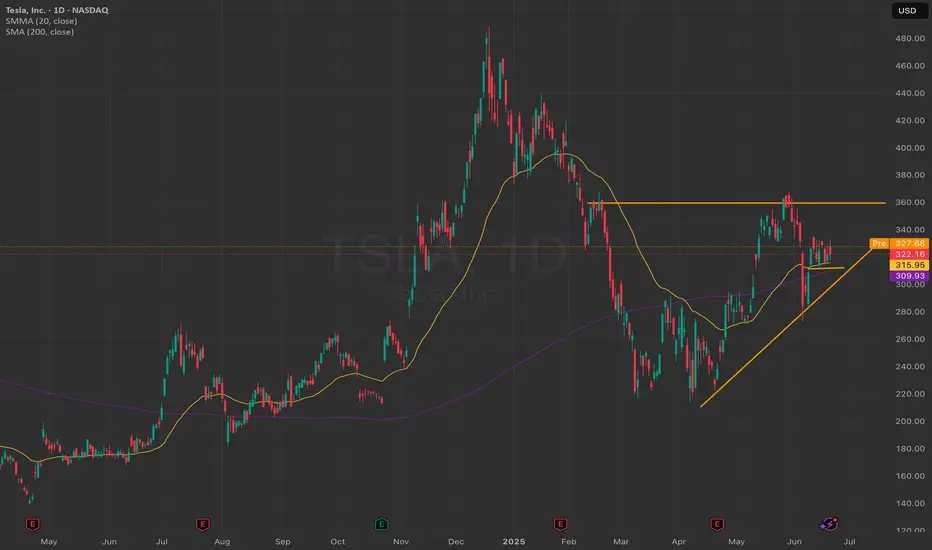
Quick View: $TSLA
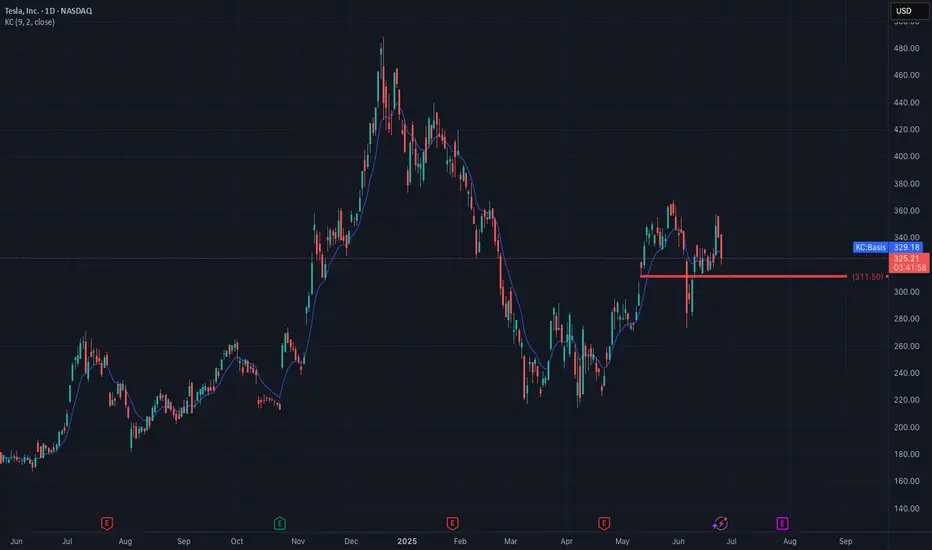
- Bullish Box on the daily chart supported by the ema50d and strong ema 21d and 9d. No volume on this box.
- Almost the same pattern on the hourly
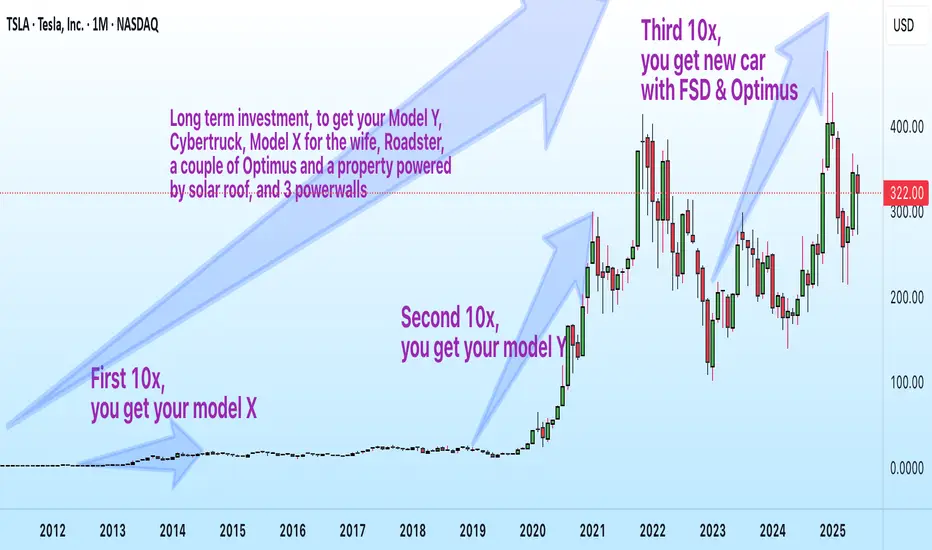
$TSLA Long-Term View: From $2 to $300+—How Far Can Vision Go?
📈 13-Year Monthly Chart of NASDAQ:TSLA
A $20,000 investment in Tesla back in 2012 wasn’t just a bet on a stock—it was a ticket to the future.
By 2014, those gains could’ve paid for a Model S.
By 2019, the same investment might’ve covered a Model Y and Model 3—one for you, one for your spouse.
Now, with Tesla pushing the limits of AI and robotics, could that investment soon deliver a full FSD suite and even a pair of Optimus robots serving in your home?
This chart tracks NASDAQ:TSLA ’s incredible rise—from just $2.19 in 2012 to $319.50 in June 2025.
Sometimes, holding is innovation.
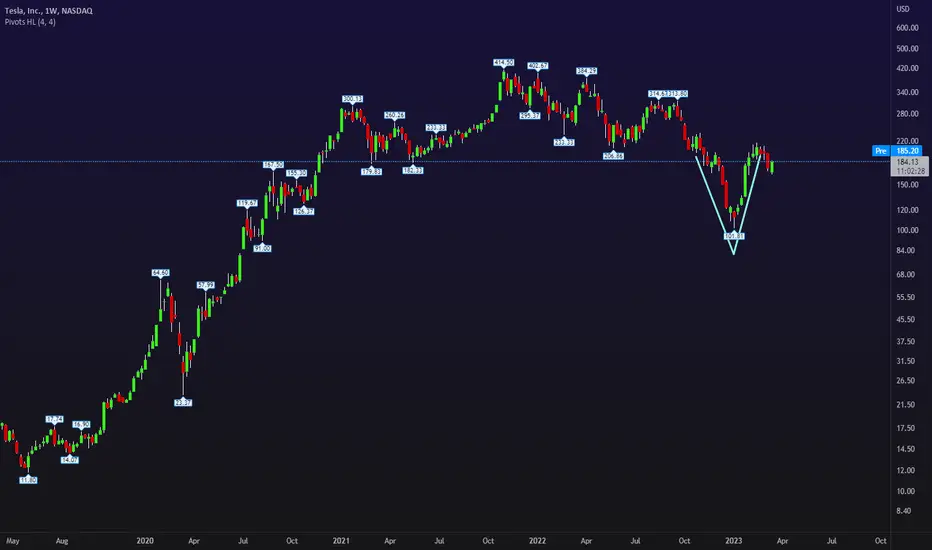
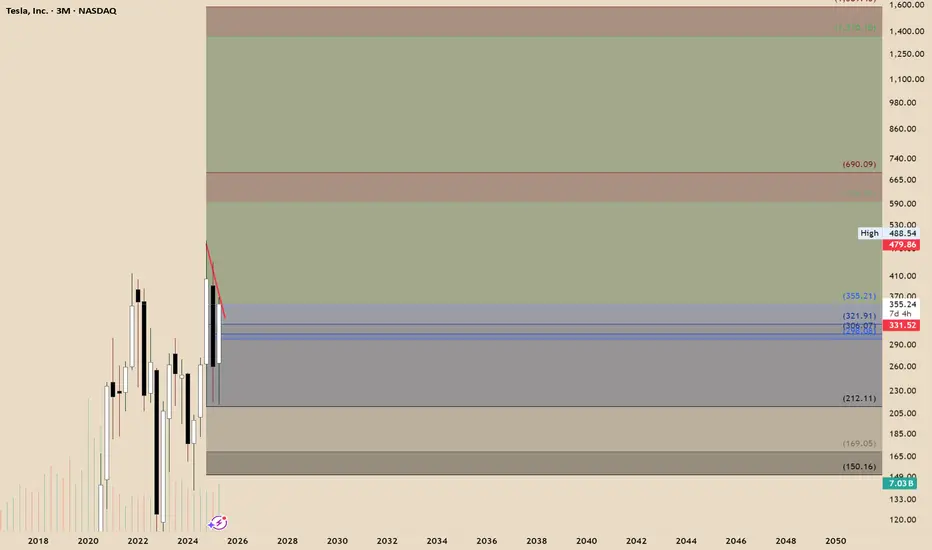
TESLA: Can double its price ($640) by the end of the year.Tesla is neutral on its 1D technical outlook (RSI = 51.064, MACD = 4.910, ADX = 24.971), consolidating for the past week, but remains over its 1D MA50 and 1D MA200 nonetheless. Since the major market bottom on January 6th 2023, it's been trading inside a Channel Up and this is its 3rd bullish wave. The 2 prior rose by +196.67% from the bottom of the pattern (despite the 2nd breaking marginally under it). Consequently, this suggests that Tesla can rise by +100% from the current $320 level, before the Channel Up tops (HH) again. We are bullish, TP = 640.
See how our prior idea has worked out:
## If you like our free content follow our profile to get more daily ideas. ##
## Comments and likes are greatly appreciated. ##

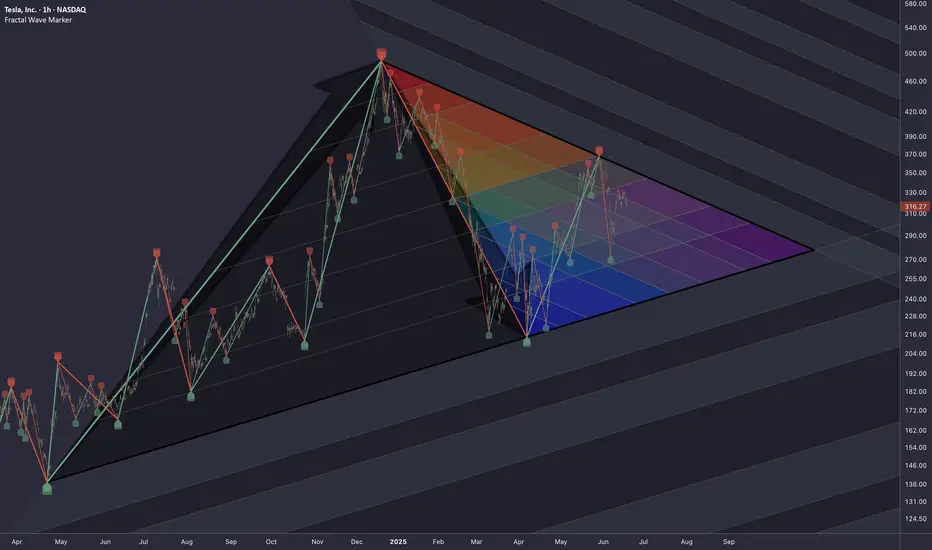
TSLA: Anyone knows this powerful pattern?TSLA:
Anyone knows this powerful pattern?
The crowd gets lost in colorful indicators, forgetting that the market speaks clearly through just price and volume.
.
US STOCKS- WALL STREET DREAM- LET'S THE MARKET SPEAK!
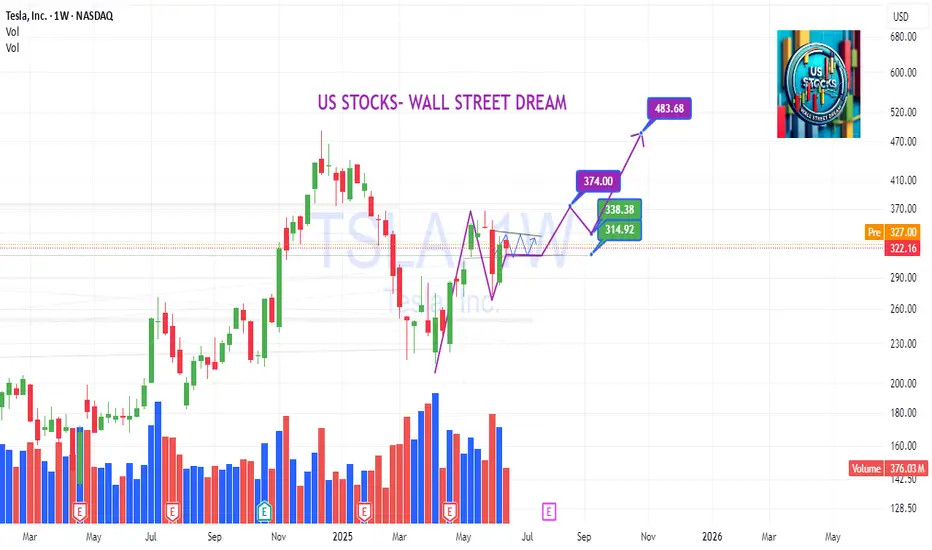
A Bullish Long-Term Outlook Tesla continues to present a compelling case for long-term investors, underpinned by its innovation-led growth trajectory and emerging dominance in autonomous mobility. Technically, recent market structure reveals an imbalance within a quarterly bullish breaker, suggesting further price expansion. If macroeconomic conditions remain favorable, the next algorithmic target zones fall between $594 and $690, signaling potential upside.
On the fundamental front, Tesla’s recent moves—particularly its rollout of the robotaxi network—have ignited fresh investor optimism. Analysts now estimate that autonomous driving could account for a substantial portion of Tesla’s future valuation, with some long-range forecasts placing the stock above $2,000 within the next several years.
While short-term pressures such as softening EV demand and regulatory barriers persist, Tesla’s consistent execution on AI-driven mobility may unlock new valuation territory.
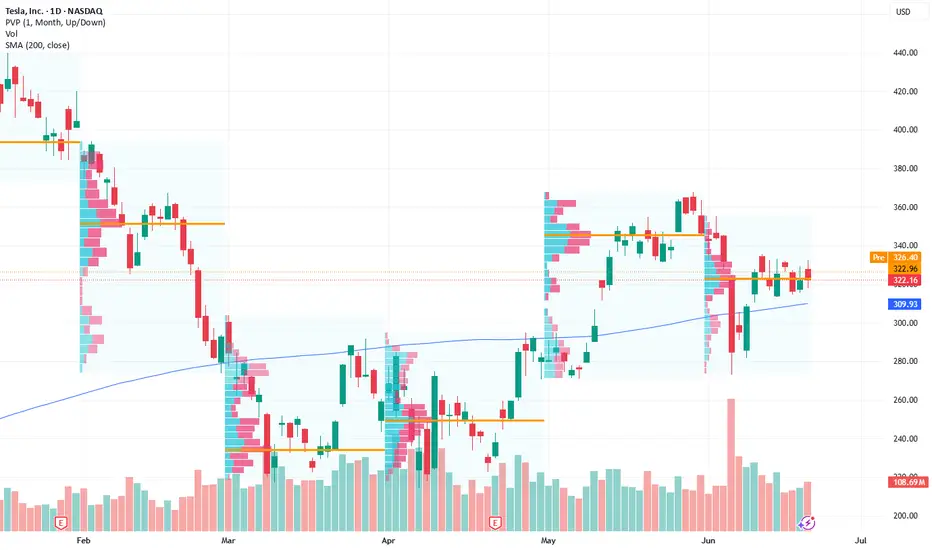
Tesla, Inc. (TSLA) Boosted by Energy StorageTesla, Inc. (TSLA) is a global leader in electric vehicles, clean energy solutions, and battery technology. The company designs and manufactures EVs, solar products, and energy storage systems that help drive the transition to sustainable energy. Tesla’s growth is fueled by rising EV adoption, battery innovations, and expansion into new markets with its cutting-edge technologies.
On the chart, a confirmation bar with increasing volume signals strong buying interest. The price has moved into the momentum zone by breaking above the .236 Fibonacci level. A trailing stop can be set just below this level using the Fibonacci snap tool to protect gains as momentum continues.
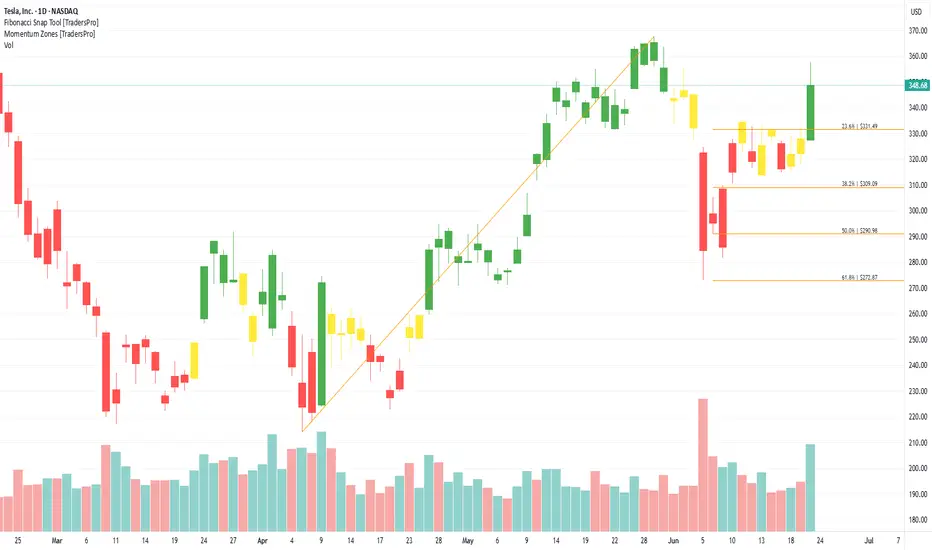
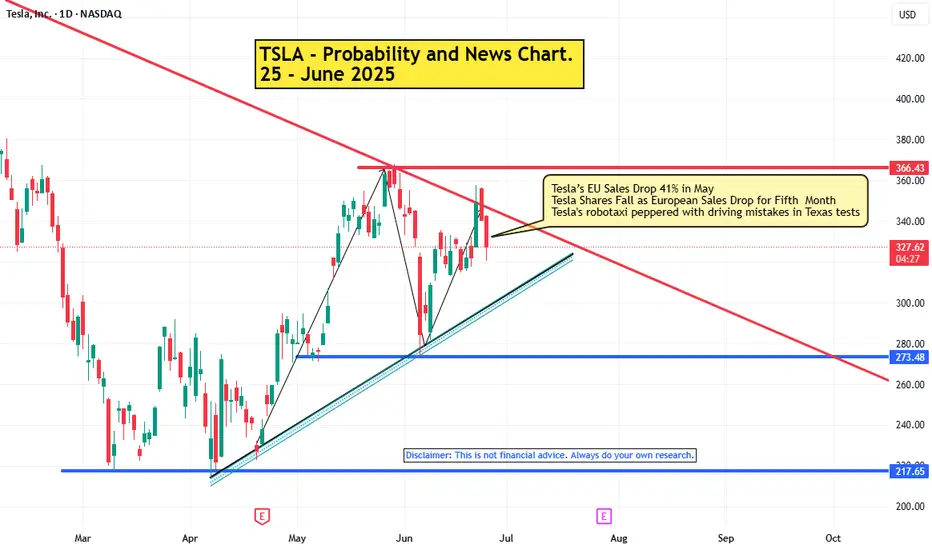
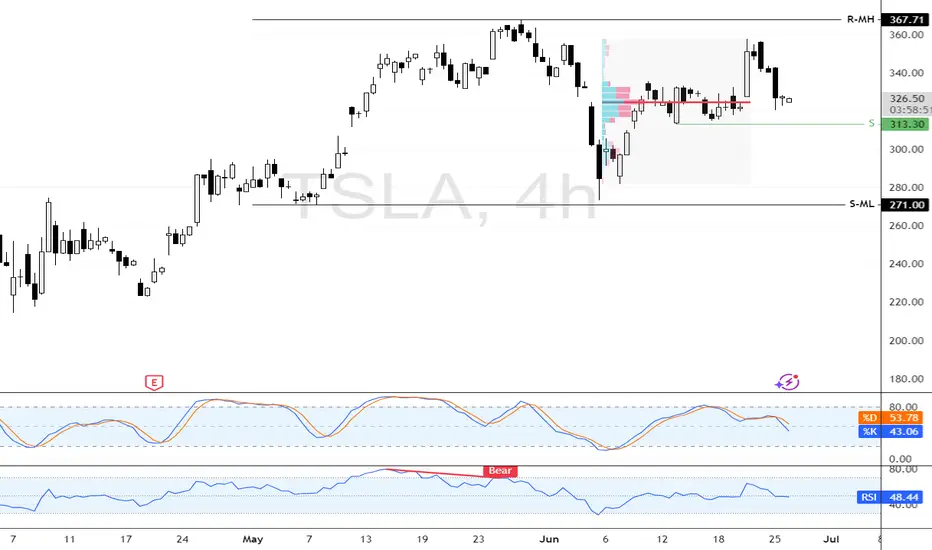
Key Support at $313.3 Holds Potential for TSLA UpsideTesla tested the order block with an average price of $325.00 in yesterday's trading session. The critical support for TSLA is at $313.3, and if this level holds, the price can target $367.71.
TSLA (daytrading) break out and retest1. Still watching here (down trend is too strong)
We can see break out patterm
2. And came back to restest. But i worry about that tsla usually doesnt restest like that.
3. Hit sma 200 h1
TSLA ready to head higherTSLA at the 200 SMA coming out of a sell off.... After the RoboTaxi debut, may get positive momentum to go higher ...
TSLA: Triangle PatternResearching the market through structural lens, particularly the topology of trapped liquidity buildup and compression of volatility, that leads to a proportionally heavier move once a breakout occurs.
Raw compression area derived from waves of higher degrees (2nd, 3rd)
The longer price consolidates within boundaries of a triangular formation, the more significant the breakout tends to be.
TESLA LONG IDEAThe overall trend of TSLA is bullish. However, it has been retracing for a while. Currently, there's a confirmation showing that the stock is ready for a rally, targeting the previous high.
Using Structural Range Concept (SRC), a subset of Smart Money Concept (SMC), price has shown an intention to resume bullish trend. There was a mitigation of a demand zone in the discount level which led to an internal bullish break of structure, confirming the intention to go up.
A retracement into the demand zone is necessary to maximize return while minimizing risk. Entry is around $258.25 while the exit is around $210.72 and the final target is around $488.10. The risk reward ratio (RRR) is about 4.9 (that is, 4.9x of the risk).
Confluences for the long idea:
1. The trend is bullish
2. Price is in discount level
3. Price has given internal break of structure with inducement after mitigating a valid demand zone.
4. Price is also respecting bullish trend line.
Disclaimer: This is not a financial advice. Don't take the signal if you don't accept the risk. The outcome maybe different from the projection.
