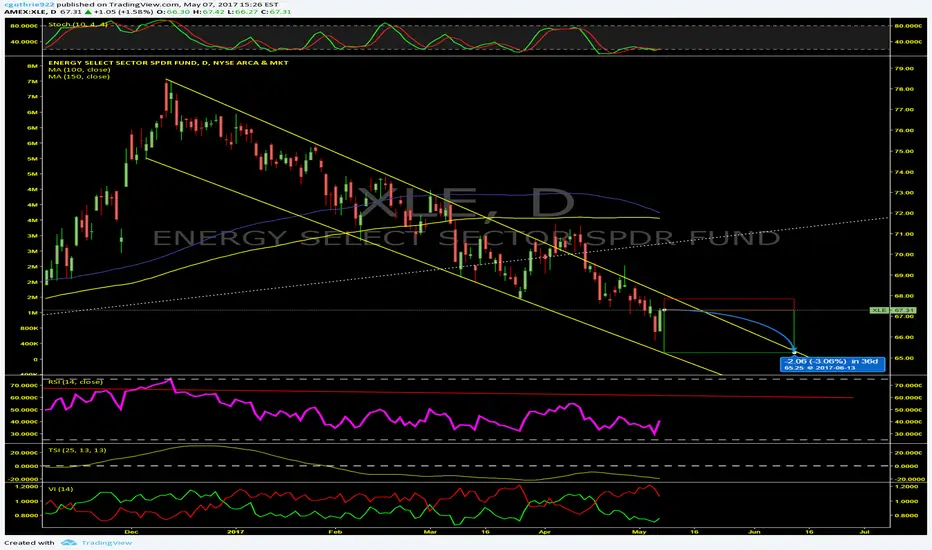
Low Energy In Energy SectorThe Energy Sector SPDR Fund XLE has been in a defined bearish trend for all of 2017. Due to this bearish movement, the 100 day moving average (DMA) is about to cross below the 150 DMA. This actual event has occurred 15 times in the history of the fund and has a minimal drop of 0.263%. It has a median drop of 2.067% and maximum drop of 38.054% over the following 16 trading days. Although I typically write on events that have occurred, this event is likely and greater benefit could be gained by making moves earlier.
When we take a look at other technical indicators, the relative strength index (RSI) is at 40.2699. RSI tends to determine trends, overbought and oversold levels as well as likelihood of price swings. I personally use anything above 75 as overbought and anything under 25 as oversold. The current reading declares the fund has been moving lower. The RSI has been trending lower since May 2016. Even though the RSI typically cycles between overbought and oversold levels, that has not necessarily been the case with this fund. Overall the RSI is failing to make newer highs which is another significant signal of downward movement. Only once over the past year has the RSI broke above this trend before immediately following suit and heading down. This overall downtrend should continue as long as the RSI stays below this trendline.
The true strength index (TSI) is currently -19.3683. The TSI determines overbought/oversold levels and/or current trend. I solely use this as an indicator of trend as overbought and oversold levels vary. The TSI is double smoothed in its calculation and is a great indicator of upward and downward movement. The current reading declares the fund is down.
The positive vortex indicator (VI) is at 0.7572 and the negative is at 1.0678. When the positive level is higher than 1 and higher than the negative indicator, the overall price action is moving upward. When the negative level is higher than 1 and higher than the positive indicator, the overall price action is moving downward. The current reading declares the fund slightly moving up recently, but should begin its downtrend again.
The stochastic oscillator K value is 21.2870 and D value is 19.7285. This is a cyclical oscillator that is highly accurate and can be used to identify overbought/oversold levels as well as pending reversals and short-term activity. I personally use anything above 80 as overbought and below 20 as oversold. When the K value is higher than the D value, the stock is trending up. When the D value is higher that the K value the stock is trending down. The current reading declares the fund has been flirting with oversold territory for at least two weeks. Most likely one of two things will occur. The fund will continue to slowly move down with up days causing the stochastic to stabilize and rise even though the fund continues its downward bias. The second possibility would have the fund rise up and out of the downtrend either temporarily or permanently.
Considering the moving average crossover, RSI, TSI, VI and stochastic levels, the overall direction appears to be pointing down. Based on historical movement compared to current levels and the current position, the stock could drop at least 3% over the next 26 trading days.
XLE trade ideas
XLE above the gap open hereThis is a quite possible Monday bounce play. Decent odds for upside Monday.
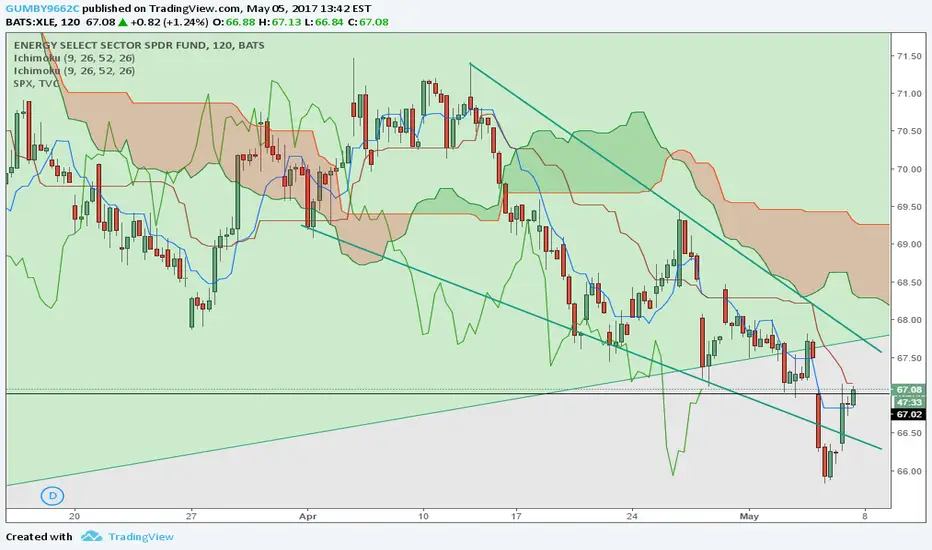

channel hold or break?market pretend to be risk off but actually i think will hold support trend line and break resistances(red line) above, breaking support (green line) considered to be EM sell off

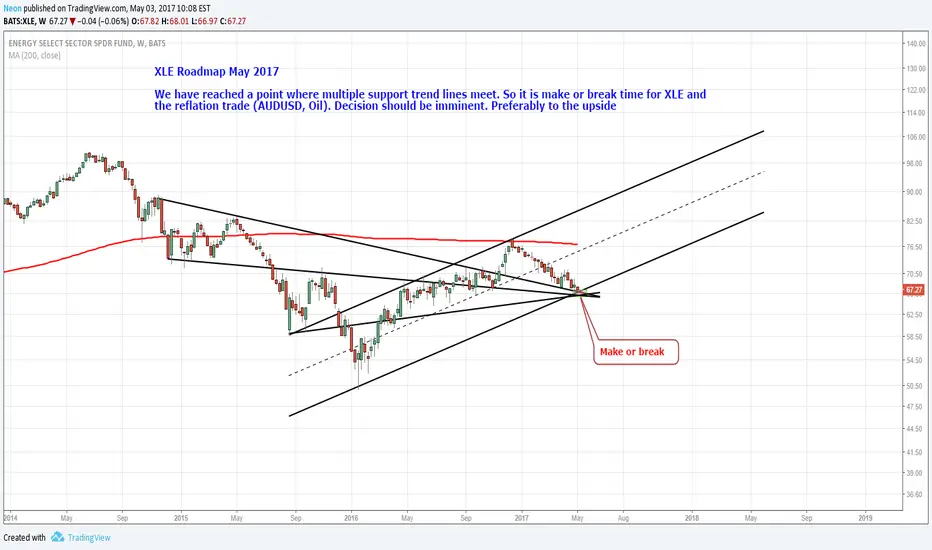
XLE - Energy Select Sector SPDR FundEnergy needs to follow the stock market in a healthy economy - otherwise something is wrong

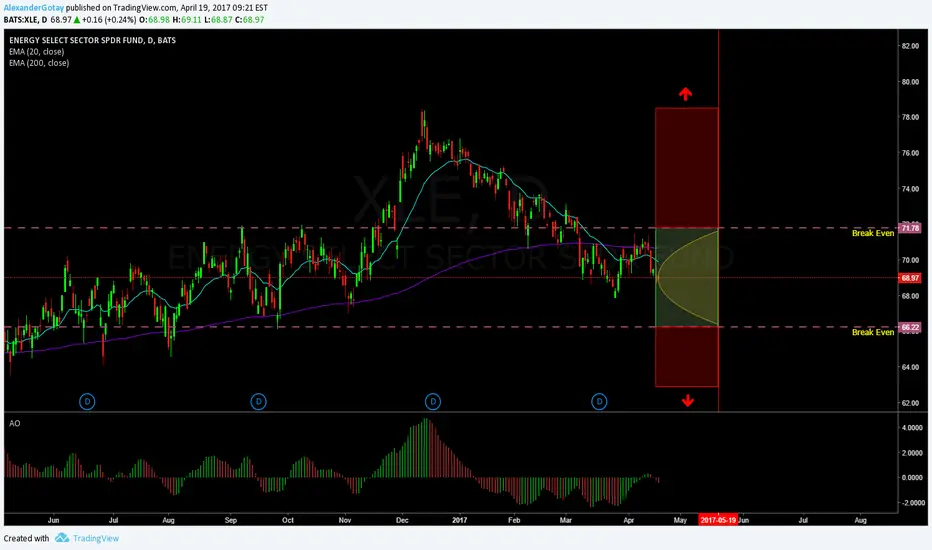
Neutral trade on XLE (Straddle)Looking for a neutral play on XLE (I think we are starting to have 2 way action). IVR is not that high at 26, so doing less contracts (I don't have any other position right now on XLE).
I sold the 69 Straddle for $2.78. Our break evens are just above the expected move, and this is close to a 54% probability trade.
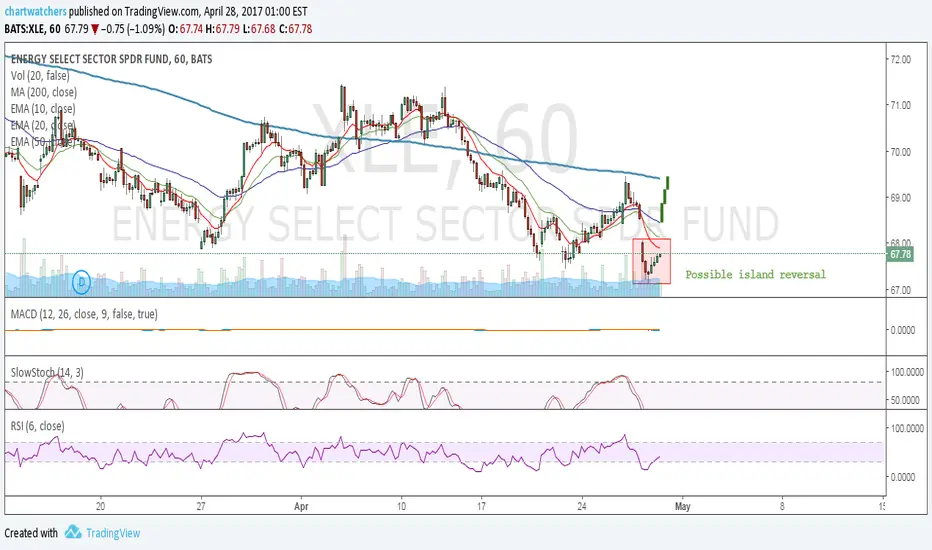
XLE/ERX - Bear IslandThe chance is high that we are printing an island reversal today in XLE.
Yesterday a lot of players stopped out in ERX and XLE as we broke to new lows.
I think it was only a final shakeout before the next rally.
If we have a gap open today and the gap is not filled we are printing an island reversal . It would be a very strong bullish pattern in XLE and ERX.
This could sign a long term bottom in XLE and ERX. It is important that the gap should not be filled. In this case it's a runaway gap which might never get filled.
LONG follow through idea
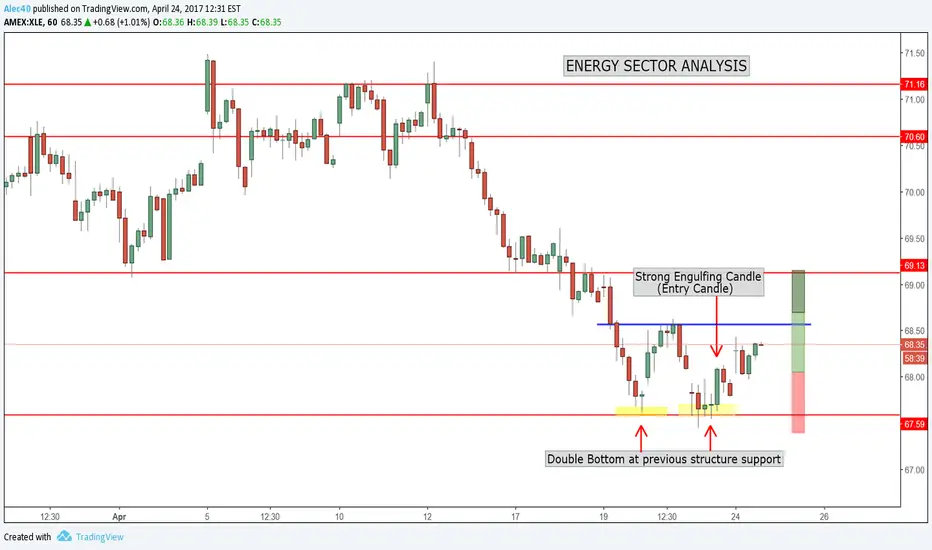
Energy Sector Rally! New Micro Trend beginningHey Traders, We have a nice double bottom on XLE with a Strong Bullish Candle! I tried to get this out as soon as possible however I do believe there is still time for entry if this meets your rules and criteria for entry.
Reasons for Entry:
1) We have a double bottom at previous structure support.
2) We have a strong bullish engulfing candle.
3) Price has been trading below the 20 period moving average for the last week or so and has finally broken through it and retested it again as support.
4) Price has been trading on the lower Bollinger band since this down move began and this shows that the sellers were strong but now something has changed. Price is no longer riding the lower Bollinger band but instead is approaching the top band with an increase in volatility. This is a good indication that a new trend is likely to begin (check out chart below for a further explanation).
Entry- $68.00
Target 1- $68.65
Target 2- $69.20
I may trail stops for target 2 depending on the strength in this move. I will be sure to keep this idea updated. Please feel free to comment below with any questions regarding the setup or to share your analysis. Thanks Traders and good luck Trading!

XLE /ERX - Possible long term bottomWe possibly forming a longer term bottom in XLE (ERX is the 3x ETF for XLE).
Yesterday I wasn't able to post the chart I just posted below the last oil chart: I'm going to enter into ERX at the close.
XLE and ERX likes to bottom with a beartrap. When RSI leaves oversold territory it's usually a good sign we are bottoming. In this case we might be printing a longer term intermediate low and a great rally is coming.
New LONG ENTRY : 67.7 $


XLE and OilBetween military action and the breaking of the trend line, is oil not going up short term?

XLE daily chart. Trend line , sma Possible Break out.XLE daily chart. Possible Break out. Long on breakout stabilization of downtrend line and sma.
ABC possible.
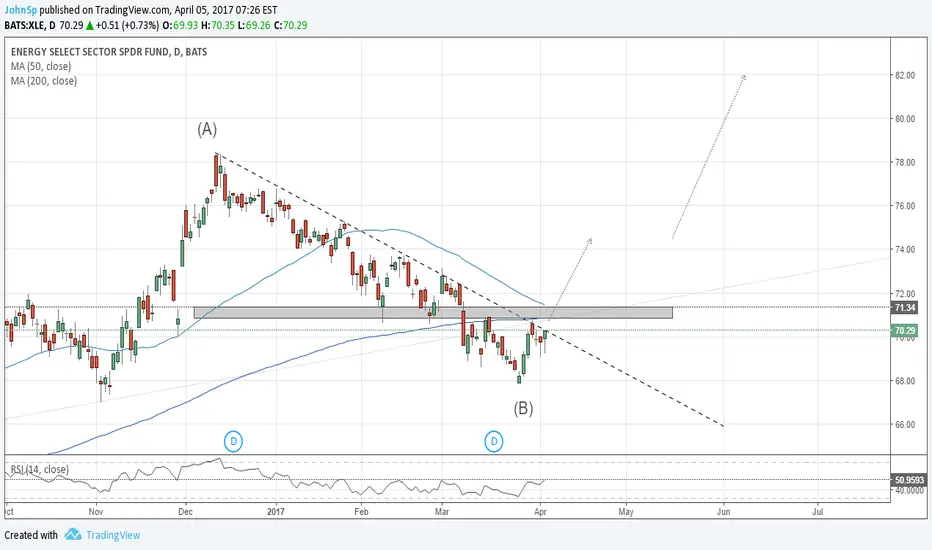

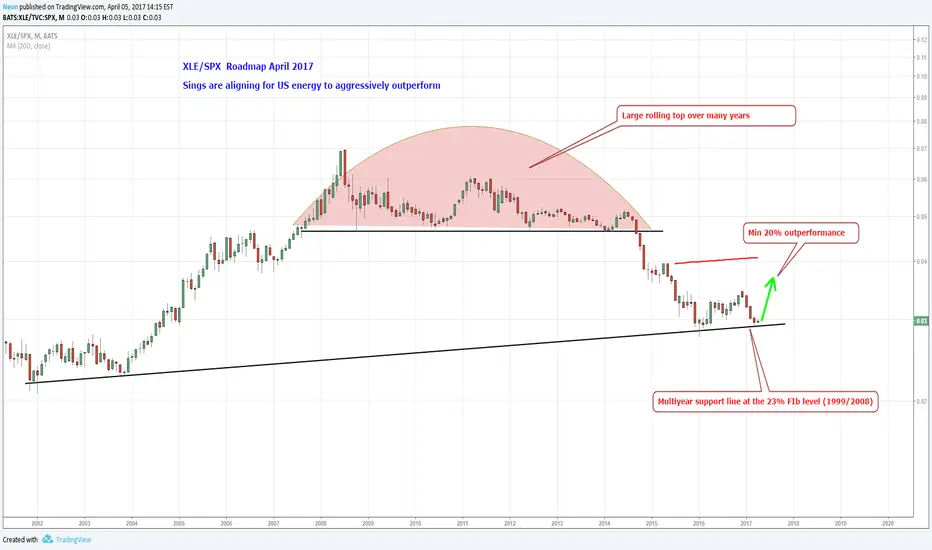
XLE Roadmap Short Term March 2017Significant upside into summer.. and possibly more (see speculative View)


XLE Iron FlyTrade Setup:
-1 XLE Apr 21 65/69.5/69.5/74 Iron Fly @ $2.33
DTE: 30
Max Win: $233
Max Loss: $217
Breakevens: $67.17 & $71.83
Trade Management: 25% profit; Full loser, possibly roll the ITM side out in time if my bias is the same near expiration.
Green is profit zone; vertical black bar is expiration.

