The Credit Cycle - Free Wealth is Over?Idea for Macro:
- Financial sector selling off heavily.
- While it's early to call a bear market, the exhaustion gap at an all time high is a reasonable signal for market reversal.
- XLF, XLE and FAAMG have been holding up the broader markets at this high... Cracks appearing?
Underlying conditions:
- Institutions will invest based on 18 months into the future (Druckenmiller).
- There are 3 relevant possibilities for the banks:
(1) Inflation is sticky, interest rates will be raised in the future, within 18 months. This actually increases the banking sector's profitability, but the price is declining because they have been speculated above valuations.
(2) Inflation is transitory, interest rates will not be raised, and we will have negative real rates. This will hurt the banks' profit margins. This is a possibility due to the 40 year demand-push deflation the US has been in (see Oil/CPI).
(3) More importantly, the economy will decelerate (deflationary). Liquidity components of the Fed B/S have been decelerating and global credit impulse (lending) has gone negative. No more easy lending, less loans, meaning less earnings for the banks. Investors know this and are exiting the overheated trade.
Either way for inflation, global liquidity and global credit impulse are turning down, so the Long Volatility trade seems to be ideal.
Why did global risk assets rise to such insane levels? Credit impulse - easy lending. Now that supply of sugar is gone. Only one thing left that can happen.
GLHF
- DPT
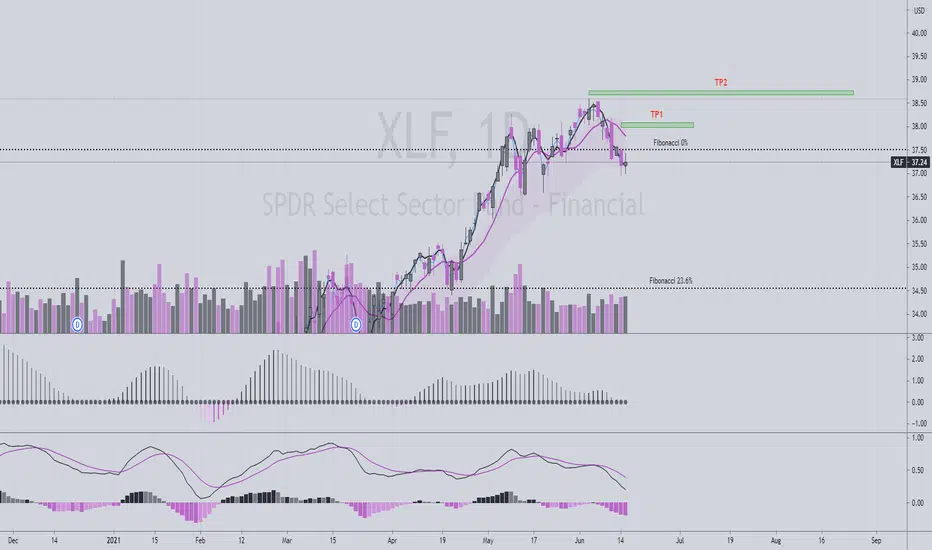
XLF trade ideas

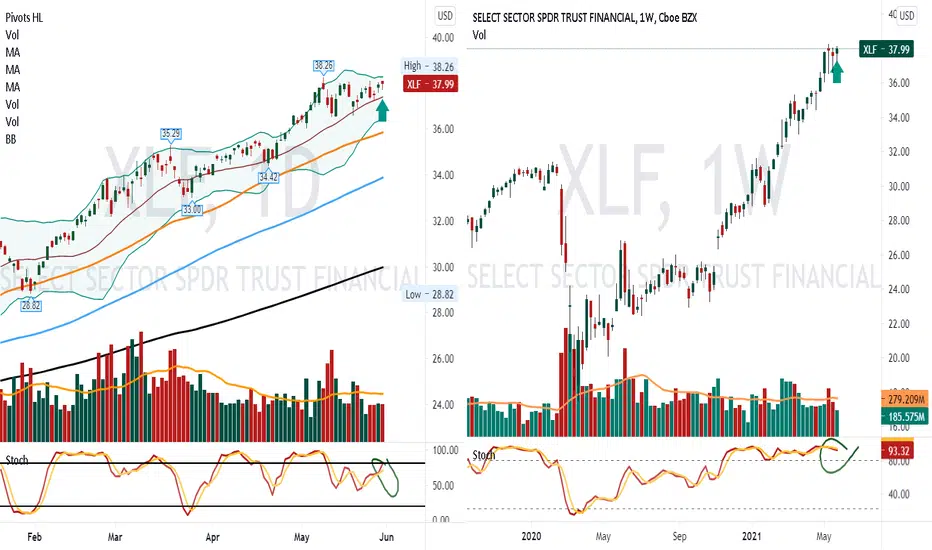
Staying short XLF 37.42Daily stoch still pointing down
beautiful lower highs and todays candle
vol lots more selling then buying 35.29 support
I can see maybe trying rally up some will see.
Weekly stoch heading down needs break 70-68% on stoch
nice candle and vol.

Long | XLFAMEX:XLF
It looks very bullish,
Possible Scenario: LONG
Call options, Strike 39$, 08/20/21
* this is my idea and could be wrong 100%
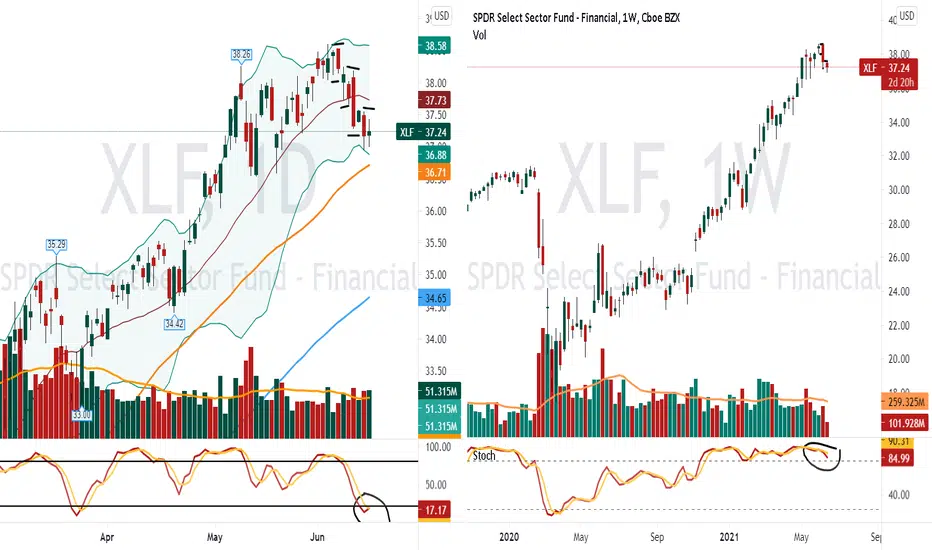
Staying short XLF 37.42Daily says wants rally some. Daily making lower highs. Lower lows
weekly turning over needs break 70%
Lets see we rally up making another lower high
I still believe banks drop more.
Quad Witching June 18th - Max Pain XLF Max Pain level for options expiring this Friday is $35.00
maximum-pain.com
Not financial advice.

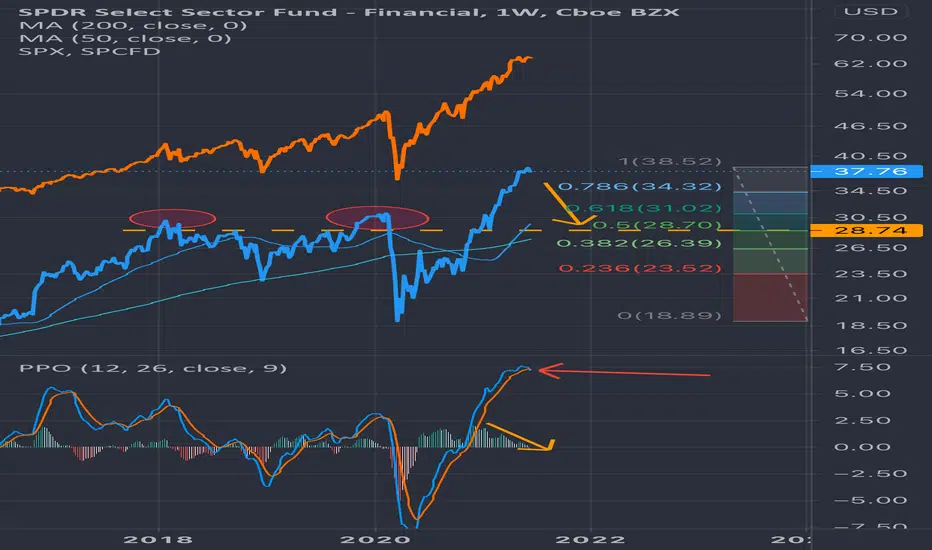
XLFNot a Fib expert but 1.618 from the Covid crash low is $40. This might line up with an overall market pullback...

I am Short XLF @ 37.65Banks are no longer a long . They are rotating out of banks into Tech
Daily looks good nice engulfing candle, stoch pretty
look vol more selling buying
Weekly starting roll but still above 80%. I am early on weekly.

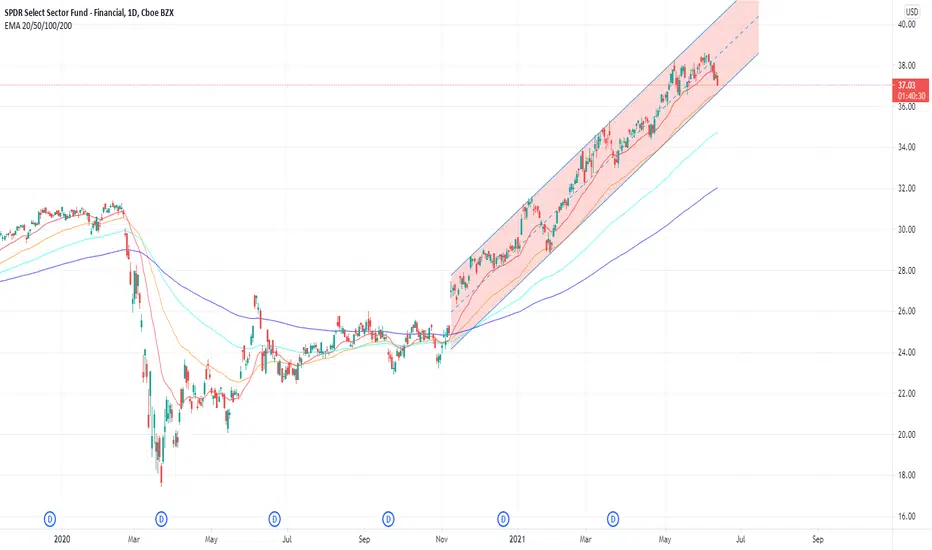
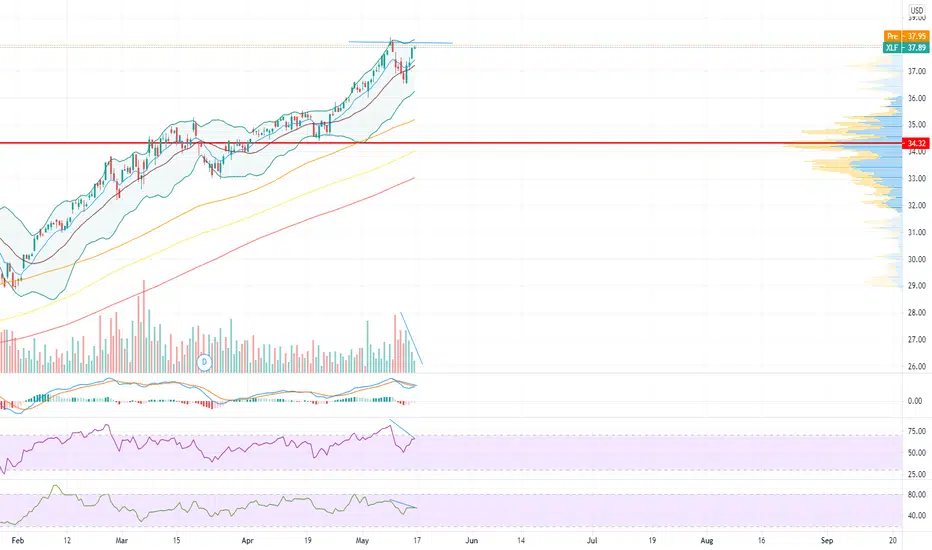
XLF Forecast XLF broke out of multi year resistance level at $29~ After multiple failed attempts. Typically resistance levels become support zones after prices goes thru them. I’m watching current trend for any weakness that could indicate possible move to retest $29.
On weekly chart PPO EMAs have crossed, but week is not over yet. It’s 3rd time this year this cross attempted to happen. If week closes with EMAs being crossed, it would indicate weakness of the trend’s momentum. Interestingly $29 is currently at .5 fib level since 2020 lows.
XLF long @ 37.00Daily stoch great new high and nice uptrend absolutely beautiful
We need is some VOL
Weekly looks great can we get 40 maybe

#XLF: Financial names look strongI like the setup here for some quick gains in this ETF. Downside risk is very low compared to potential upside within the next 10 days give or take.
Longer term this could go higher, value stocks are strong in general due to inflation concerns and the reopening momentum.
Best of luck if taking this trade.
Cheers,
Ivan Labrie.

Long XLF 37.91They are going to print another 8 Trillion
So Imho banks gonna run
Daily looks good nice up trend
Weekly looks good up trend
so close breaking out
See we can get 39
XLF and others might lead the wayAs noted in my previous ideas about $SPY (bearish), $XLF, $XLI, $IWM, $XLE might be the catalyst that leads the markets higher. $XLF tapped the 8day EMA twice before going back to positive which to me shows resilience with a market that has no sense of direction. A nice hammer doji before breaking off into Memorial Weekend. XLF might try and tap the upper band (38.50 - 39) before fading back to middle channel.

Short XLF @ 37.84 high risk tradeDaily running out steam
see if that stoch turns down
Weekly says tired but up above 80%
I am short small shares with a stop
I am early

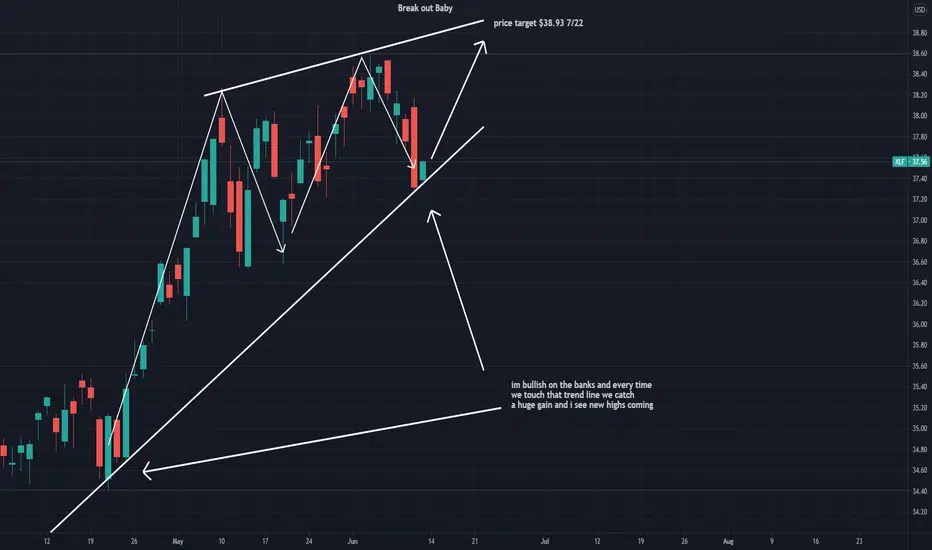
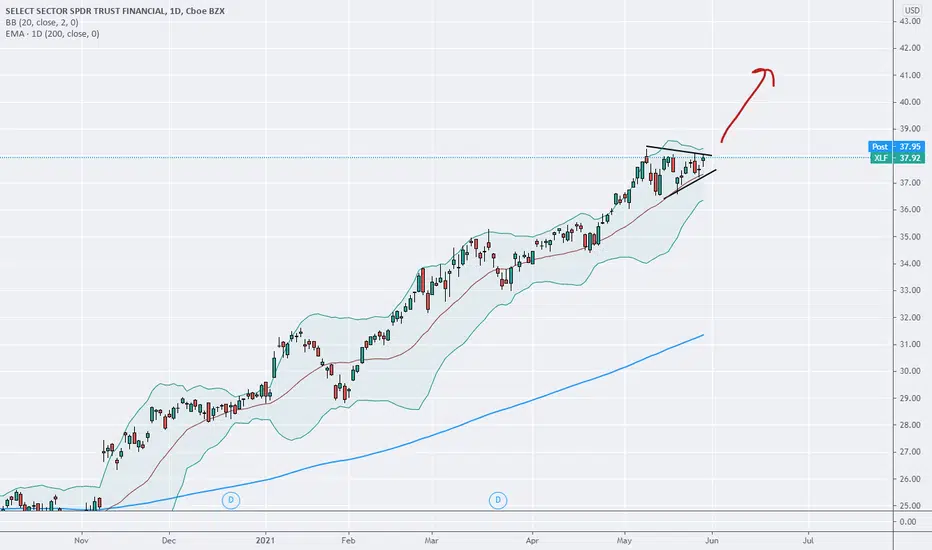
Financial Sector About To Break Out (XLF)I see a clear bullish triangle breakout formation on XLF, which is currently a leading sector in the S&P500 (with regard to relative strength).


XLF Short Round 2: Do You Believe in Second Chances?Upset that you weren't set up for the first drop that occurred last week? Well lucky you the market loves to trap people and right now XLF is in a bull trap (in my opinion of course) which has brought it back close to its all time highs. Massively overbought on the weekly and we ended with a big volume red hammer candle on the weekly. On the daily we have moved almost 2 dollars in 2 days with volume completely dying out on 5/14. On the hourly and daily we are almost back to our highs at around 38 with much lower MACD, RSI and VOLUME. Expecting a last push up over 38 for a few minutes on 5/17 then the beginning of a drop that will last 3 weeks. The XLF has been one of the sectors keeping SPY up when QQQ was selling off. The Qs have finished most of their selling but SPY has rebounded back going back up almost 2.5% in 2 days (a pretty significant move for SPY). There are so many sectors that are in the same spot as XLF. Helping to keep SPY up while the Qs sold off. XLE (energy), XLV (healthcare), XLI (industrials), XLP(staples), ARE ALL IN THE SAME BOAT WITH THE EXACT SAME CHART ALMOST. SPY and all these ETFs showing bearish sighs leads me to believe we are still in for bearish activity for the next 2 to 3 weeks for the overall market. Out of all of these etfs, XLF offers the lowest options spreads between bid and ask.
PT: Price comes back to next high volume VPVR range which is around 35.5. Also the 4 hour 100 ema can possibly bounce the price in the following days.
OVERALL: EXPECTING A SELL OFF THEN WE CONTINUE BACK TO ALL TIME HIGHS
ENTRY: BELOW 37.5
PT: 37.5-35.5
STRIKE: 36.5
DATE: JUN 11

XLF Bearish RSI DivergenceMarket leadership has clearly passed to the FAANGMAN group. Being deep long here is dangerous imo.

Major pullback expected in financialsI see an easy 10%-15% downside risk opening up in XLF. I have taken a short position via 34 strike price puts for may 21 expiry. My target is 31 to close position and will consider going long @ 29 level.

