Alibaba - A remarkable reversal!🛒Alibaba ( NYSE:BABA ) reversed exactly here:
🔎Analysis summary:
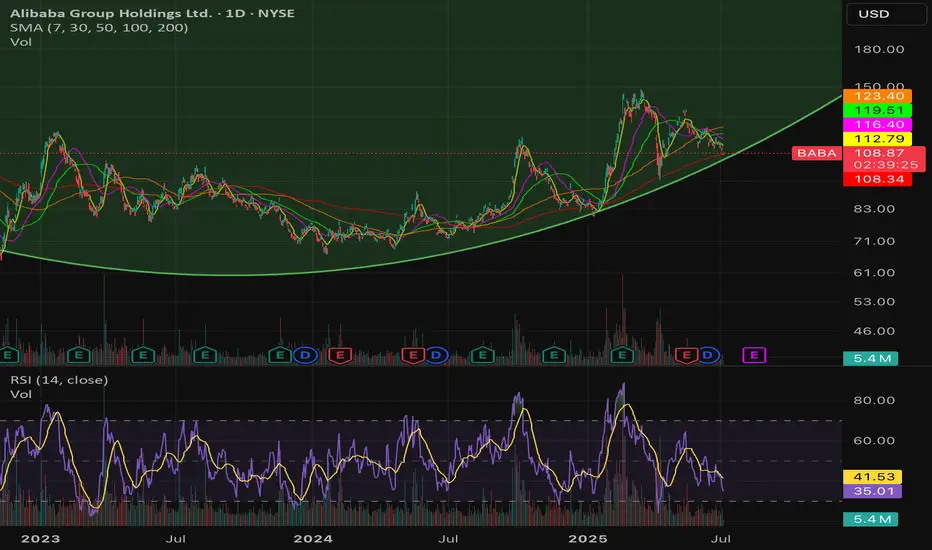
Recently Alibaba has perfectly been respecting market structure. With the current bullish break and retest playing out, there is a very high chance that Alibaba will rally at least another +20%. But all of this chart behaviour just looks like we will witness a major bottom formation soon.
📝Levels to watch:
$110, $135
🙏🏻#LONGTERMVISION
Philip - Swing Trader
AHLA trade ideas

BABA longPotential double bottom to be formed on the Weekly TF.
I think well into Aug and Sept, this will mature.
$143 is a key price value zone.

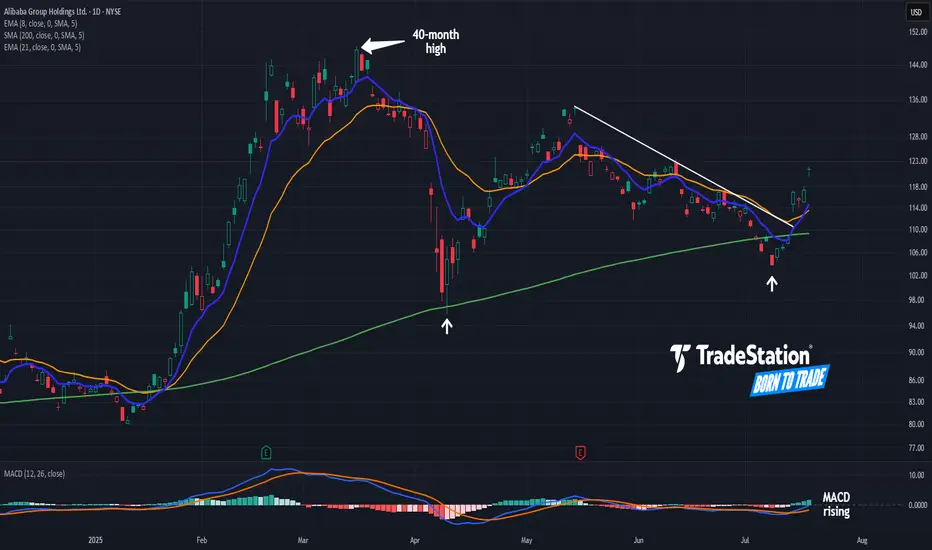
Alibaba Breaks a TrendlineAlibaba began 2025 with a big rally. Now, after a long pullback, some traders may see further upside in the Chinese tech giant.
The first pattern on today’s chart is the pair of higher lows (marked with white arrows) along the rising 200-day simple moving average. Those may reflect the development of a longer-term uptrend.
Second, BABA peaked above $148 in March. It was the highest price since November 2021. That may suggest a long-term downtrend is fading.
Third is the series of lower highs in May and June. The stock broke that falling trendline this week, a potential sign of improving price action in the short term.
Next, MACD is rising and the 8-day exponential moving average is nearing a potential cross above the 21-day EMA. Those could be viewed as further positive short-term signals.
Finally, BABA is an active underlier in the options market. (Volumes have averaged more than 200,000 contracts per session in the last month, according to TradeStation data.) That may help traders take positions with calls and puts.
TradeStation has, for decades, advanced the trading industry, providing access to stocks, options and futures. If you're born to trade, we could be for you. See our Overview for more.
Past performance, whether actual or indicated by historical tests of strategies, is no guarantee of future performance or success. There is a possibility that you may sustain a loss equal to or greater than your entire investment regardless of which asset class you trade (equities, options or futures); therefore, you should not invest or risk money that you cannot afford to lose. Online trading is not suitable for all investors. View the document titled Characteristics and Risks of Standardized Options at www.TradeStation.com . Before trading any asset class, customers must read the relevant risk disclosure statements on www.TradeStation.com . System access and trade placement and execution may be delayed or fail due to market volatility and volume, quote delays, system and software errors, Internet traffic, outages and other factors.
Securities and futures trading is offered to self-directed customers by TradeStation Securities, Inc., a broker-dealer registered with the Securities and Exchange Commission and a futures commission merchant licensed with the Commodity Futures Trading Commission). TradeStation Securities is a member of the Financial Industry Regulatory Authority, the National Futures Association, and a number of exchanges.
Options trading is not suitable for all investors. Your TradeStation Securities’ account application to trade options will be considered and approved or disapproved based on all relevant factors, including your trading experience. See www.TradeStation.com . Visit www.TradeStation.com for full details on the costs and fees associated with options.
Margin trading involves risks, and it is important that you fully understand those risks before trading on margin. The Margin Disclosure Statement outlines many of those risks, including that you can lose more funds than you deposit in your margin account; your brokerage firm can force the sale of securities in your account; your brokerage firm can sell your securities without contacting you; and you are not entitled to an extension of time on a margin call. Review the Margin Disclosure Statement at www.TradeStation.com .
TradeStation Securities, Inc. and TradeStation Technologies, Inc. are each wholly owned subsidiaries of TradeStation Group, Inc., both operating, and providing products and services, under the TradeStation brand and trademark. When applying for, or purchasing, accounts, subscriptions, products and services, it is important that you know which company you will be dealing with. Visit www.TradeStation.com for further important information explaining what this means.
BabaPrice has formed a pretty big bullish wedge here.
In the next 2weeks I expect baba to push back up and close gap at 115..
From there we could pullback to retest falling wedge or push higher ..
This wedge should push baba back to close gap at 160 minimum

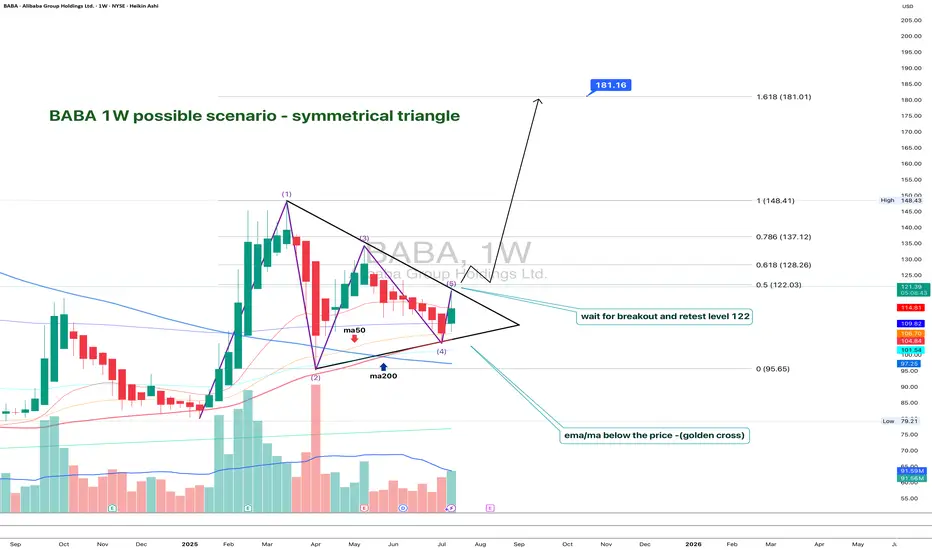
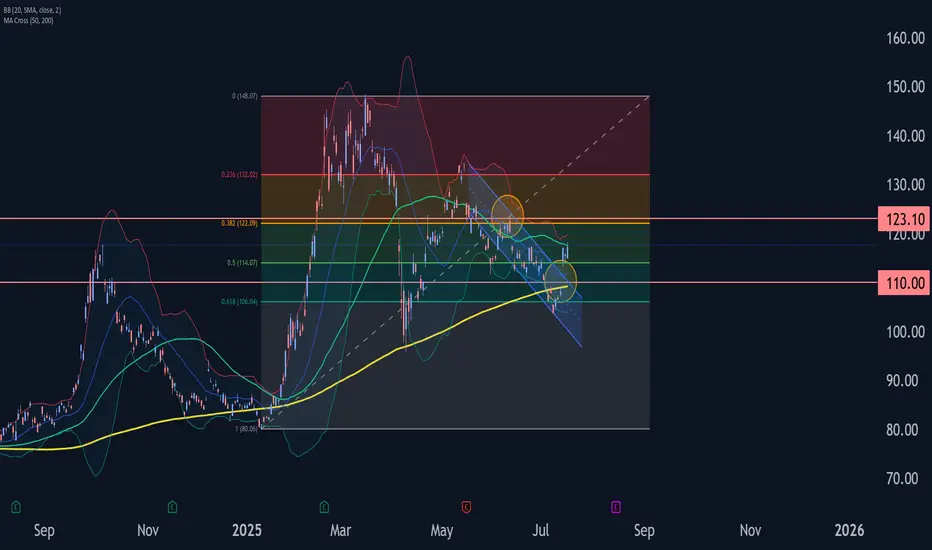
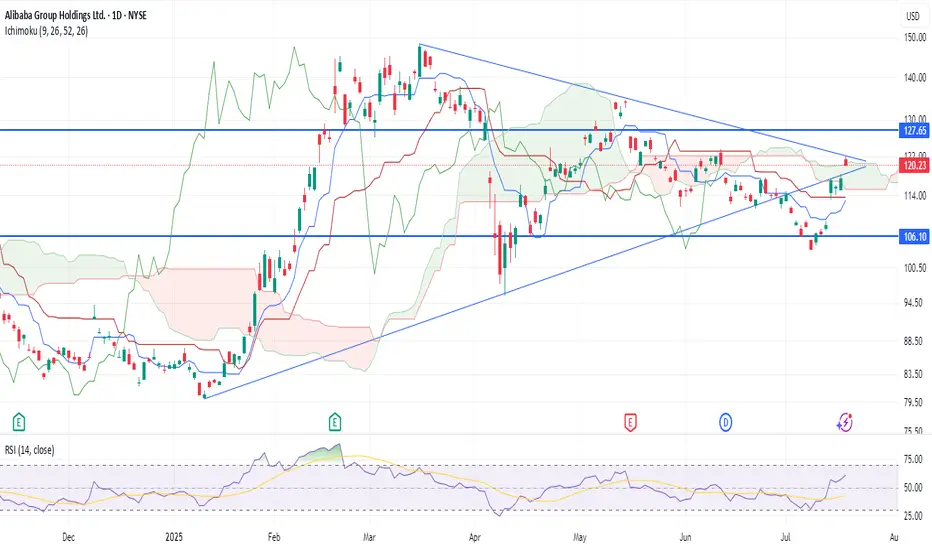
BABA: triangle with tensionOn the weekly chart, BABA has already formed a golden cross - price is above both MA50 and MA200, confirming a bullish trend shift. The stock is now approaching the upper edge of the symmetrical triangle and the key resistance at $122, which also aligns with the 0.5 Fibonacci level.
The numbers inside the triangle represent the contraction phases, not Elliott waves. This is a classical consolidation before a potential breakout. If the $122 level is broken and retested, upside targets are $128 (0.618), $137 (0.786), and eventually $148–181 (1.0–1.618 extension).
Volume is rising, MACD is flipping bullish, and RSI is climbing out of oversold territory — all signs point to growing bullish momentum.
Fundamentally, Alibaba benefits from China's economic rebound, possible regulatory relief, and ongoing share buybacks. With Chinese tech rotating back into favor, BABA could lead the rally.
So if you're still waiting for a signal - it's already here. The golden cross is done, price is flying above moving averages, and all that’s left is a clean breakout. Watch $122 — that’s the launchpad.
$BABA 160+ before year end looks realistic thanks $NVDA- NASDAQ:NVDA export ban lifted for China will be beneficial for NASDAQ:NVDA for sure but main advantages would be for NYSE:BABA as they can get the shovels from the shop as well so that they can compete in Gold Rush and compete with NASDAQ:GOOGL , NASDAQ:META and other private companies like Open AI and Anthropic.
- There are good universities in China and NYSE:BABA is regional big tech in China which gets great talent. I'm confident that NYSE:BABA would be able to compete with NASDAQ:META & NASDAQ:GOOGL in building LLMs even better with this export ban lift.
- Long NYSE:BABA and short/avoid NASDAQ:META ( overvalued )

BABA: What are you seeing on this chart?BABA:
.
What are you seeing on this chart?
A perfect shakeout.
Smart money has joined at the bottom.
What's next?
.
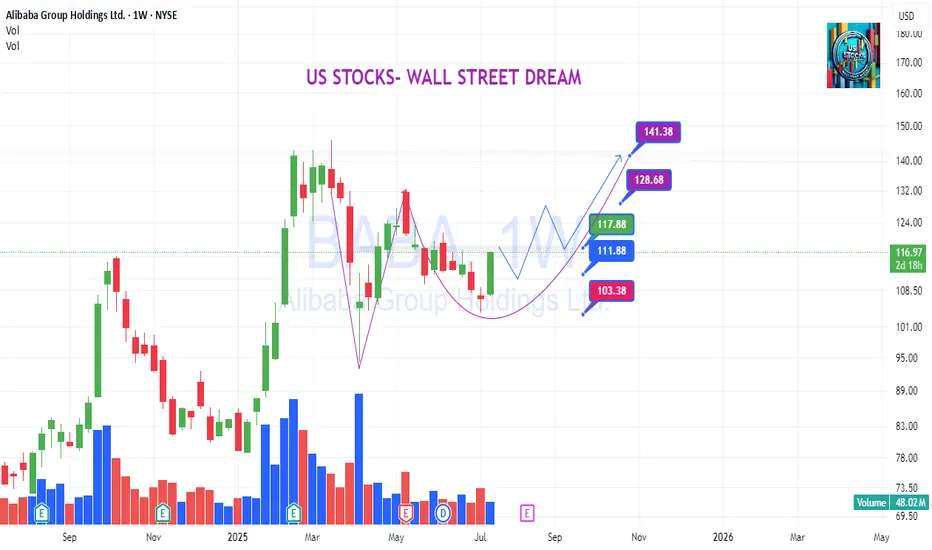
US STOCKS- WALL STREET DREAM- LET'S THE MARKET SPEAK!
BABA – Dollar Cost Averaging Opportunityhi Traders,
Let's have a look at BABA.
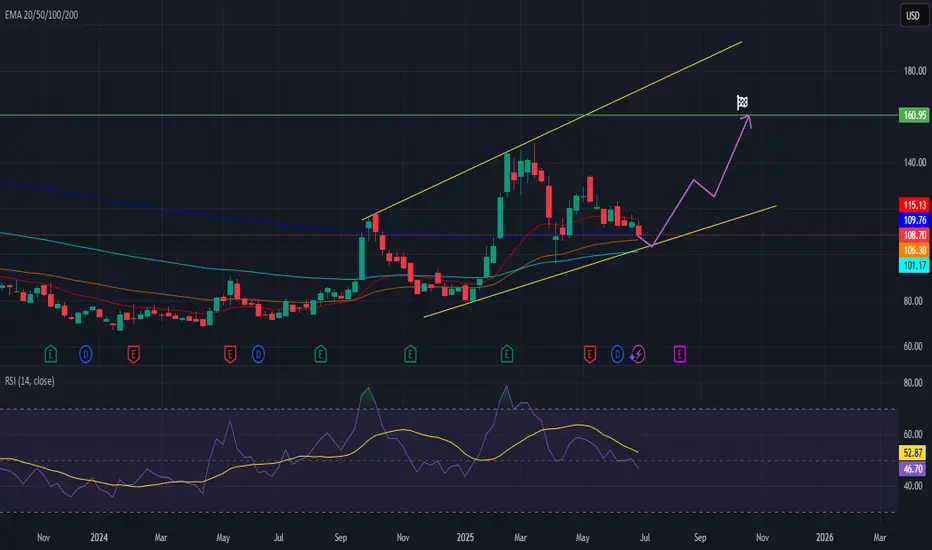
Alibaba (BABA) appears to be approaching the end of its correction phase within a well-defined ascending channel. Based on the current price action and technical setup, we believe now is a good time to begin dollar cost averaging into this stock.
Our identified buy zone lies between $108 and $100, where price intersects the lower trendline support and key EMAs (20/50/100/200). This area offers a strong risk-reward setup for medium- and long-term investors.
The mid-term target for this trade is $160, which aligns with the upper channel resistance and previous price structure. However, from a long-term perspective, we anticipate that BABA will resume its growth trajectory and eventually surpass its previous all-time highs.
Supporting this idea, the RSI is stabilizing in neutral territory, suggesting that momentum is resetting and may shift bullish as price finds support.
Summary:
🔁 Strategy: Dollar cost averaging
🟩 Buy zone: $108 – $100
🎯 Mid-term target: $160
🚀 Long-term view: Return to growth and new ATH
📉 Correction nearing completion; bullish structure remains intact
This setup offers an attractive entry point for patient investors aiming to ride the next major upside cycle in Alibaba.
$BABA don’t miss this milky bottle. Called this out at $105 in minds. This Monthly declining volume, support at $100, and uptrend pattern. China will boom into the end of Q3 and early 2026. Target is $180 and $200.
WSL.

Alibaba Group Wave Analysis – 17 July 2025
- Alibaba Group rising inside impulse wave (3)
- Likely to reach resistance level 123.10
Alibaba Group recently rose with a sharp upward gap, breaking the resistance level 110.00 and the resistance trendline of the daily down channel from May.
The breakout of these resistance levels accelerated the active intermediate impulse wave (3).
Alibaba Group can be expected to rise to the next resistance level 123.10 (the former monthly high and top of wave B from June).
JADE LIZARD Trade for an Aug 8th expirationCredit ~$300
+1 $110 Call 8/8
-1 $109 Call 8/8
-1 $101 Put 8/8
AT EXPIRATION:
PRICE > $110 = profit of $200
PRICE between $101-$109 = profit of $300 (max)
PRICE < $101 = Assigned to purchase 100 shares of BABA @ $98 per share, (avg cost).

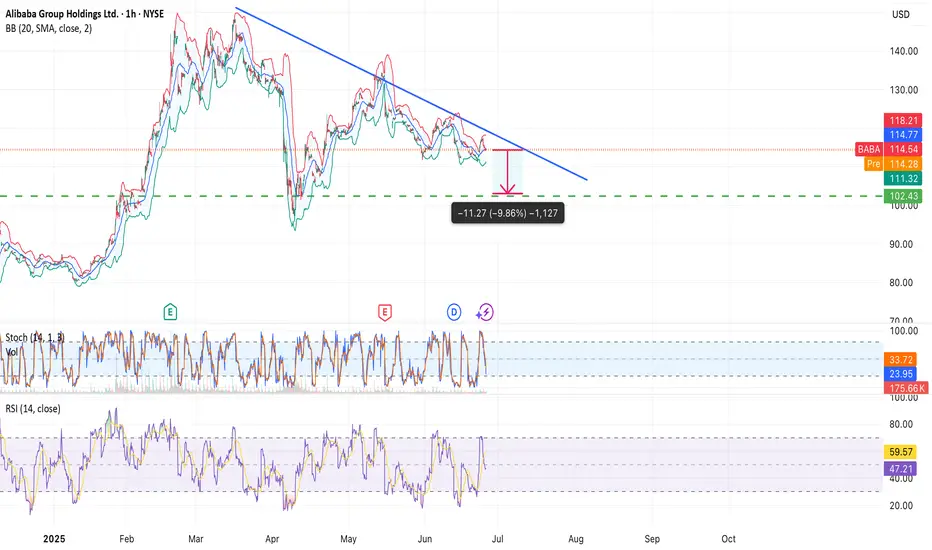
Alibaba (BABA) – Bearish Setup FormingNYSE:BABA
A descending triangle is forming on the chart, with strong resistance around $118 and horizontal support near $102. The structure suggests a potential breakdown, targeting a move of ~−9.8%.
Key observations:
• Price rejected from the descending trendline multiple times
• Stochastic turning down from the overbought zone
• RSI below 50 – room for further downside
• Bollinger Bands show compression, possibly preceding a breakout
📉 Business context:
Alibaba is facing ongoing challenges in its core business. Competition in the e-commerce and cloud sectors has intensified, import/export tariffs are putting pressure on margins, and regulatory oversight from Chinese authorities remains strict. These headwinds may weigh on investor sentiment and stock performance.
My short scenario:
If the price breaks below the $111–$110 zone with volume confirmation, I expect a move toward $102–$100.
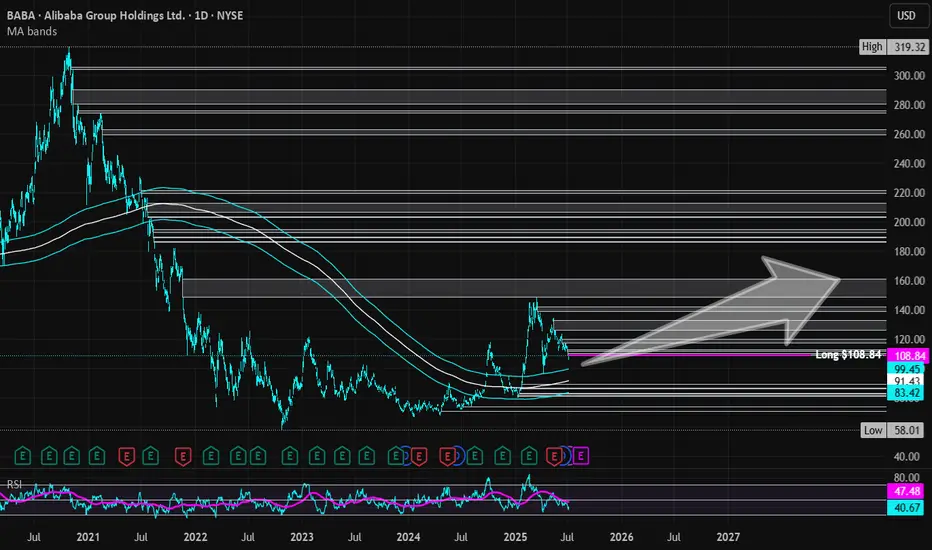
Alibaba | BABA | Long at $108.84Like Amazon, I suspect AI and robotics will enhance Alibaba's NYSE:BABA e-commerce, logistics, and cloud computing operations. There is some risk here, like other Chinese stocks, that they could be delisted from the US market if trade/war tensions rise. But I just don't think that is likely (no matter the threats) due to the importance of worldwide trade and investment. I could be way wrong, though...
NYSE:BABA has a current P/E of 14.2x and a forward P/E of 2x, which indicates strong earnings growth ahead. The company is very healthy, with a debt-to-equity of 0.2x, Altmans Z Score of 3.3, and a Quick Ratio of 1.5. If this were a US stock, investors would have piled in long ago at the current price.
From a technical analysis perspective, the historical simple moving average (SMA) band has started to reverse trend (now upward), indicating a high potential for continued (overall) price movement up. It is possible, however, that the price may reenter the SMA band in the near-term - the $80s aren't out of the question - as tariff threats arise. But that area is another personal entry zone if fundamentals hold.
Thus, while it could be a bumpy ride and the risk is there for delisting, NYSE:BABA is in a personal buy zone at $108.84 (with known risk of drop to the $80s in the near-term).
Targets into 2028:
$125.00 (+14.8%)
$160.00 (+47.0%)
BABA is a BUY BUYDowntrend break in play, wedge forming. We should break through resistance of 128 and test all time highs in high $140's in the next few weeks
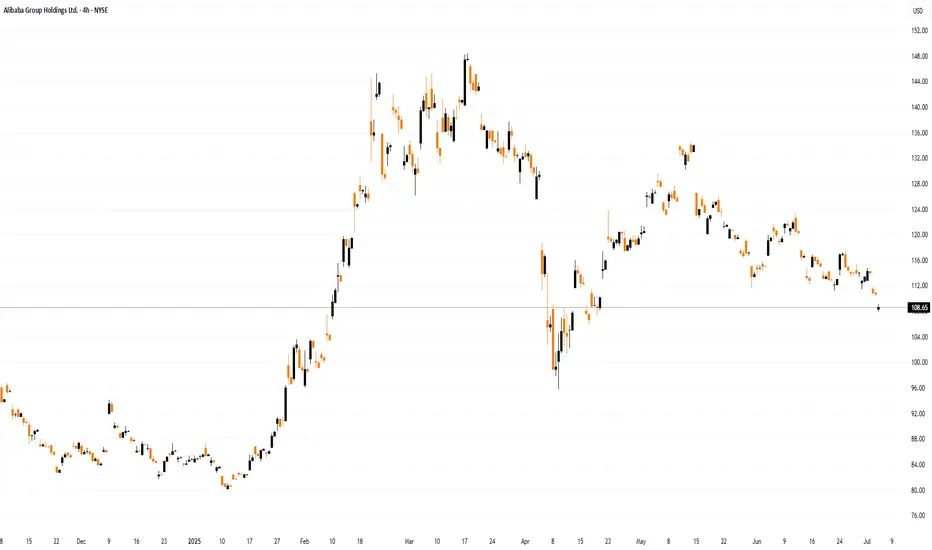
Alibaba (BABA) Shares Fall to Lowest Level in 2.5 MonthsAlibaba (BABA) Shares Fall to Lowest Level in 2.5 Months
Yesterday, Alibaba (BABA) shares dropped to their lowest level since late April. The decline followed the company’s announcement of a planned bond issuance totalling approximately $1.53 billion, with a maturity date set for 2032. The funds will be used to support the development of Alibaba's cloud infrastructure and expansion of its international e-commerce business.
The market’s negative reaction may stem from concerns over rising debt levels and the potential return on these investments.
Technical Analysis of Alibaba (BABA) Share Price
When analysing the price movements of BABA shares in 2025, two key trading ranges stand out:
→ $126–145: This range originates from the long bullish candle on 20 February, following the release of a strong quarterly report;
→ $96–103: This zone was established in late April, as supply and demand stabilised around the psychologically significant $100 level.
The upper range has since acted as a resistance zone, with the price reversing from it in mid-May. The lower range has served as a support area, particularly in early April when the stock came under pressure after tariff-related headlines.
The current price action is notable in that Alibaba shares have:
→ Broken through the June support level at approximately $111.92;
→ Formed a bearish A-B-C structure, marked by lower highs and lower lows.
Using Fibonacci extension analysis, we can reasonably assume:
→ The $111.92 level is now likely to act as resistance;
→ The next potential target for the ongoing downtrend (leg C→D) lies at the 1 Fibonacci level ($100.55) — aligning closely with the previously identified support zone.
This article represents the opinion of the Companies operating under the FXOpen brand only. It is not to be construed as an offer, solicitation, or recommendation with respect to products and services provided by the Companies operating under the FXOpen brand, nor is it to be considered financial advice.
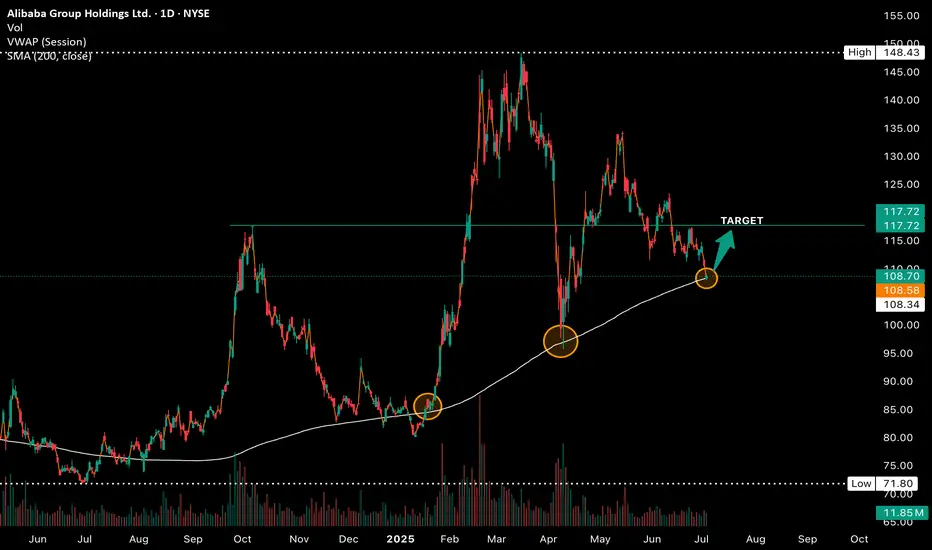
BABA: Testing Daily 200 SMA on Falling Wedge; Gimme Bounce Here!Baba is approaching the key level of the 200 SMA, a zone where price has respected and bounced sharply off in the past! What's crucial to note is this is occurring off of a falling wedge pattern, and RSI in the 30s showing oversold conditions.
- Calling 108 as an interim bottom here
- Looking for 117.7ish as the next leg towards where price is headed
P.S: This name is very undervalued financially with many analysts placing a fair value of around 145 or so, BABA is buying back shares, and inking new customer centric deals/partnerships
I like the risk to reward of going long here!
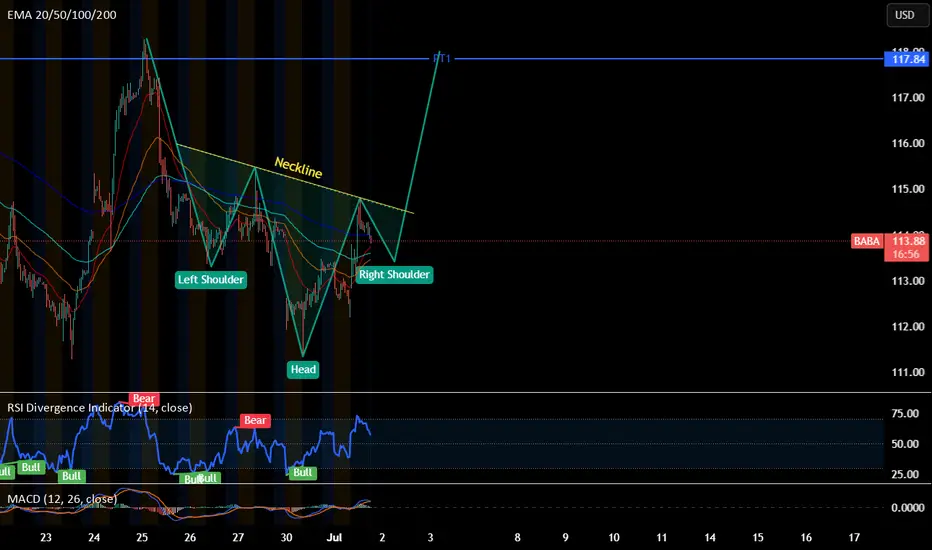
Call - BABADaily Chart Pattern : Falling Wedge
30 Min Chart Pattern : Head and shoulders. Forming right shoulder.
Enter call if it breaks neckline at $114.60 & monitor for a re-test
Stop loss if fails to re-test at ~$114
PT1: 117.84
Potential to retest ~$123.3. Will update after breaking PT1
Long $BABA - NYSE:BABA is testing 200 SMA
- NYSE:BABA moves are explodes higher then cools then retest support then explodes higher than the last high. It's called trading with higher wavelength
-> Move 1: Started April 2024 when the trend reversal started. $68 -> $89 with around +30% then retraced $90 -> $72 ( -20% )
-> Move 2: July 2024, $72 -> $116 (+61%) then retraced $116 -> $80 ( -31% )
-> Move 3: Jan 2025, $80 -> $146 (+ 82.5%) then retraced $146 -> $108?? ( correction underway ) ~ -26% so far
-> Move 4: Likely from $100-105 to $180-200
Alibaba on the lower upward trend lineAlibaba is on the upward trend line after years of a downward trend. The AI business is booming. The fundamentals speak for themselves. The price/earnings ratio for 2025 is around 12 and is on Value level. The conflict with the Chinese party seems to have improved. The company is buying back shares. I have therefore increased my long position today
How to use chart to determine your DCA strategyLooking at the monthly chart of Alibaba, it is unfortunately not out of the woods , yet ! Yes, there has been a slew of good news, government support, foreign investors pouring money into the big tech of China, etc. But, little does this move the bullish needle.
The yellow circle shows a bearish pin bar and if it is supposed to work as it says, then I am looking at 95 price level to accumulate. Of course, there are others who prefer to average on a monthly basis, no matter what the price is. Good for you !
For me, I can deploy my funds to other promising assets like Gold , EURUSD ,etc.
It is a challenge for some traders/investors that they have to part off with their money every time they read the news, see a chart or have a discussion with friends, as if they are afraid of missing out (FOMO).
Relax, the market always give you opportunities to enter the market .

here is the #chart for $BABA Bullish with short-term caution. Alibaba ( NYSE:BABA ) is at $114.08, up 0.13% daily but down 2.92% monthly, as shown in the finance card above. X posts reflect bullish sentiment, citing a breakout above the 200-week moving average and a potential move toward $168-$183.13, driven by strong AI/cloud growth (triple-digit AI revenue for seven quarters) and share repurchases (15.2M shares canceled in May 2025). Analysts rate it a "Strong Buy" with a $153.62 target (34.6% upside). However, technicals show resistance at $120.63-$123.90 and a bearish wave correction, with support at $113.32-$116.54. Tariff risks and a mixed options sentiment add volatility. A break above $120 could target $127; otherwise, a pullback to $113 is possible
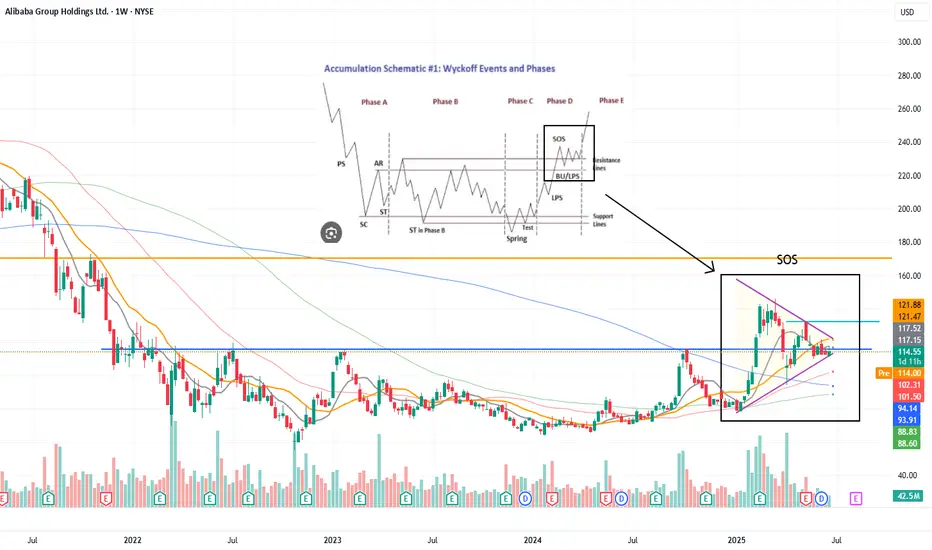
SOSPrice completing SOS phase of Wyckoff accumulation
Symmetrical triangle almost reached the break point and a strong move will soon happen
I expect an upward move but always set a stop loss to protect your money
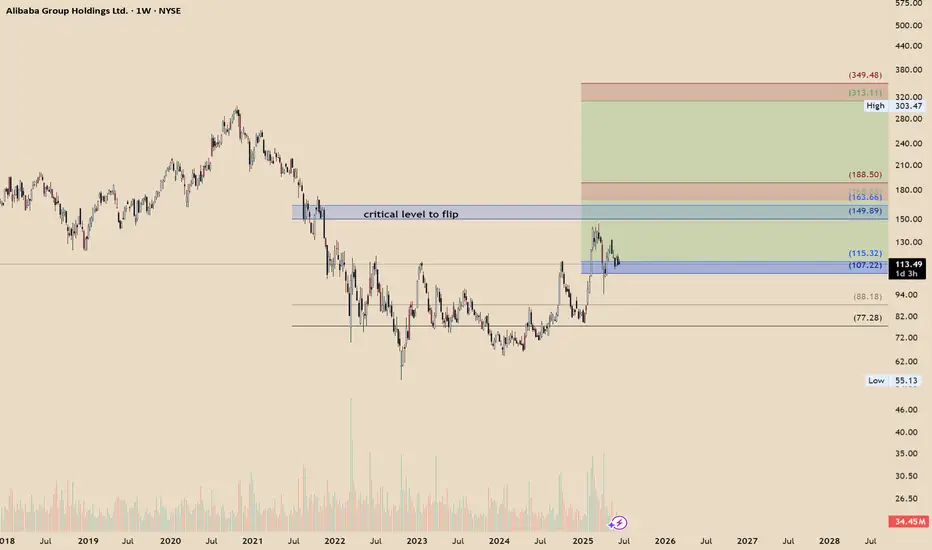
BABA undervaluedHello
BABA has invalidated any corrective attempts due to its price action — a 3-month bullish breaker is in play, and the price has yet to test the first level of algorithmic targets around 163–168.
There’s also a critical level to flip near 149, and I’m fairly confident it will be reclaimed if market conditions permit.
NFA