Possible Breakout Alert: Barrick Gold (B) - Inverse H&S in Play🚨 Possible Breakout Alert: Barrick Gold (B) – Inverse H&S in Play 🚨
Barrick (NYSE: B) looks poised for a technical breakout from a well-formed inverse head & shoulders pattern that’s been building for months.
Key Levels:
Neckline: ~$20.90–$21.13 zone now being tested
Breakout Target: $24.50+
Support Zones: $19.50 / $18.22 / $17.48
Confluence:
RSI has reset and is curling up
Volume is rising into resistance
Price reclaiming key MAs
Macro tailwinds in the metals space
📈 My Positioning:
I built into this move over time, scaling in during flushes. Current options exposure:
Jan 2026 $15C – Already deep in the money
Jan & Dec 2026 $20C – Showing strong gains
Dec 2026 $35C – Long-dated lottos for a gold breakout scenario
The structure is there. The setup is clear. All eyes on the weekly close. If B starts clearing $21.13 with authority, this could run quickly.
Sometimes the best trades are the ones you quietly build while everyone else is distracted.
#Barrick #GoldStocks #HNSBreakout #TechnicalAnalysis #Metals #OptionsTrading #TradingView
B trade ideas

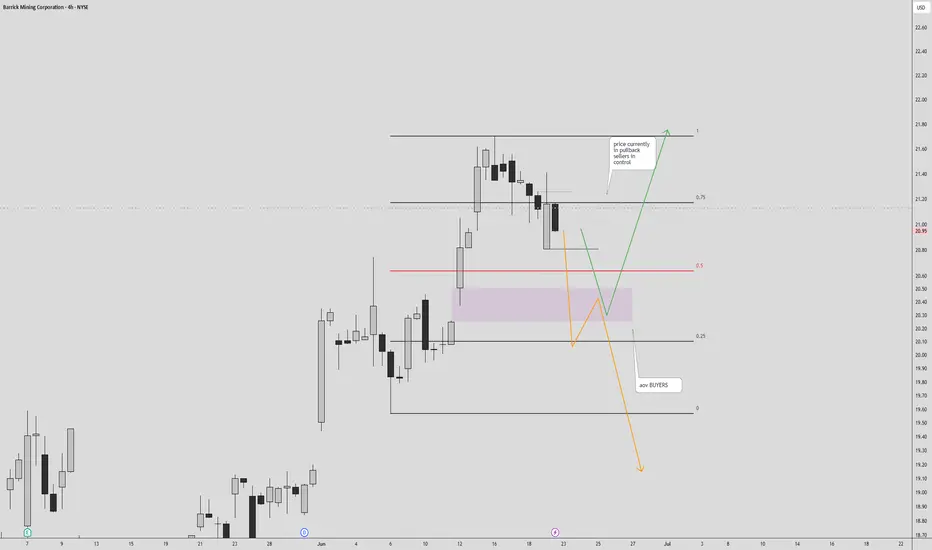
Bearish trend looking for 4H price is in pullback and anticipating price to continue lower until AOV , interested how price to reach this area of value if this area is respected then will be looking to buy , but if this area is violated then i would prefer to continue selling .. lets wait how it goes
The Pattern That Could Launch BitcoinSpotted a long-term inverted head & shoulders pattern forming over a 7–8 month stretch on Bitcoin — much more reliable than short-term setups. If this bullish structure plays out, we could be looking at a breakout that pushes BTC firmly into price discovery.
I’ve included local Fibonacci levels on the chart, though I couldn’t fit the macro one (going from $4k → $69k → $15k — the 1.618 extension of that larger swing lands at $119,800. That could be a key resistance target if we clear the ATH and continue the uptrend. After that, there's the smaller timeframe, but more recent, fib ext 1.618 sitting at $131k.
I'd be very cautious of a failed pattern if $101k doesn't hold. As a last support, 95k and the red 20EMA might hold.
Let’s see how this plays out 🚀
Atleast 3x your moneyAlright, this is getting set to fly high now. Catching with gold and other commodities. All the best !!

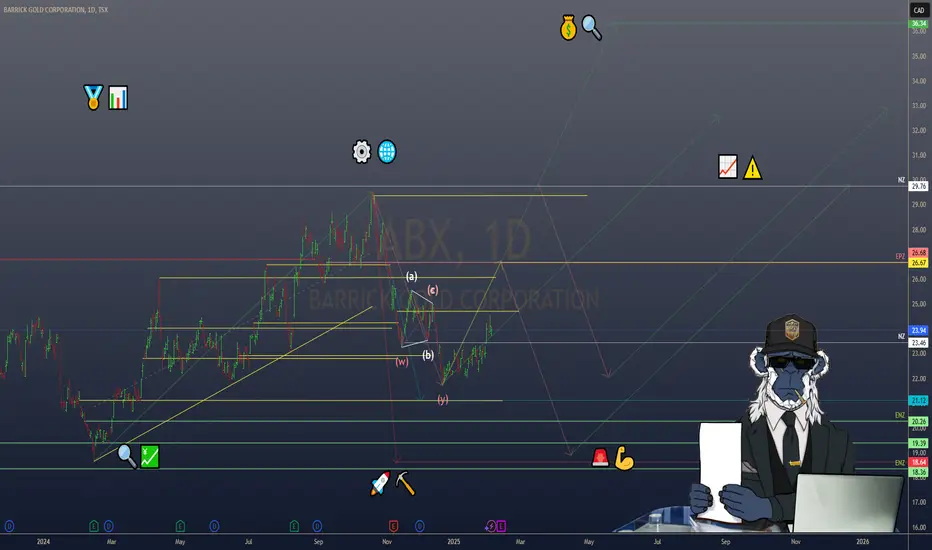
Barrick Gold Corporation ($ABX): Golden Opportunity or Risky
Barrick Gold Corporation (ABX): Golden Opportunity or Risky Prospect? 🏆💰
1/10
Barrick Gold TSX:ABX has seen a solid financial performance recently. EPS for the last quarter hit C$0.42, with next quarter estimates at C$0.63. They beat estimates 75% of the time in the past year. 📈
2/10
Analysts are bullish! The average price target is C$33.57, implying a potential upside of 50.13% from the current C$22.36 price. Strong Buy ratings dominate: 10 Buy, 2 Hold. 🔍 What do analysts know that the market doesn’t?
3/10
However, ABX is facing operational challenges. A suspension in Mali due to government intervention highlights geopolitical risks in mining. 🛑 Regulatory challenges are part of the gold mining game.
4/10
Stock price check: ABX currently trades at C$23.15. That’s 20.94% below its 52-week high of C$29.28 but 21.59% above its low. What does this tell us? Room for recovery, but risks loom. 📊
5/10
Valuation time! Compared to sector peers, Barrick offers an attractive price level, especially given the 50% upside target. Analysts love undervalued plays like this, but what about the risks? 🤔
6/10
Strengths: Barrick operates across multiple countries, ensuring diversified production. That’s crucial in a volatile gold market. 🌍 Diversification is a key defensive strategy here.
7/10
Challenges: High operational costs are always a concern. Pair that with political instability, like the Mali suspension, and ABX faces a steep uphill climb. 🏔️ How much risk are you willing to take on?
8/10
Opportunities: Expansion is always on the table. With gold prices looking stable, Barrick could capitalize on new projects or mines. But timing matters in this market. ⛏️
9/10
Threats: Regulatory and political risks never sleep. Changes in mining laws or political unrest can hit Barrick hard—Mali’s situation is a prime example. Always know your risks. ⚠️
10/10
What’s your take on Barrick Gold TSX:ABX ? Will it strike gold again? Vote here! 🗳️
Buy for the long term 📈
Hold and watch growth 🔄
Too risky, avoid 🚫
Barrick Gold Technical setup on the weeklyHello guys!
Barrick Gold on the weekly looks pretty bullish. In context of Gold rising, there is no telling where Gold could top out. It's RSI keeps making higher highs and canceling most bearish divergences, and so I think Gold's prices could remain elevated for years to come.
Barrick Gold (strong buy) I want you guys take a look at some things real quick
Current Environment Macro Landscape:
Defensive + Hard Assets -
Gold, Miners, Energy, Real Estate (inflation hedges)
AI & Mega Cap Tech -
MSFT, NVDA, AMZN — inflows
China / Trade War Plays -
FCX, CAT, Global Industrials
Reflation / Commodity Rotation-
Oil, Copper, Uranium, Ag plays
gold:
safe haven play amid geopolitical risk and tariffs
Strong correlation with real interest rates + USD — lower rates + weaker dollar = bullish
Tariffs = inflationary = bullish for gold
Strong gold reserve base + relatively low AISC
copper:
1. China Tariffs = Industrial Policy Countermoves
If the U.S. imposes more tariffs on China, China could respond with stimulus or infrastructure spending — which increases demand for copper.
China is the world’s largest consumer of copper, and its response to tariffs often includes pro-growth policies.
2. Copper is Critical for EVs, Grids, and Renewables
Global push toward electrification, clean energy, EVs, etc., requires a massive amount of copper.
Demand is secular, not cyclical — even if tariffs temporarily suppress growth, the long-term demand curve is strong.
3. Tight Supply Outlook
Copper supply is constrained globally. Many copper mines are aging, with long lead times for new projects.
Barrick is developing world-class copper assets (e.g., Reko Diq in Pakistan — one of the largest undeveloped copper-gold deposits in the world).
lets not forget the most revenue being generated from operations comes from their Nevada mines.. US PRODUCTION
gold barrick isnt the only mining company money is moving to, take some thought into moving money to commodities

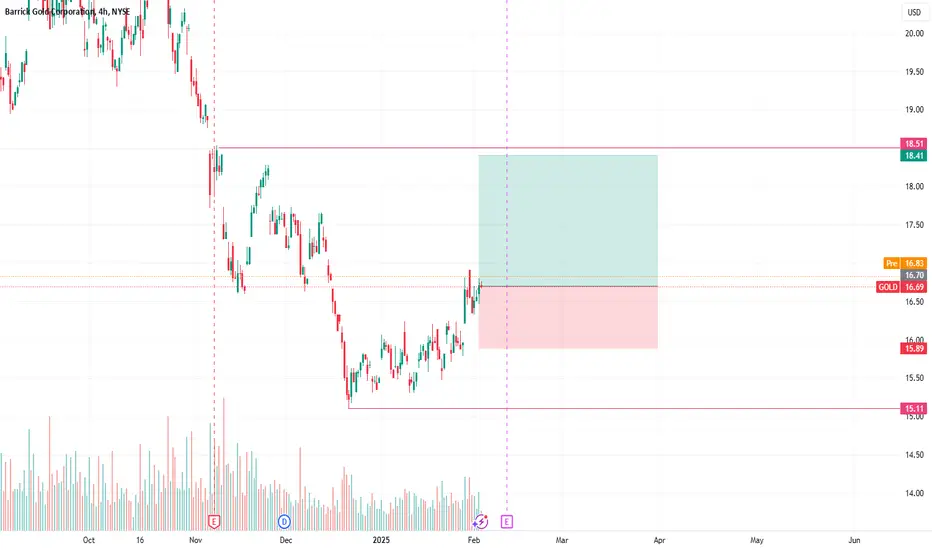
Long after earnings.Earnings Scenarios
Optimistic Scenario
Probability: 65%
Assumption:
The company will exceed EPS expectations (0.25 USD) due to increasing demand for gold as a safe-haven asset amid geopolitical uncertainties and inflation.
Market Reaction:
The stock price will rise to 18.5 USD (+10%).
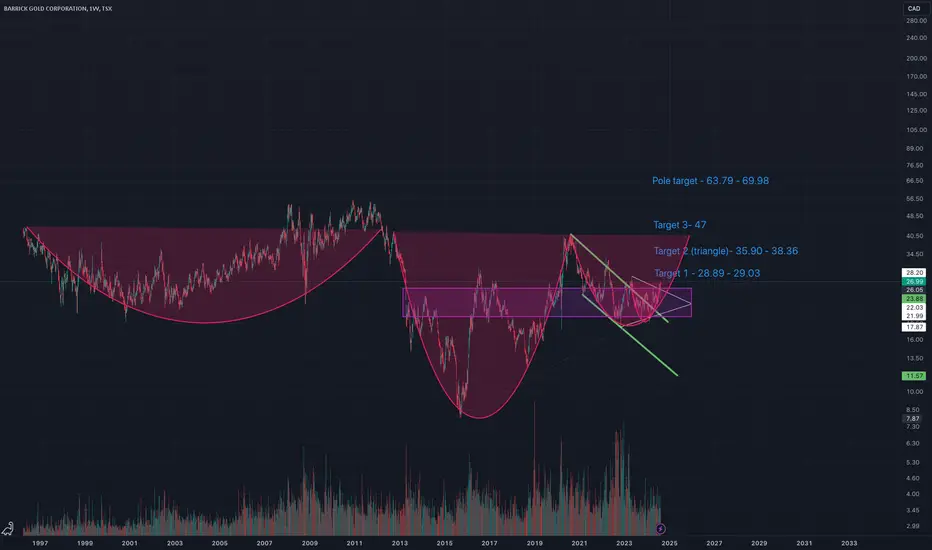
4x Triangle breakout on Golds rising tide Bullish chart
Looks like multi year triangle break out my guess is upside
It could break out and stop at a fib target so guess round number is 80 at fib =1
I am tracking about 22% increase from here to gold base metal target so this is 4x of that move which seems a lot can it do that in 2025 or will we need a bit longer. I don't know, lets wait and see its a multi year chart so muli year target
Equites look over valued generally so this may be a safe haven in any bear market because it holds many tonnes of gold as per 1929-1935 when in relative terms you had price increase with dividends over 25x in bear or 50x to '35 or 74x incld divi by holding the gold mining stock at the time, plus FDR revalued the gold price. Logic is still the same it will be a bumpy ride as gold is sold to pay margin calls but overall there is a lot of money which will need to be parked. As fund mngrs see gold as a value stock because relatively to the equity index's its not going down as much.
Gold in triangle breakout
CRB in triangle breakout (Commodities Index)
other Gold related mining stocks look very bullish too so confirmation across multiple shares and base metal index plus commodities index too
Good luck to all and wishing you a mighty fine day!
If later when you read this and its obvious by then we are in a bear and you dont know what to do this is a safe play for value fund mangers
Yes they will sell gold to meet margin payments at first then they will start to hold Gold relatively and this company has a lot of gold in the ground which should act as a store of value. So its going to be a bumpy ride
With multi year charts its hard to pinpoint breaks and get the timing right but the idea should be solid enough. A good pension play during difficult times.
You may even get over performance and it shoots up to round number 100 ? too early to tell
Also there are very long 100 yr / 40 year charts showing gold made a break out. Silver is also a play.
This is a well known name, you need to check if they have hedged the price of gold, but the chart says triangle so break out up or down, we take the upside bullish breakout.

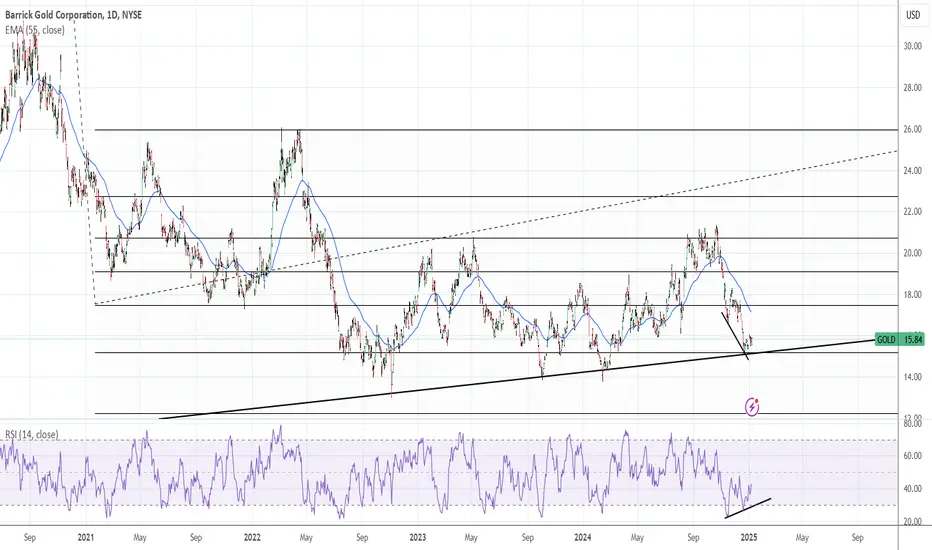
Bullish on BarrickYeah so, my purchases of GOLD in the past few years haven't tracked the gold price very closely. As leverage on physical gold it hasn't been such a good pick.
However, I am seeing some signs of a change in price-action. Daily RSI is showing higher lows, while price is testing everyone's patience :) making lower lows. Normally hints at a change in direction is coming up. If we get a lower low in price, but the RSI level fails to dip below the 30 level, see that as confirmation. May or may not get it.
On the fundamental side;
- Physical gold is way up and predicted by analysts to hit USD3000/Oz in 2025 - pretty bullish.
- GOLD's cost of production have increased significantly in the past few years, I hope they have or get a handle on that. But the present all-in cost is about (USD1320 - 1420/Oz) 1/2 of the current gold price level, leaving a decent profit margin.
- Annual report due in Feb 2025, quarterly performance shows steady quarter-on-quarter growth and consistent profitability.
- Earnings forecast for Q4 is about 50% above Q3 which should make 2024 a strong one.
- Seem to be well placed coming into 2025.
Will probably add more exposure to GOLD in the next month.
If $15.45 doesn't hold. Targeting $13.75 and $12.20 based on support. Happy if it goes down, happy if it goes up.
GOLD - Falling Wedge ABCD PatternGOLD has broken down from bearish rectangular consolidation. Prior to bearish rectangle, a falling wedge was formed from recent highs. Now it seems falling wedge is part of ABCD pattern, which means there is one more leg downwards to go.
In ABCD pattern, the size of the second move downwards is very much the same as first move (either in $ or % terms). The projected price of completion of this falling wedge with ABCD pattern is between 14 and 14.50 because this coincides with:
- a number of trendlines and major support zone from Weekly timeframe meet between 14 and 15
- gap fill is at 14.66
Also, if we look at price range of first wedge pattern drop, it was about 22% (from point A to B). With the formation of ABCD, the second wedge pattern price drop is also likely to be about 22% from point C to D of ABCD pattern.
Price is below SMA 20, 50 and 200
Buy around 14.50

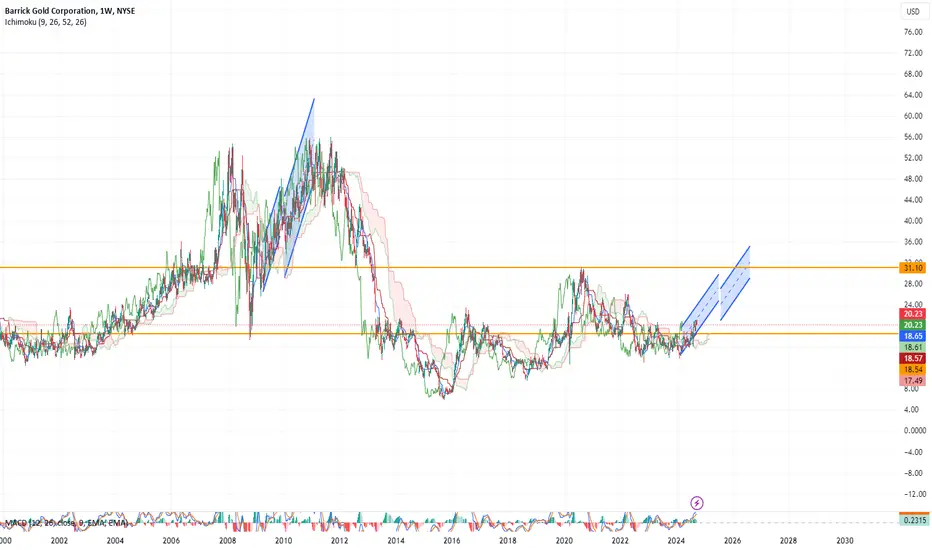
Barrick Gold Corporation to $3On the above 2 month chart price action has enjoyed a 340% rally from the $7 lows of 2016. A number of reasons now exist to take a bearish outlook.
1) Broken market structure printed in 2013. Confirmation of broken structure printed recently in March 2022 (yellow arrow).
2) Trend reversal. Lower high replaces higher high.
3) The rising flag pattern is undoubtably bearish for price action. The breakout printed on March 1st, the confirmation on May 1st. The flagpole extension measures out to 2 dollars and 50 cents.
Barrick Gold is undoubtedly recognised as one of the leading Gold miners out there with interests across the world. Gold enthusiasts are quick to point out the relationship between miners and advancing gold price action. That relationship now prints a significant bearish divergence (2 month chart below). I’ve discussed this in more detail on my website.
Is it possible Price action continues upwards? Sure.
Is it probable? No.
Ww
Gold / miner bearish divergence

Swing Trade On $GOLD (Barrick And Gold)Swing Trade On TVC:GOLD (Barrick And Gold).
This implies the price of Gold OANDA:XAUUSD to rise which will make TVC:GOLD rise as well. This play could take a month or early 2025 but will TP 100%.
Barrick Gold (GOLD): Up 33%—Time to Take Profits?What a rise by Barrick Gold since we bought some shares at the end of February 2024. Patience pays off most of the time, and so it has with Barrick Gold. We are now up over 33% with this stock, and we’re very happy with this last-second entry before the stock took off. Gold continues to rise, and Barrick Gold is following suit. However, after every rise, a setback—whether major or minor—will happen sooner or later, and we’re definitely not getting greedy here.
We’re going to take our first profit now and move our stop loss to break even. If we decide to reenter with a second position, we’ll let you know with a new limit.
For now, we’re just enjoying this setup and the profit. Let’s keep this going 🔥
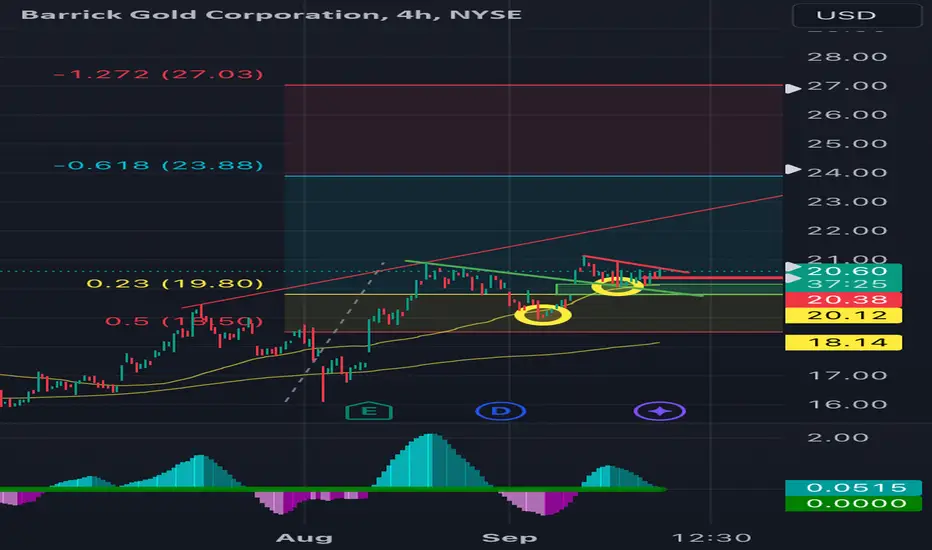
$GOLD is heading to $27; lagging behind #Gold.My thought process; I purchased 10/18 $24calls and I will be selling at $27 (most likely) next week. This is following (lagging) the commodity Gold that is heading towards its 2nd fibonacci target (similar to TVC:GOLD ’s $27 one) indicating TVC:GOLD will follow shortly. The TTM squeeze on the 2 hour is just 1 indicator this is ready to blow. My fibonacci .38 retracement zone method is continuously proven to be one of the best methods I ever learned. See you at 27. As always; have a stop loss for worst case scenarios.
GDX & Gold Miners: ShortThat's it for this year ! Next entry in Feb 2025. Rather believe that the dramatic downturn in economy comes in Feb 2025 with Xauusd and Miners surging.

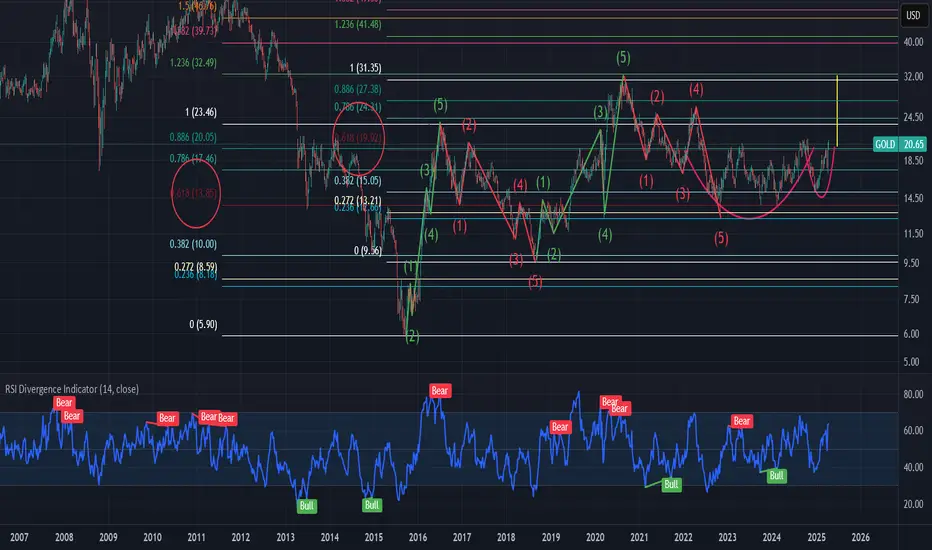
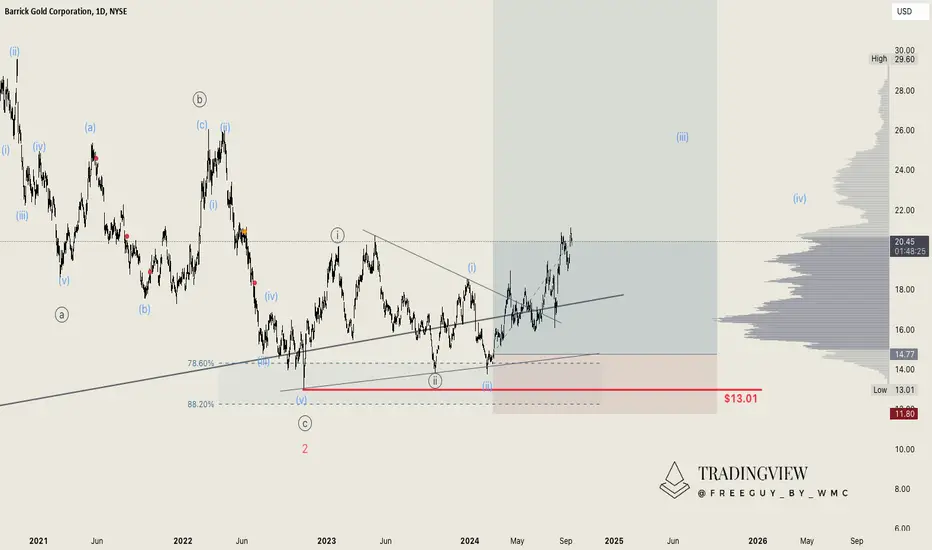
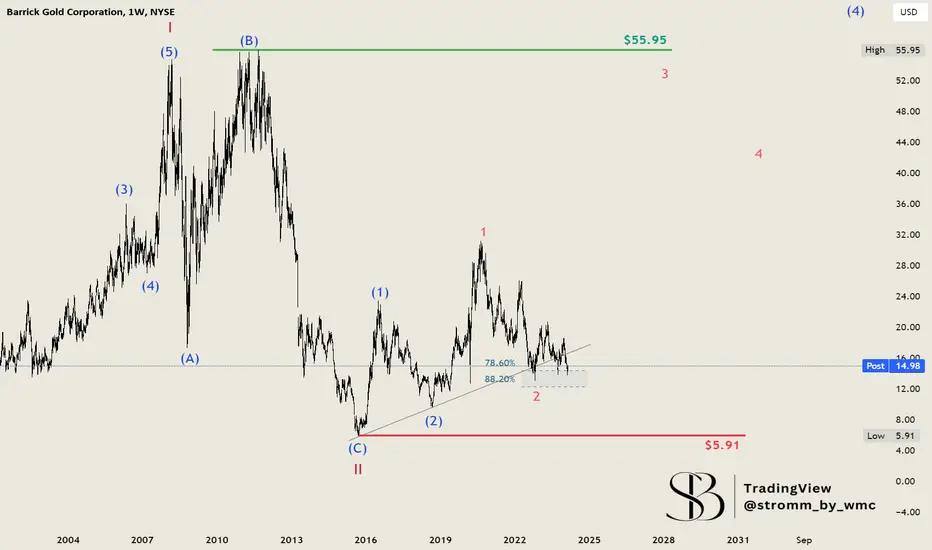
Barrick Gold: 520% possible MoveMany traders believe that investing in a wide variety of assets is the best way to achieve optimal diversification. However, we disagree with this notion. It's the correlations that matter. Holding 20 tech stocks, for example, results in a high correlation among investments, offering little in terms of true diversification. Therefore, we're also looking at a gold mining stock, Barrick Gold Corporation. Although it's a Canadian company, we're analyzing it based on its performance on the New York Stock Exchange, as it provides a longer historical view.
Contrary to other stocks, Barrick Gold presents a different picture. Since July 2020, there's been a significant decline, which is contrary to the overall market trend, indicating this stock moves inversely to the broader market. We're in Wave III, having concluded Wave II at $5.91. We expect to surpass the all-time high of $56 significantly. The Wave 2 of the subordinate Wave (3) has already concluded, and we didn't make an entry, as this was already completed at $13 on the daily chart. However, we've returned to this level and have now completed the smallest wave structure, also marking the end of a Wave (ii). We must not fall below this point, as it would indicate the subordinate Wave ((ii)) is incorrect. Additionally, falling below the $13 mark could potentially invalidate the entire scenario. We'll place our stop-loss below the 88.2% retracement level, as this represents our last plausible point for a market turn.
GOLD to pullback to $18Price at top channel
Stochastic Momentum Index (SMI) at overbought level
TTM Squeeze momentum is up
In at $19.66
Downside target $18
Barrick Gold Corporation, may become strongerAfter the possibility of the FED cutting interest rates, there is a opportunity to gold achieve new records, and this will be beneficial for Barrick.
Barrick Gold, reported EPS and Revenue above the expectations.
The target will be $26

ABX longWith gold moving up, abx doing the same.
havent worked much in this chart.
I am just a student. so this is just for educational purpose.
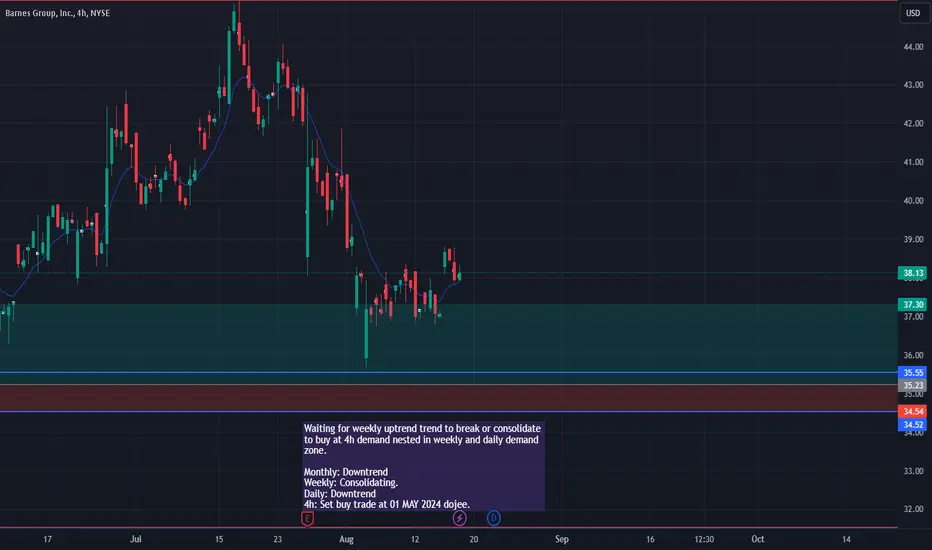
Buy option @ 4hWeekly is consolidating and a buy option at 4h demand nested in weekly and daily demand zone.
Monthly: Downtrend
Weekly: Consolidating.
Daily: Downtrend
4h: Set buy trade at 01 MAY 2024 dojee.
Are we finally ready to move higher in GOLD?In a gold bear market, Barrick Gold's stock hasn't done much at all and ultimately has underperformed as investors anticipate lower earnings. However, investors might see this as a buying opportunity if precious metals see liquidity rotation out of the more overpriced and inflated assets.
