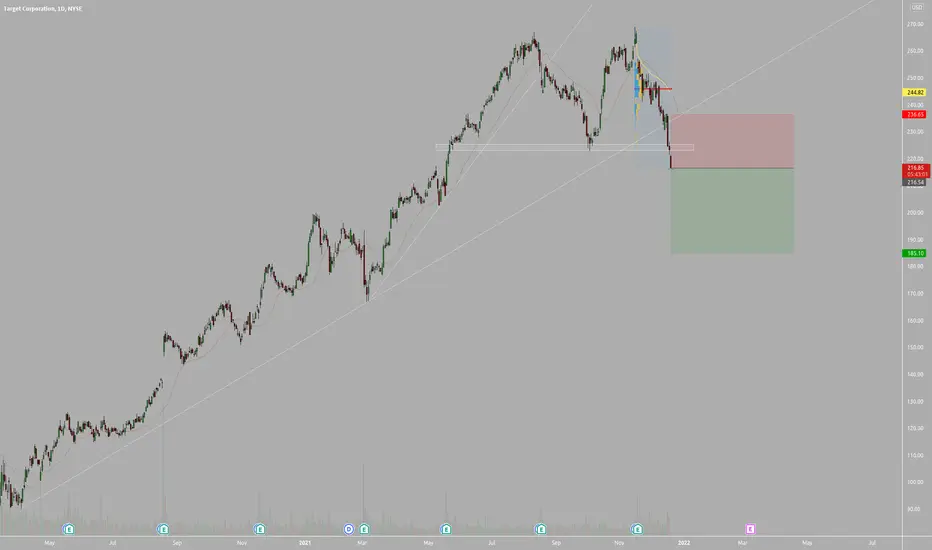
Bullish CypherPossible stop below 184 or where you see support.
Support occurs where a downtrend is expected to pause due to a concentration of demand. Resistance occurs where an uptrend is expected to pause temporarily, due to a concentration of supply. The more candles a particular level, the stronger that level becomes. Candle tails can point to support and wicks can show a resistance level. Support and resistance areas can be identified on charts using trendlines, candles and moving averages.
Short percent is 3.06% with 3.4 days to cover. An increase today, possibly due to the large move up. The shorties are planning on this pulling back some.
Up a bit today. Long entry level can be crucial to help hang.
Price fell from a bearish rising wedge and appears to have recovered.
Resistance overhead.
The Cypher harmonic pattern is a reversal pattern. Like other XABCD patterns, it has 4 legs. B retraces to an expansive range between 38.2 and 61.8 percent of XA, at least 38.2 percent, but not exceeding 61.8 percent.
C is an extension leg and goes beyond A so peak 2 is higher than peak 1. CD leg should land somewhere close to the 78.6 fib level percent level of XC.
The Cypher resembles the Shark. There are important differences between the 2 patterns and both have a bearish version that resembles a crooked W with an impulse wave/leg that goes down verses up. The Shark is labeled OXABC and peak 2 is higher than peak 1. The shark has no retracement rule for the 2nd leg except it can not go below O. The Shark has a potential reversal zone (PRZ) at the .886 but can reach the 1.113. If price reaches the 1.113, then C(the last leg) is below O.
The Cypher's final leg is measured using the entire structure, or the .786 of XC (not XA). The Shark's final leg is measured using the first leg, or OX.
Both are considered reversal patterns.
Most indicators, including candles, MACD, trendlines, patterns and moving averages are useless on their own. It is a good idea to listen to what the market environment and price is telling you.
No recommendation.
DYH trade ideas


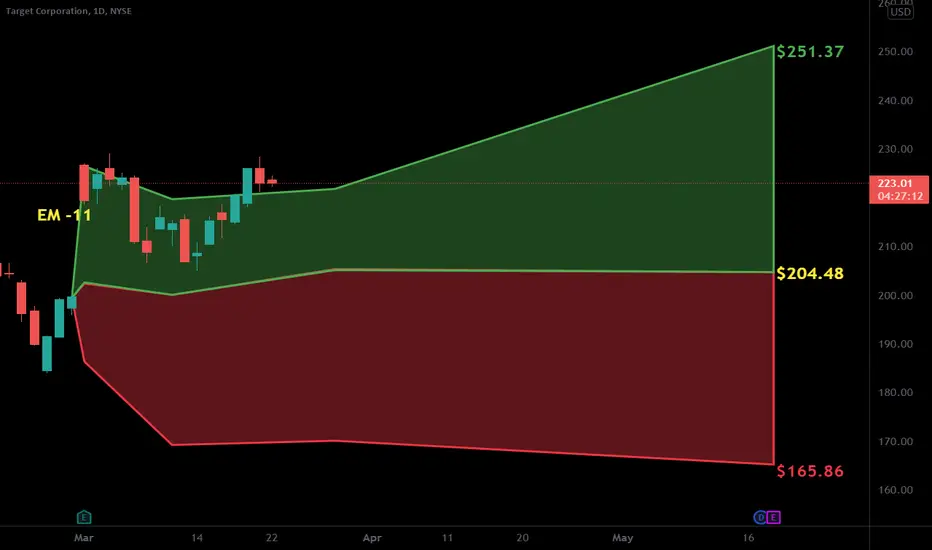
$TGT with a Bullish outlook following its earnings #Stocks The PEAD projected a Bullish outlook for $TGT after a Positive over reaction following its earnings release placing the stock in drift B with an expected accuracy of 62.5%.
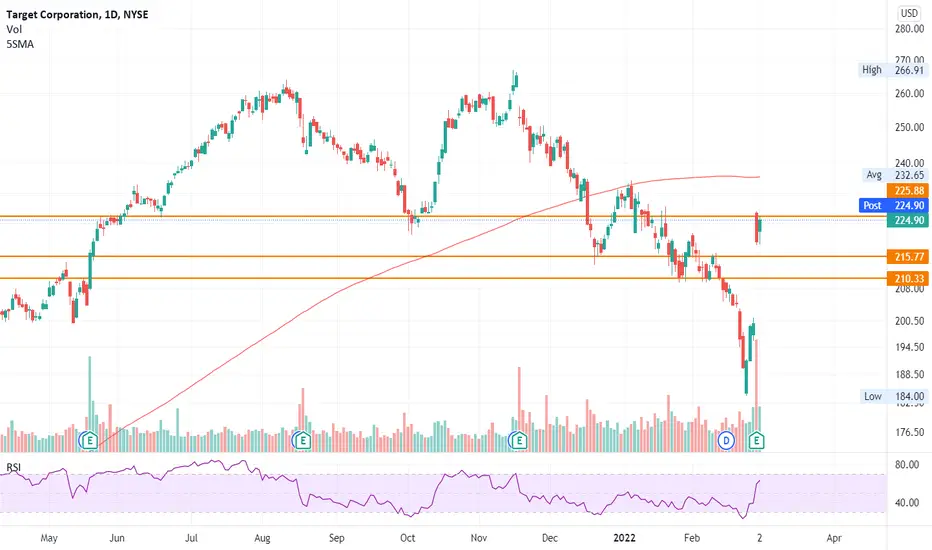
Target at post-earnings SupportFollowing the earnings rally Target stock NYSE:TGT has pulled back to a 50% Retracement and also triggered a Spike Alert which can define the risk on this pullback. I like the trade to play back up to the post-earnings high and beyond for a long term position.

big breakout for TGTthis gave you every textbook move
broke the downtrend, retested, and flew back up
big buy for me

TGT: Gap Fill and Very Low PTKeeping this short and sweet: TGT reported earnings last Tuesday and a large gap up was created. First PT is 202.
Not financial advice
Target - Short position Currently at $ 225 and XLP at $75.20 which seems to be good position for short. Profit taking at $217 and $210.
$TGT beating the EPS expectation.$TGT earnings has been stellar since the start of the pandemic after boosting their stores with their drive up pick and online with optional delivery or store pick up.
with these added convenience, customer intend to shop more often and helping Target to boost its revenue. despite the good earnings, $TGT did not make a rally yesterday
due to uncertainty of the economic backlash of the war between the two countries overseas. i think imo TGT is still a good buying opportunity once the market becomes more steady.
Day trade or scalp target play: 03/ 02 /22
Buy call above 224.90 sell at 230.24
Buy puts below 216.29 sell at 214.14
Hello everyone,
welcome to this free technical analysis . ( mostly momentum play )
I am going to explain where I think this stock is going to go over the next day or week play and where I would look for trading opportunities
for day trades or scalp play.
If you have any questions or suggestions which stock I should analyze, please leave a comment below.
If you enjoyed this analysis, I would definitely appreciate it, if you smash that LIKE button and maybe consider following my channel.
Thank you for stopping by and stay tune for more.
My technical analysis is not to be regarded as investment advice. but for general informational proposes only.

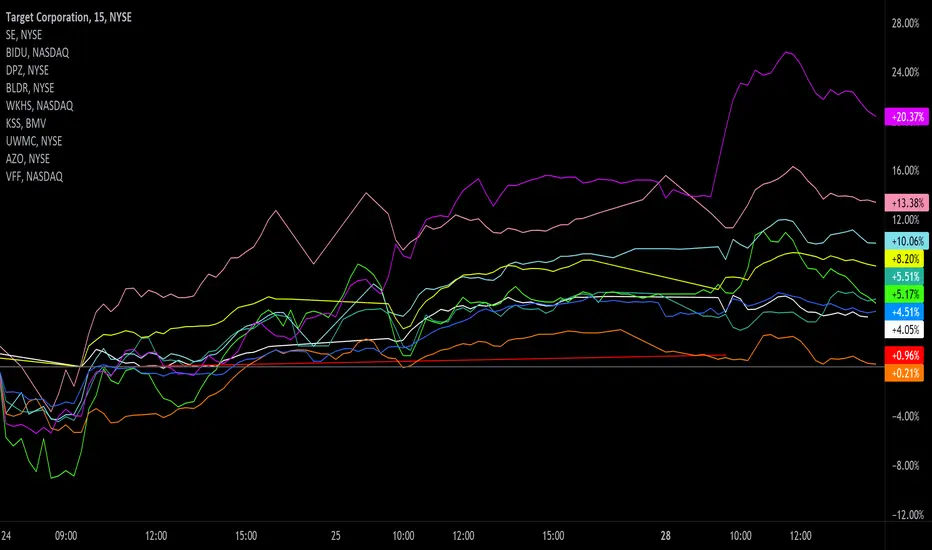
Earnings watch 3/1 pre-marketEarnings watch 3/1 pre-market:
TGT
SE
BIDU
DPZ
BLDR
WKHS
KSS
UWMC
AZO
VFF
Do your own due diligence, your risk is 100% your responsibility. This is for educational and entertainment purposes only. You win some or you learn some. Consider being charitable with some of your profit to help humankind. Good luck and happy trading friends...
*3x lucky 7s of trading*
7pt Trading compass:
Price action, entry/exit
Volume average/direction
Trend, patterns, momentum
Newsworthy current events
Revenue
Earnings
Balance sheet
7 Common mistakes:
+5% portfolio trades, capital risk management
Beware of analyst's motives
Emotions & Opinions
FOMO : bad timing, the market is ruthless, be shrewd
Lack of planning & discipline
Forgetting restraint
Obdurate repetitive errors, no adaptation
7 Important tools:
Trading View app!, Brokerage UI
Accurate indicators & settings
Wide screen monitor/s
Trading log (pencil & graph paper)
Big, organized desk
Reading books, playing chess
Sorted watch-list
Checkout my indicators:
Fibonacci VIP - volume
Fibonacci MA7 - price
pi RSI - trend momentum
TTC - trend channel
AlertiT - notification
tickerTracker - MFI Oscillator
tradingview.sweetlogin.com
TGT puts below supportMajor level to break with set PT zone for puts as well as downtrend resistance approaching.
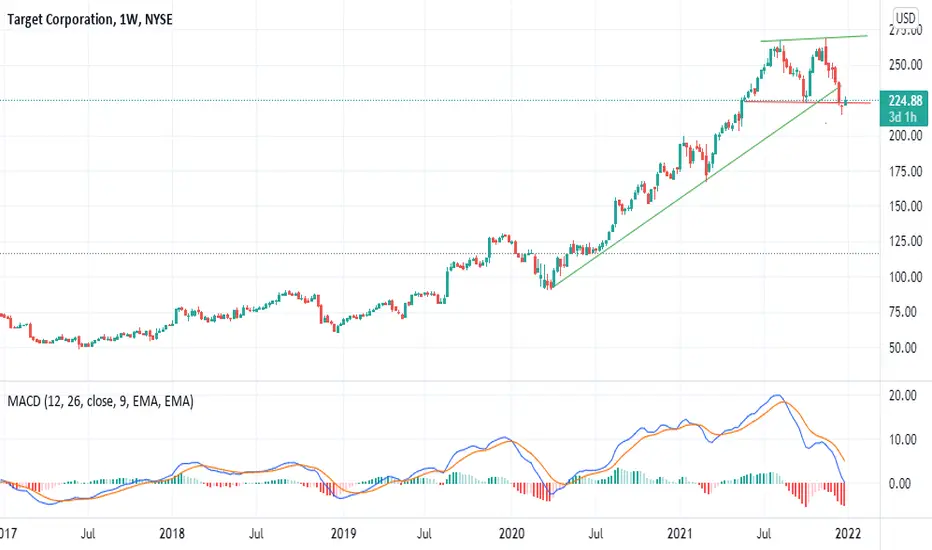
$TGT | TRADE IDEA$TGT 1W
Target is consolidating in a megaphone pattern and bounced off TL support. Looking for history to repeat itself and break above the micro resistance (red line) for a retest of the upper TL. Seeing some bullish divergence as well as the oscillators looking to flip bullish.

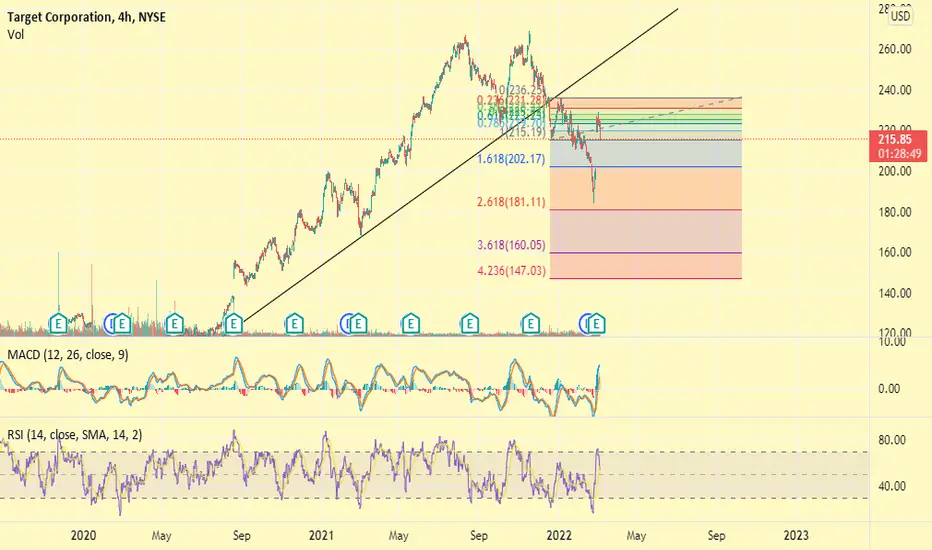
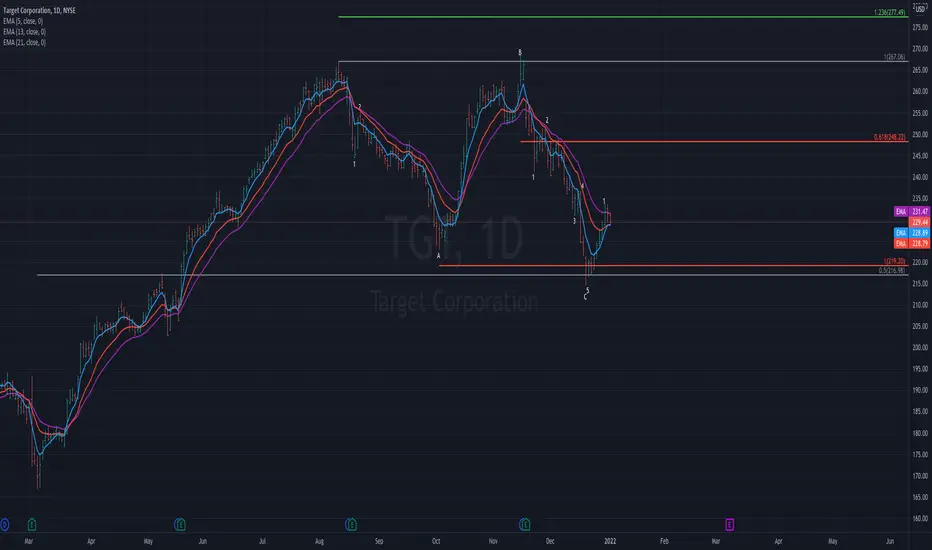
TGT long biasI am long TGT in the intermediate term. i would like to see more strength and signs of reversal before entering. This is because the stock has room to fall still with the potential pts shown on the chart. I would like to see this break the down trend and base above the 23 to take this. As of now the stock has room to the 886 all the way to the 1618. Theres also been a heavy amount of order flow that we are trading below. the longer we trade below these prints the less bullish I become unless more orders start coming through.
NOT FINANCIAL ADVICE


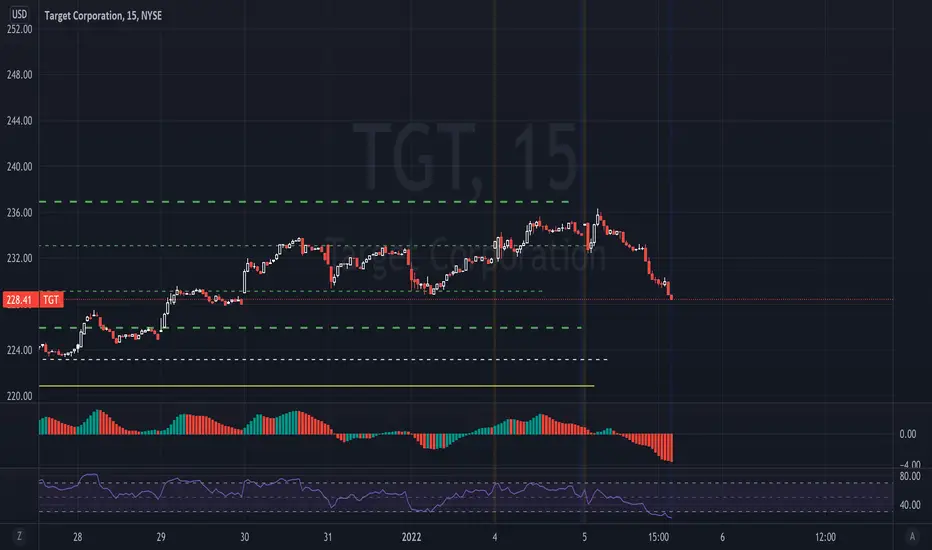
$TGT Levelscan use same lines as PTs.
The breakout zone is the biggest concern here.
Breakout zone:
$228.6
$227.17
Opportunity forming in $TGTIf $TGT correction is complete, the current pullback can be viewed as an opportunity as the stock appears to be moving in an impulsive manner. Let's see if the stock catches support and move higher. Will update as time progress.

$TGT LevelsAs you can see, moving along nicely. I intend for TGT to continue moving up and or consolidate
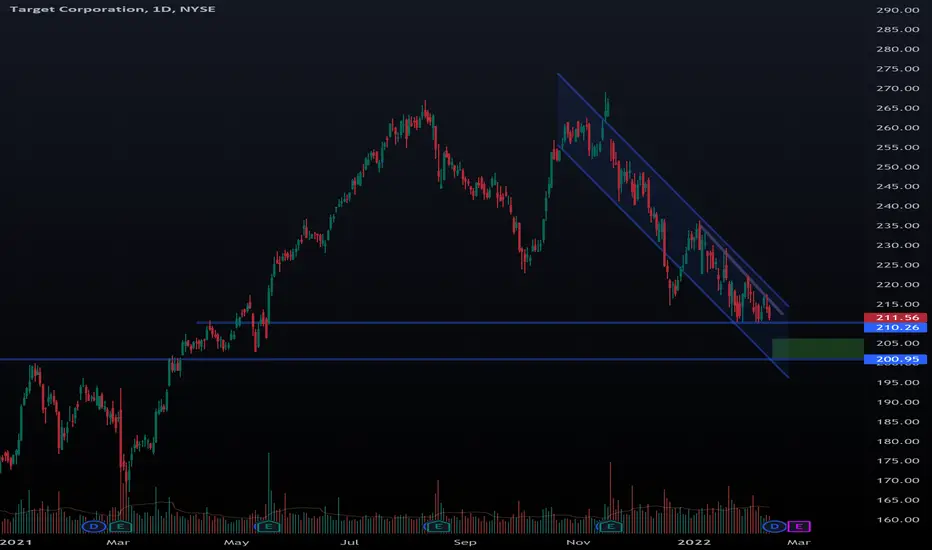
TGT Holding on by a Thread Insider Selloffs combined with a poor technical setup, TGT looks incredibly weak at its current trading price of 225.40. TGT has been trading within a rectangular channel for the past several months (albeit not a particularly well defined channel but a channel nonetheless). It has tested the bottom bounds of this channel twice including a false breakout recently on the 21st of December. With any substantial selling volume, I expect a rather violent swing to the downside here for TGT. I expect TGT to see 189.50 per share soon and likely even hitting 165.70 levels sometime in the near future.
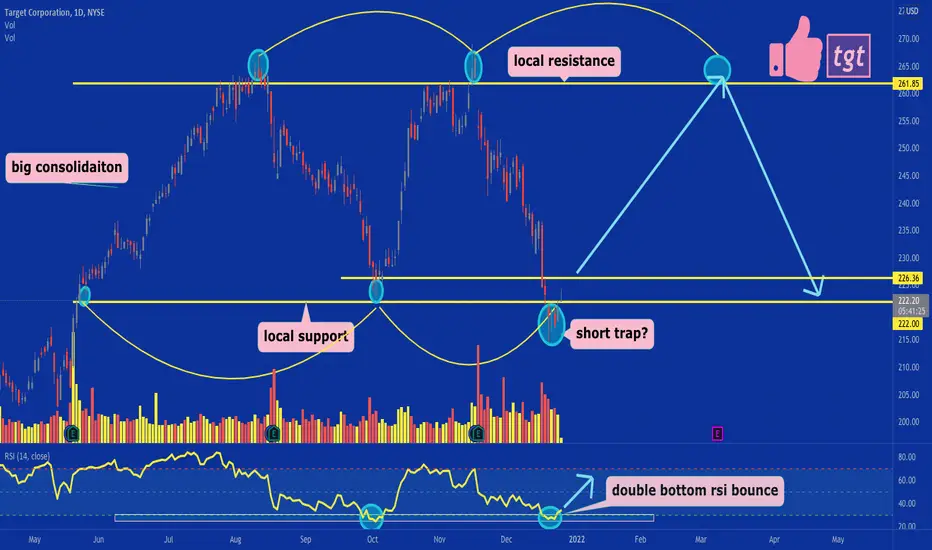
climbing back above support! a great sign for longs 🔥tgt saw a break below local support recently but looks like that could have been a short trap, since its currently trying to reclaim that support.
also bouncing off double bottom rsi support, a move over 226.36 can send it to 261 in early-mid 2022.
like and follow for more 💘
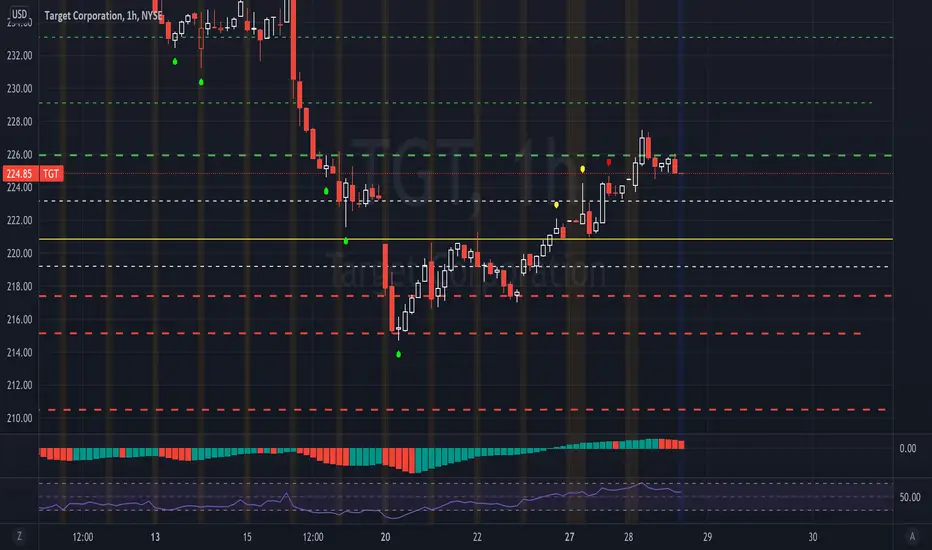
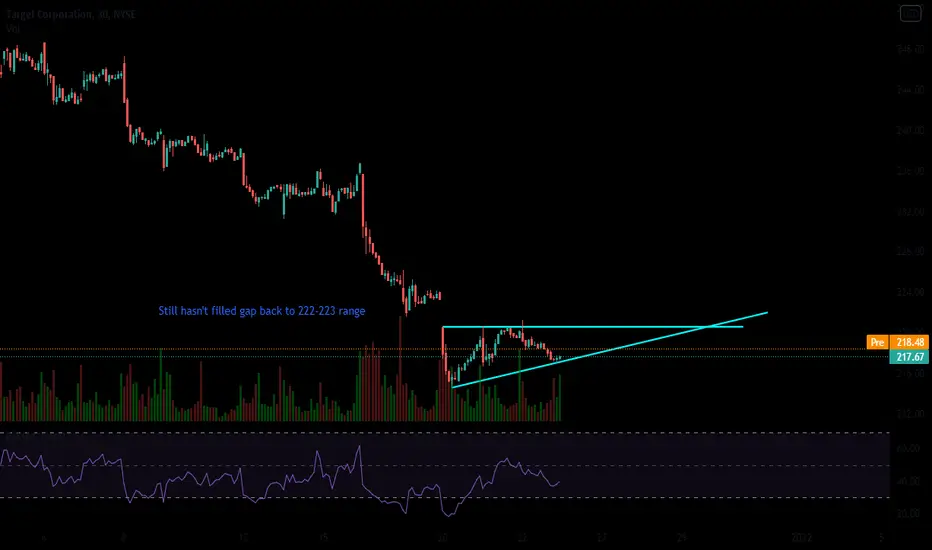
TGT buy signal inbound!TGT still recovering from massive sell-off. Buy signal over a clear break above $220. Still has not filled the gap back to 222-223 range. Holiday season is here and retail in general will get a boost. Also, online ordering has increased and new Covid is not as bad as everyone thought. Time to buy Target is (almost) here.
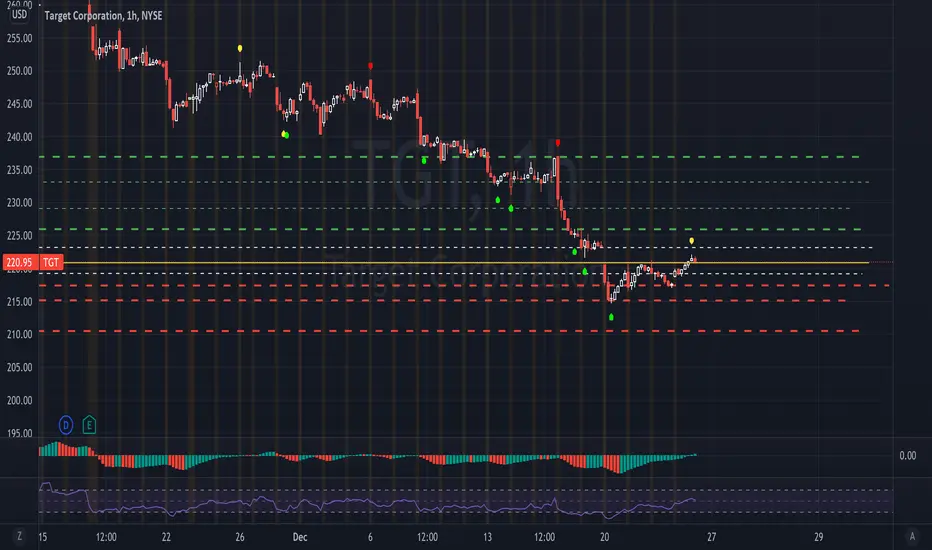
$TGT incoming bounce on its way, another short covering rallyA big bounce is imminent on $TGT here in the next few days to weeks, the stock has declined significantly in a brief amount of time and is now showing inside candles representing balance, a push over 221 will take us screaming higher. Short covers bring the excess liquidity, strong numbers represented by Target this holiday season is a contributing factor why we will bounce here. Be patient, another big trade is coming. Jan 220/225 calls can work on confirmation candle.