HDI trade ideas
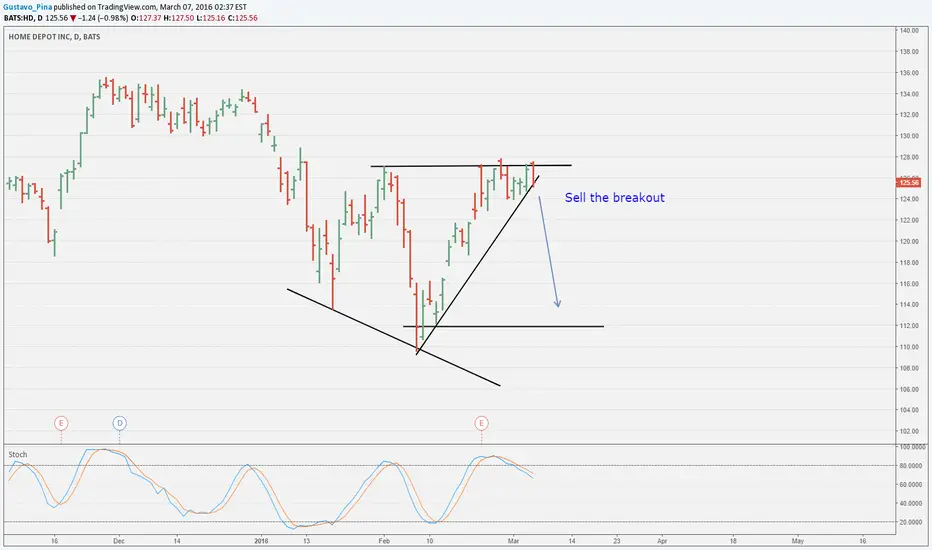
HD: Beakout nearThe market is in a uptilted rectangular congestion. Two possible routes are in the chart.

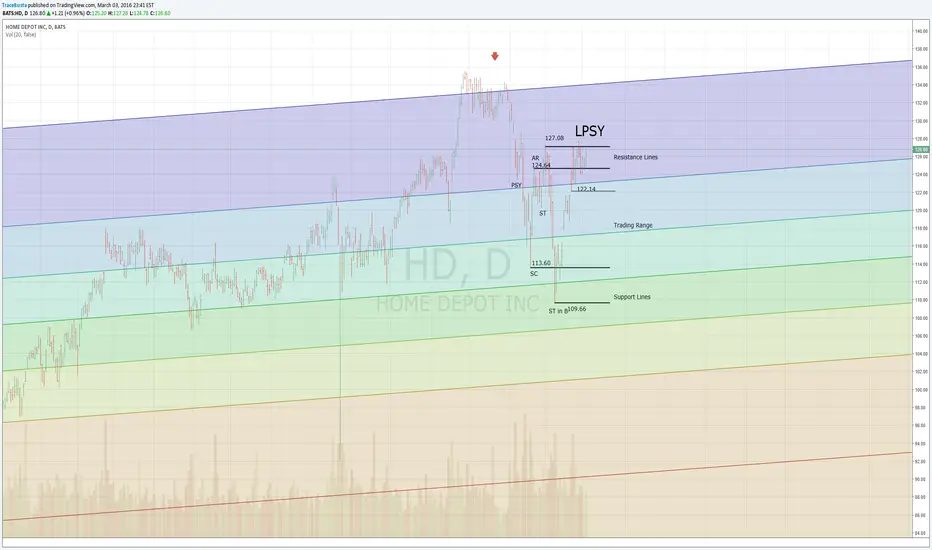
HD - Wyckoff accumulation within larger distributionPossible LPSY of larger distribution area hit 3-3-16
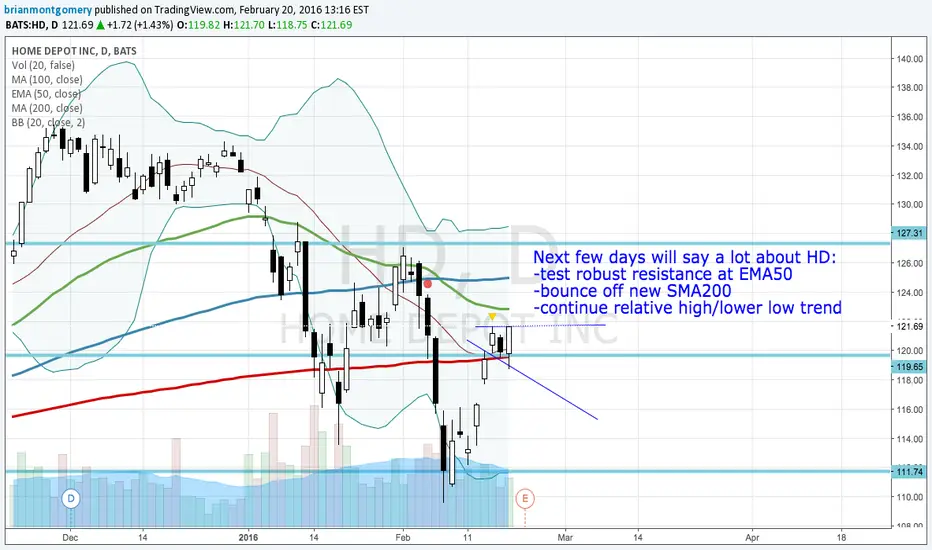
HD could go either wayOn 18FEB, HD bounced off the linear support and SMA200. Next day produces a bullish hammer candle. From this point there is evidence to argue bullish and bearish. The EMA50 seems to be a strong resistance (12JAN, 29JAN-03FEB) for HD and could be a cap for bullish trend that HD has been presenting. Additionally, the past three days have shown relative highs accompanied by lower lows. There is not a lot of space between resistance and support for HD. Which level will end being stronger?
Can HD Bost?This dog of the dow was just ripping through highs, can $HD recover from this? It’s Dividend play? I think it’s depending on your portfolio“S”or even those funds that are only access to brokerage services and what not but, I’m holding 34 shares in this stock on Gurufocus I am bullish long-term of The Home Depot INC. I don’t think it’s a technical perspective that might scream sell. There is no signal on 2/17 but, watch this stock and keep your eyes on this stock. I’m expecting to see $125 break again and make that support and rally from there. I’m a buyer
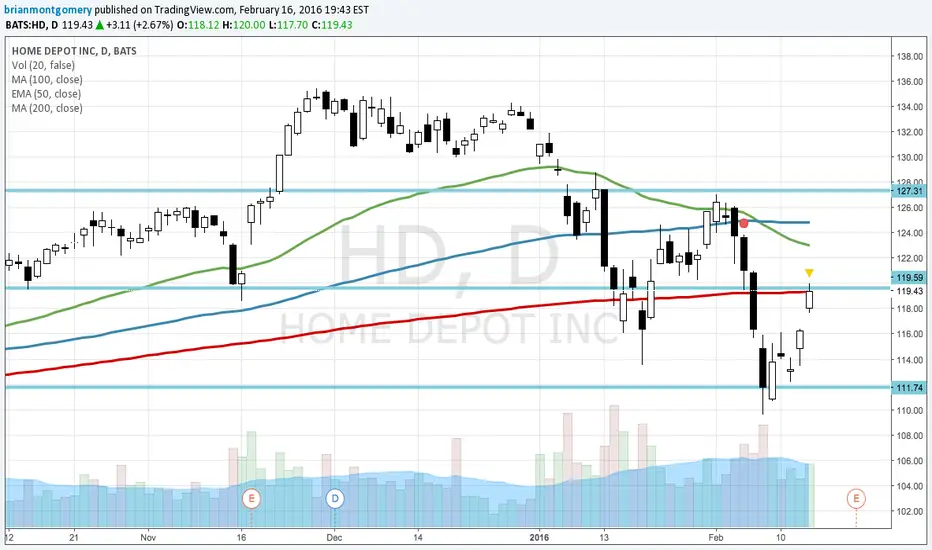
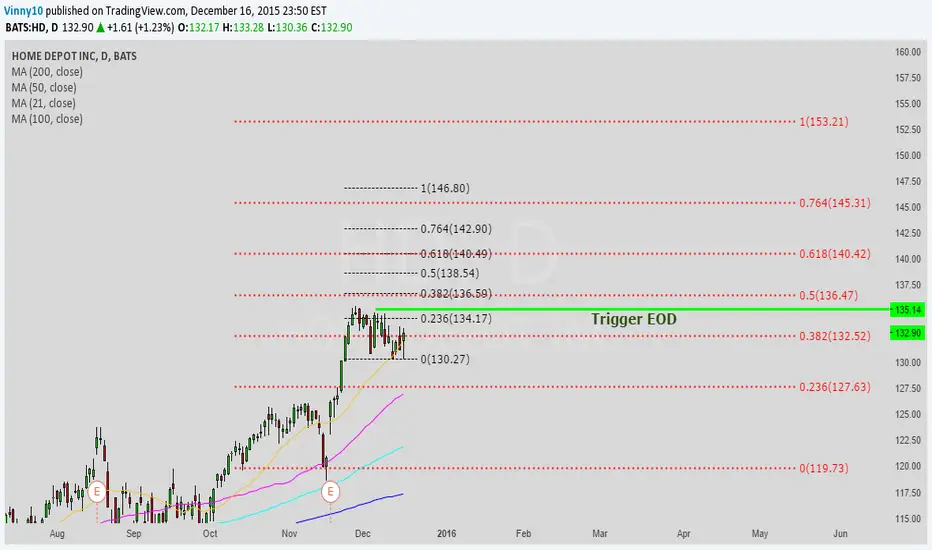
HD 2nd retest gap in a row.HD closes with a second bullish retest gap in 2 days closing at minor resistance level from mid OCT and NOV of '15. The fact it follows a morning star reversal adds to the bullish sentiment of the past few days. However, the most recent candle closes on the SMA 200 which could prove to be a resistance point as well. If next candle breaks out of the SMA 200 resistance as well as linear resistance line, I would feel more bullish than bearish in the coming days.
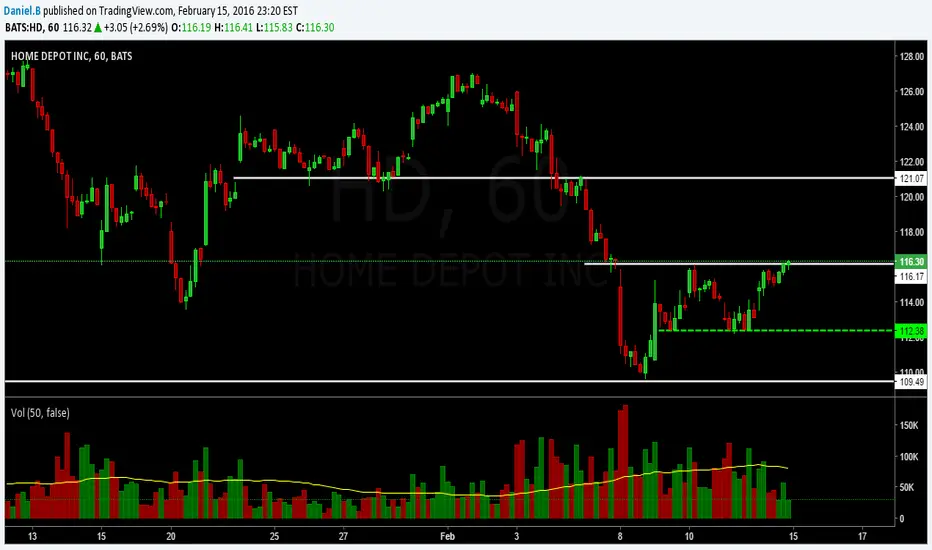
S/R Levels Home Depot 1HR Chart Hi all, these are the support / resistance levels for NYSE:HD
As you can see marked by the dashed green line we have weekly support at 112.38 which would of been an ideal area to get long on the retest of support.
Resistance is currently at 116.30 with 121.07 following shortly.
Monthly support is at 109.49
A potential trade: If I hadn't gotten long at the 112.38 retest, than my next option would be to go on a 15 minute chart and day trade the breakout above 116.30 resistance. How? There is a good chance we'll open with a gap above resistance so if that happens there is a good chance the gap will be filled and we will see a retest of 116.30 in which you would keep your eyes on the tape to spot the change of hands between buyers / sellers. Once buyers enter the market then I would get long with two long targets of 118.60 and 120.50 with a stop loss around 114.85.
(This would be my trading plan if I wasn't already long HD)
This is somewhat an example of my thought process when trading.. You see even if I plan on day trading, I always have a plan in mind for the following day. Which in return prevents me from chasing every single stock that's making a move and also helps remove the emotion out of the equation because I planned ahead for different scenarios, and ways to trade them or simply not trade them.
Happy trading guys/girls! =)
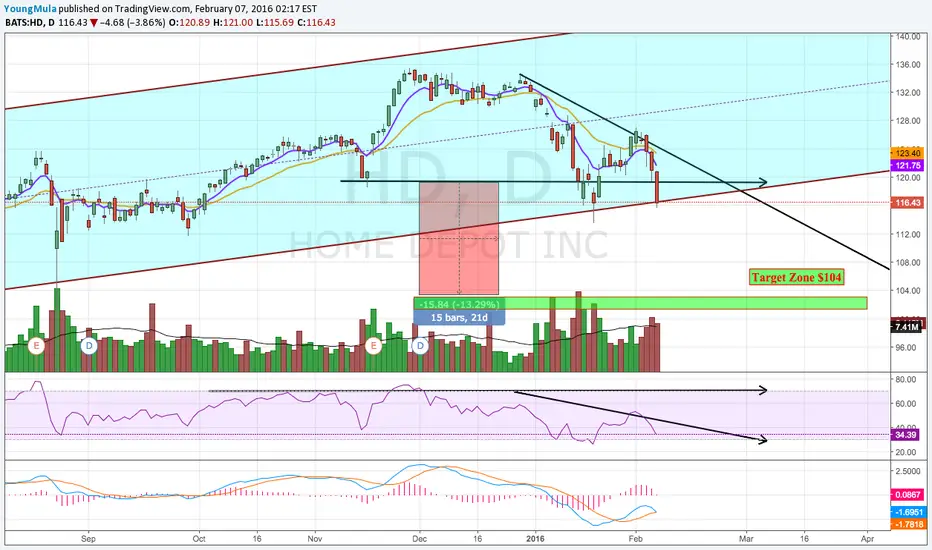
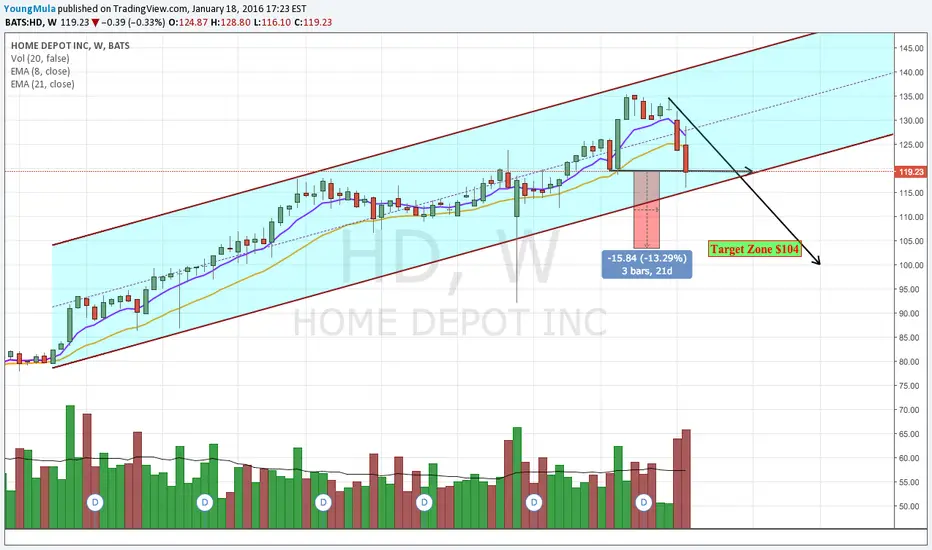
HD short term bearishHD is in uptrend but in short term show bearish.
Price maybe decrese to trend line.
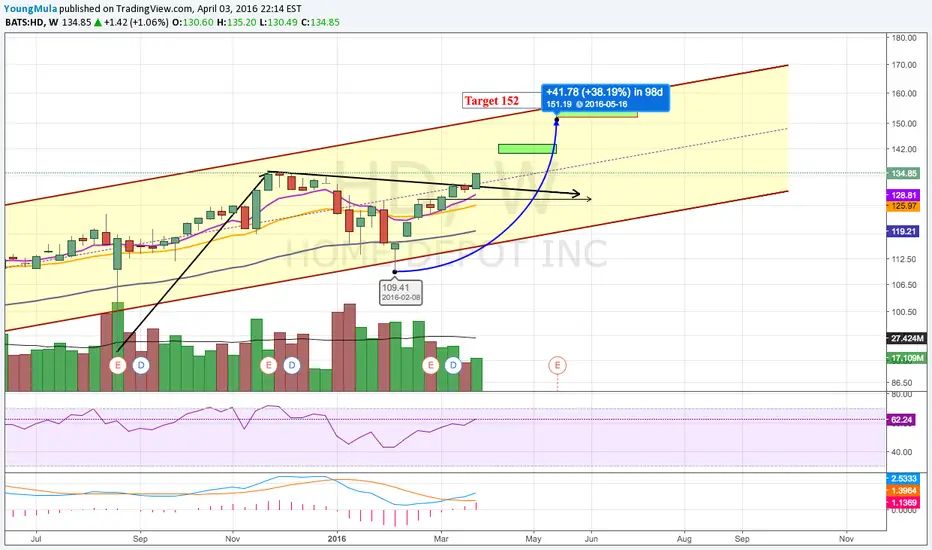
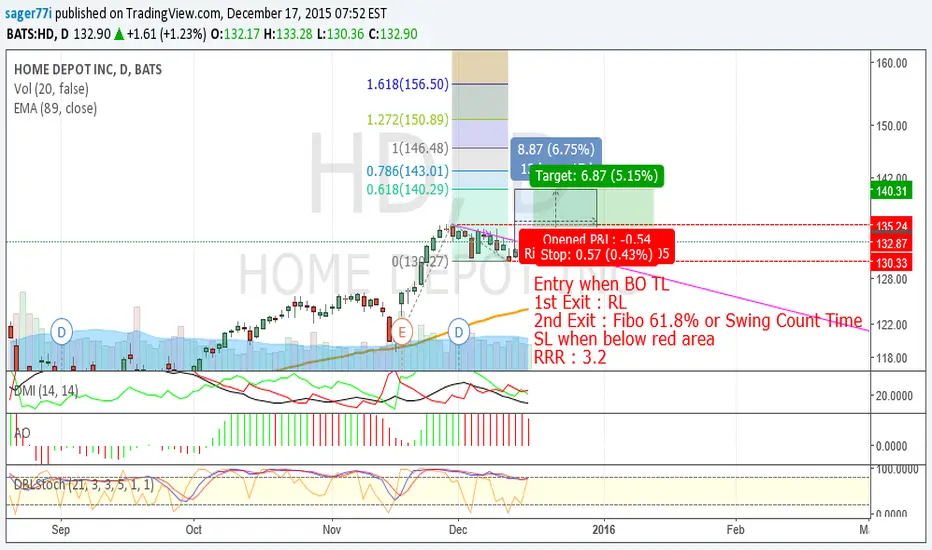
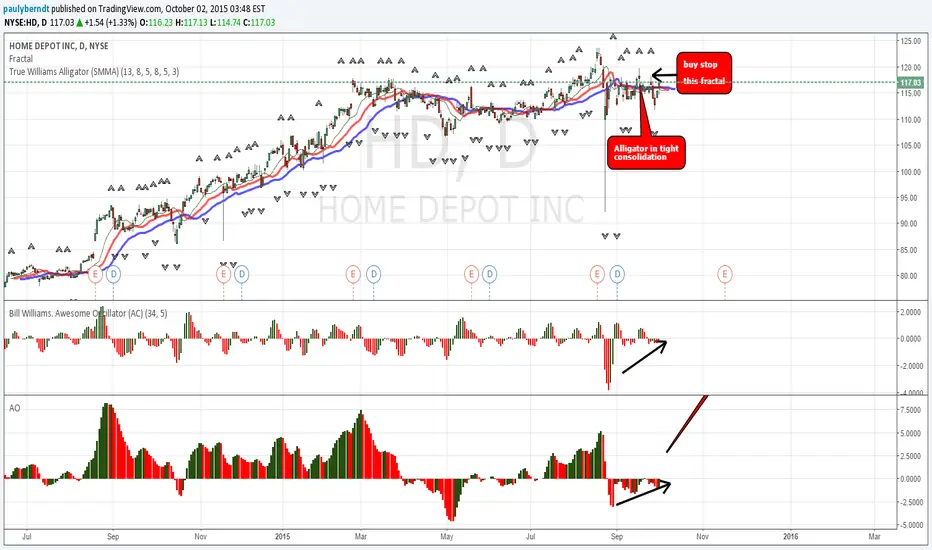
HD LONGHD has held up fairly well during this
market turmoil. I look for a retest of the
highs on this stock. Both the Acceleration
Oscillator and Awesome Oscillator are green on
the weekly showing that price is in the zone. If this
trade is triggered my stop would be below the alligator
blue line
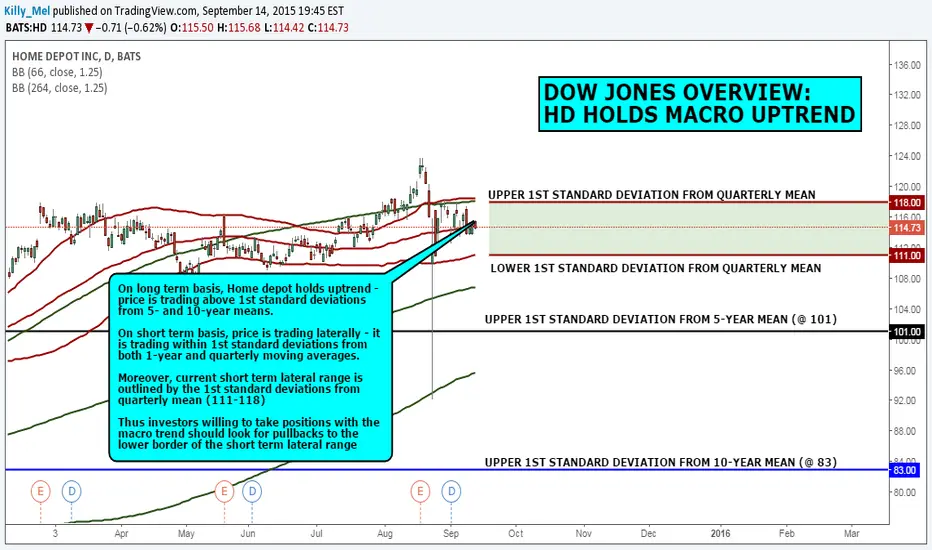
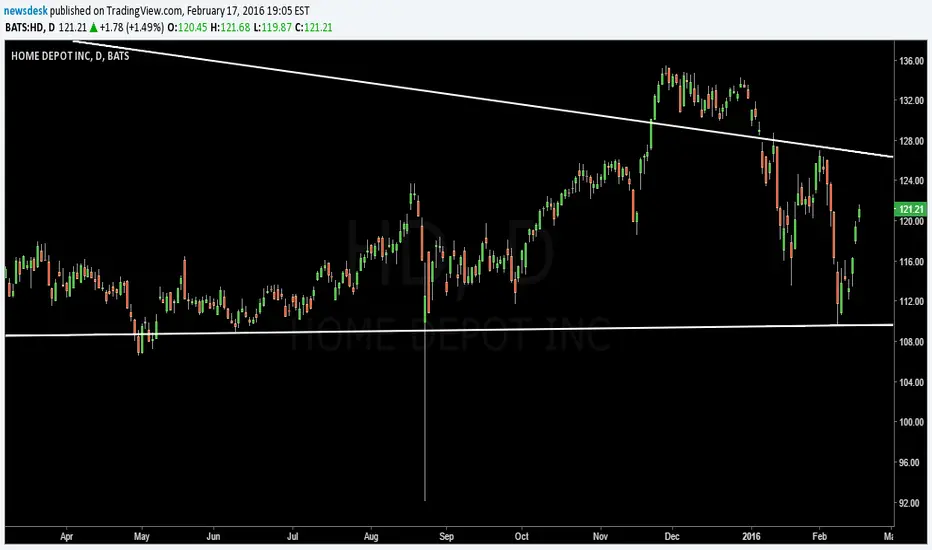
DOW JONES OVERVIEW: HD HOLDS MACRO UPTRENDOn long term basis, Home depot holds uptrend - price is trading above 1st standard deviations from 5- and 10-year means.
On short term basis, price is trading laterally - it is trading within 1st standard deviations from both 1-year and quarterly moving averages.
Moreover, current short term lateral range is outlined by the 1st standard deviations from quarterly mean (111-118)
Thus investors willing to take positions with the macro trend should look for pullbacks to the lower border of the short term lateral range