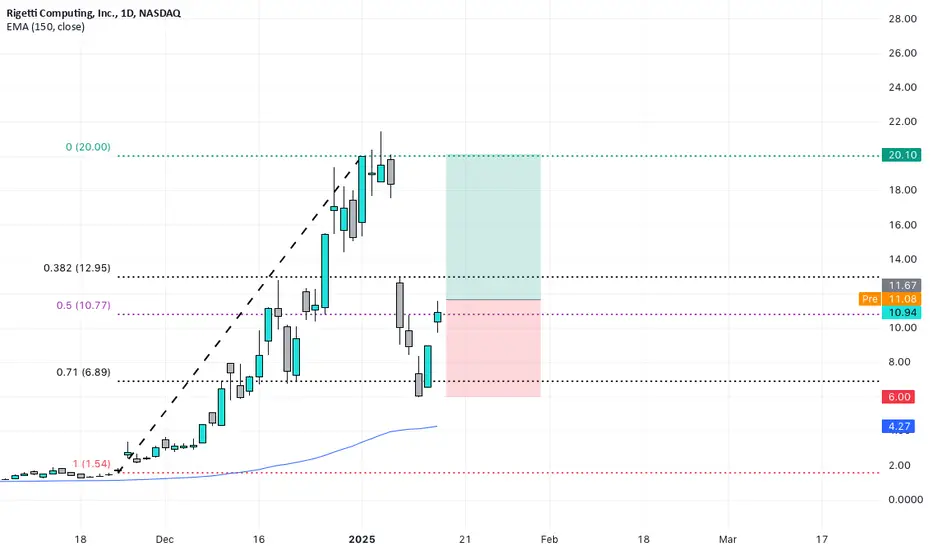
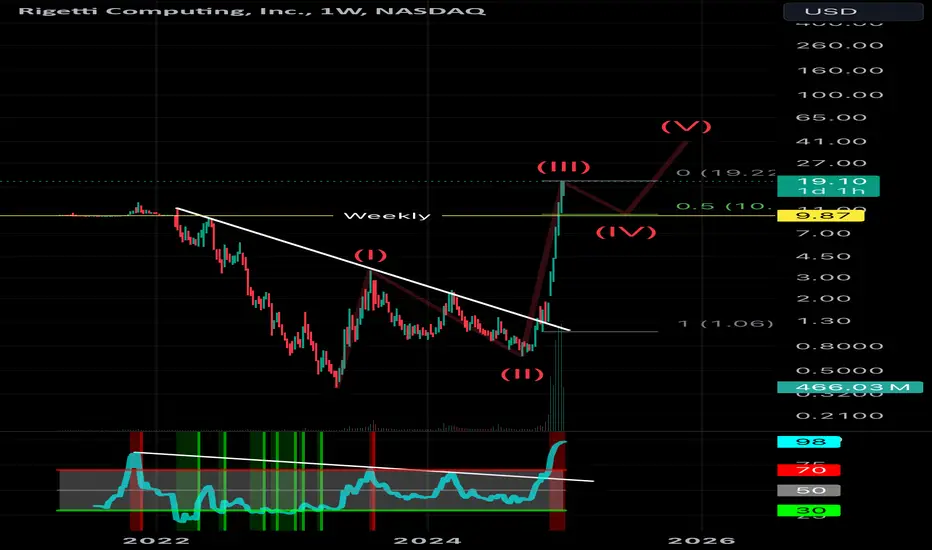
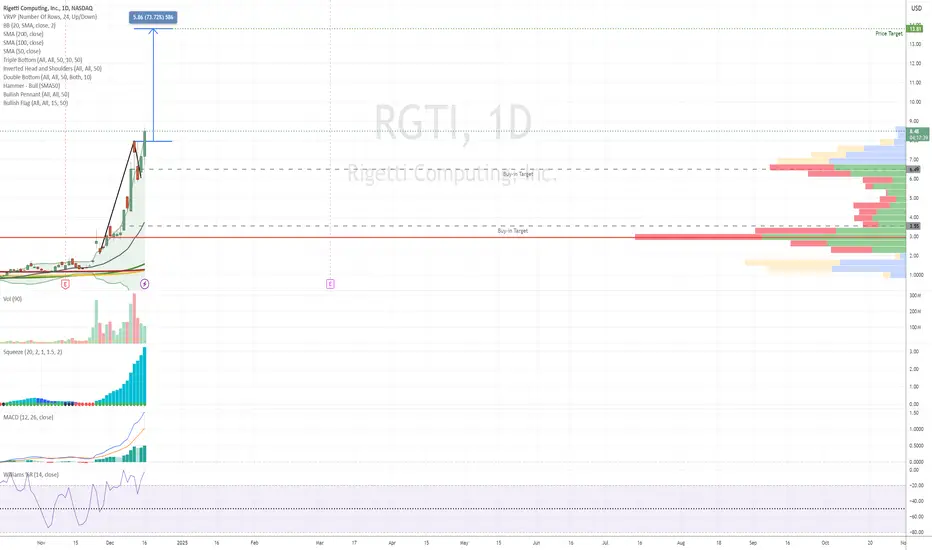
$RGTI LONG TO TWENTYA speculative theme for this year seems to be quantum computing since GOOG announced its breakthrough chip a few weeks ago. RGTI had a mammoth run, and with my Fibonacci framework I use to determine premium and discount zones, I figured this was a decent bet for a move back to the swing high of about $20 in the next few weeks. I love the fact that it has high short interest as well. Fuel. My stop loss would be at $5.90, slightly underneath what I am hoping the most recent swing low would be. I plan on holding this a few years but for a swing trade the odds are it goes back to $20 given the hype about quantum and overall market conditions.
RGTI trade ideas
15 min *possible* break outIf RGTI breaks out of the parallel structure and also the 50 EMA there may be possible price action towards the 200 EMA. Please observe chart for key levels and FVG blocks and the parallel structure.

RGTI buy & sell zoneAll eyes on RGTI with price alerts set
Bounce at $5-$6 range
Sell at $9-$10
40% upside from low

Bullish Long-Term PerspectiveHello traders,
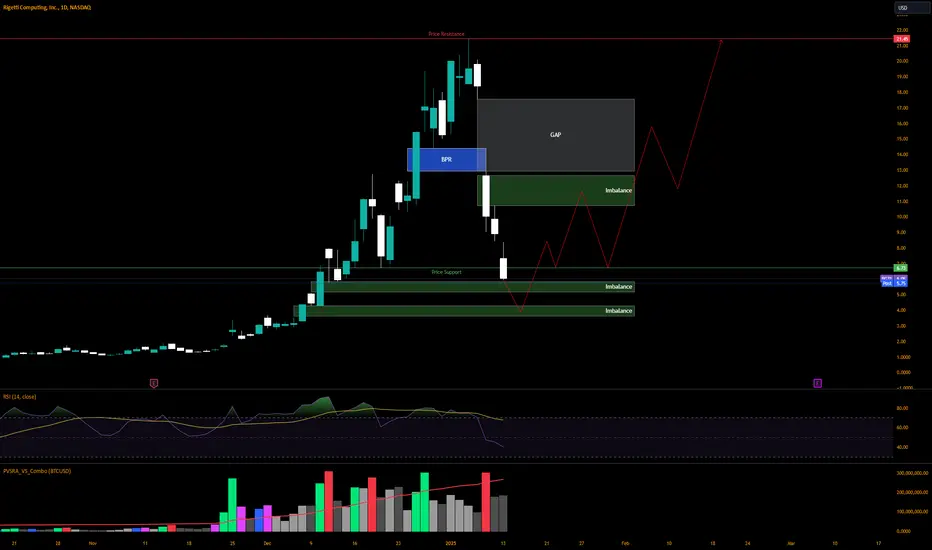
Here’s my analysis on Rigetti Computing (RGTI). The current price action indicates a potential for a bullish reversal, with key technical levels and imbalances offering opportunities for long-term growth.
Key Observations:
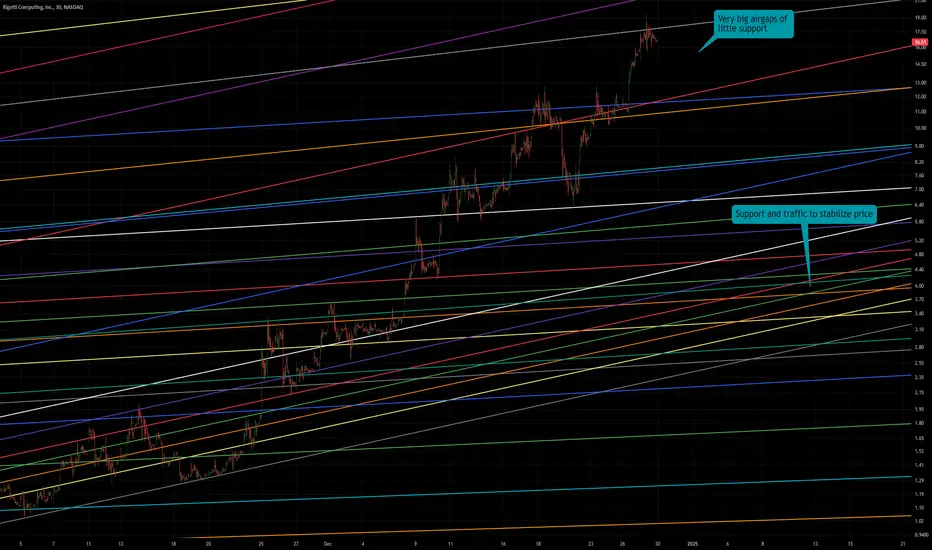
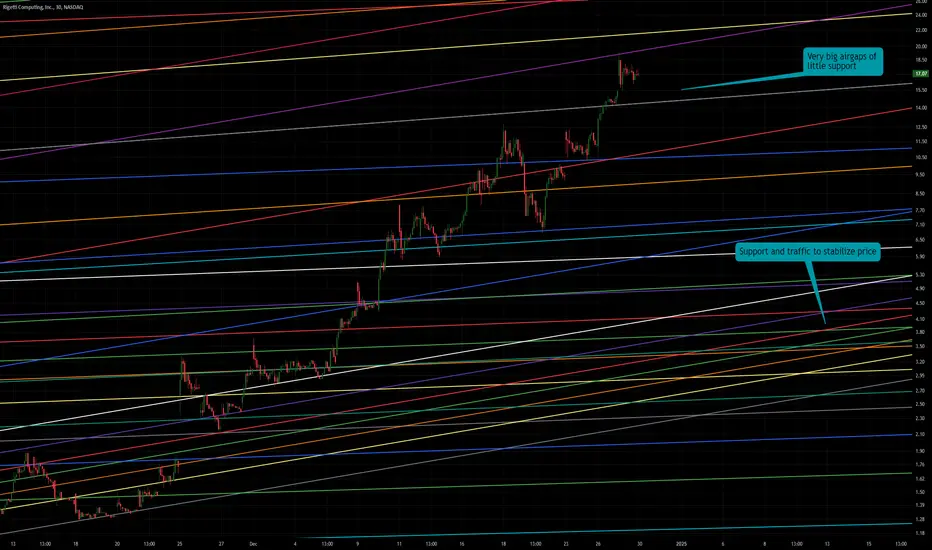
Support Zone: Price is approaching a strong support area around $5.00-$5.50, with significant demand historically observed in this zone.
Imbalances:
Lower Imbalance Zones: These zones around $4.50-$5.00 could act as magnets for price stabilization before a reversal.
Upper Imbalance Zones: Imbalances near $12 and $16 provide potential upside targets for long-term bullish movements.
Gap and BPR: A gap near $14 aligns with the Break of Price Range (BPR), signaling a key area to watch for future price action.
Price Resistance: The $21-$22 level serves as the ultimate resistance and a potential long-term target.
Strategy:
Buy Entry:
Near the $5.00-$5.50 support zone or upon confirmation of demand in lower imbalance zones.
Targets:
First Target: $12 (upper imbalance).
Second Target: $16 (gap fill and imbalance).
Final Target: $21-$22 (major resistance).
Stop Loss: Below $4.50 to manage risk effectively.
Supporting Indicators:
RSI: Approaching oversold conditions, suggesting a potential reversal soon.
Volume: Noticeable spikes in volume around the current levels indicate increased market interest.
Long-Term Outlook:
Rigetti Computing is showing signs of building a strong foundation for a bullish trend. The imbalances, coupled with historical demand zones, offer significant upside potential for long-term investors. Patience will be key to capitalize on this opportunity.
What are your thoughts on this setup? Share your feedback and alternative perspectives below!
Trade safe and stay disciplined! 🚀
#RGTI #TechnicalAnalysis #BullishOutlook #AIStocks #QuantumComputing #TradingPlan #SupportResistance #LongTermInvesting
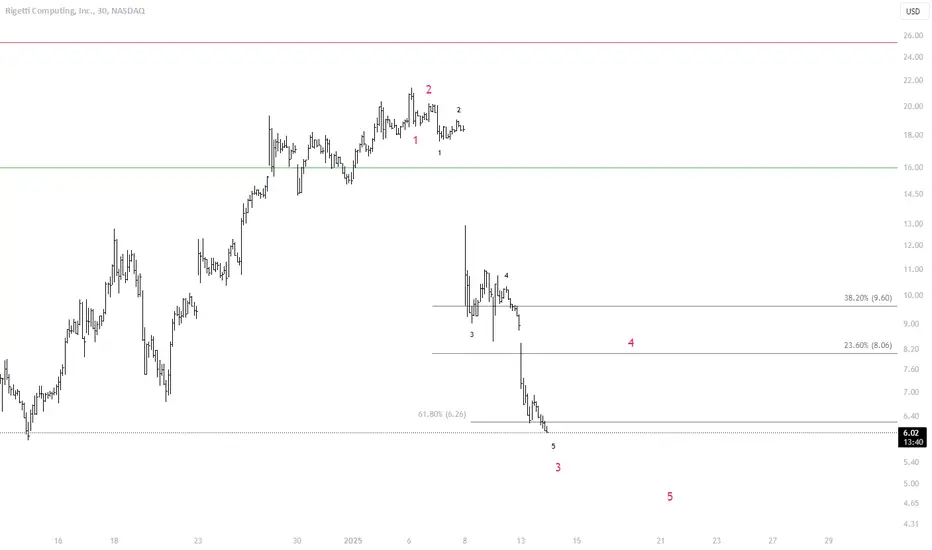
RGTI Speculative Rebound Expected Before Final Wave DownTechnical Analysis of RGTI (30-Minute Timeframe)
The stock is currently moving within a clear impulsive wave structure on the 30-minute timeframe. Based on my observations, it appears to be at the end of wave 3. I anticipate a speculative rebound in the short term, with a target around $8. However, a decline in wave 5 may follow to complete the overall impulsive movement.
⚠️ This analysis is merely a forecast based on technical observations. It does not constitute investment advice or a recommendation to buy or sell this stock.
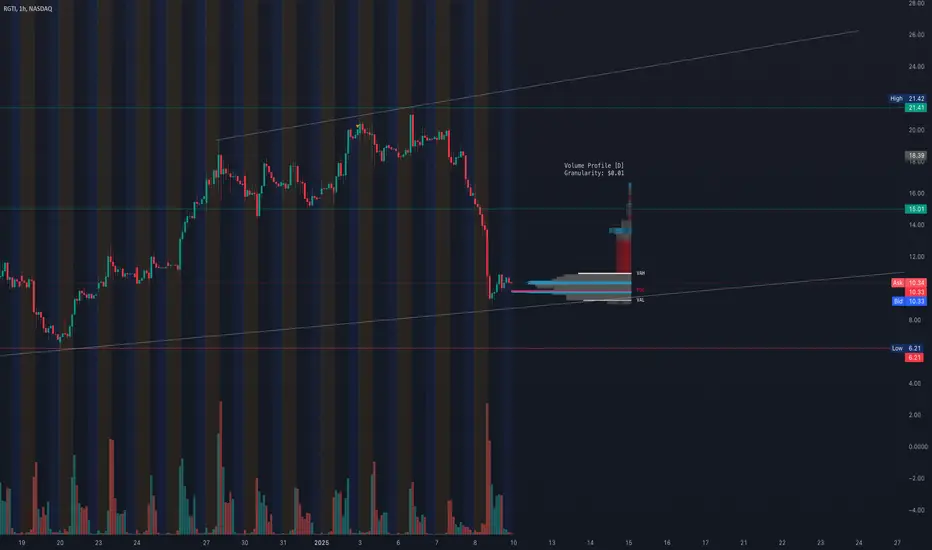
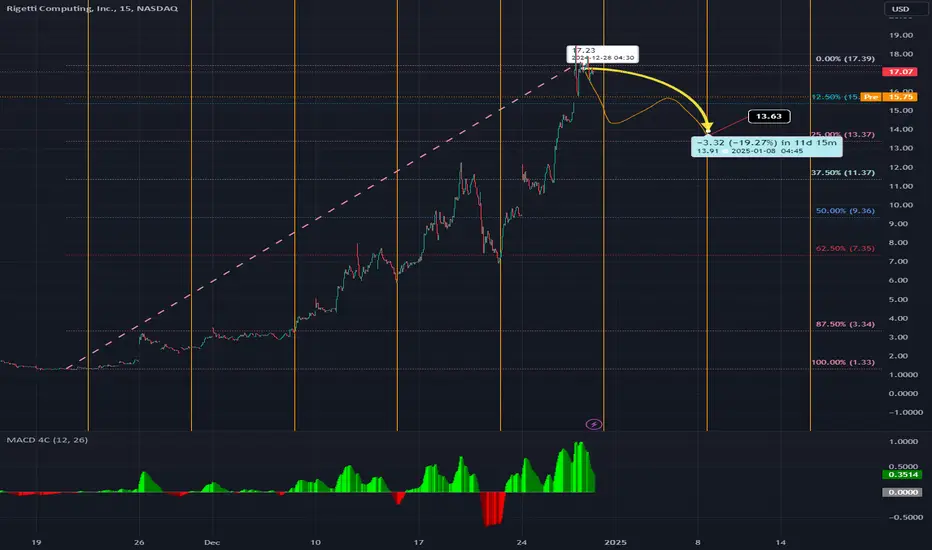
RGTI Insights After Sell-Off
Short-Term Outlook: Bearish
The strong sell-off and high volume indicate significant bearish momentum. Unless the price reclaims $12.00, the overall trend remains bearish.
Oversold Bounce Possible
Given the recent sharp decline, a short-term bounce is possible if $10.33 holds. However, such a bounce may be short-lived unless backed by strong buying volume.
Key Levels to Watch
The $10.33 POC is crucial. If this level fails, a move toward $8.00 or even $6.21 is likely.
On the upside, breaking above $12.00 with volume could trigger a move toward $15.00.
Speculative Nature
Like IONQ, RGTI is a speculative stock with high volatility. Quick and large price swings are likely, so it’s important to manage position sizes and use tight stop-losses to minimize risk.
Sentiment
While there’s potential for recovery in the long term, the short-term bias remains bearish unless the price reclaims key levels. Caution is advised.
1. Current Market Structure
* Trend Analysis:
* RGTI is in a clear downtrend, with a significant sell-off breaking key levels. The sharp decline indicates strong bearish momentum.
* The price is now consolidating near $10.33, which aligns with a key support level based on the Point of Control (POC) from the volume profile.
* Volume Profile Observations:
* Point of Control (POC): $10.33 – This is the most traded price level recently, acting as a key pivot point.
* Value Area High (VAH): $15.00 – A major resistance zone for any potential recovery.
* Value Area Low (VAL): $6.21 – This is the lower bound of the volume range and a critical support level to watch if the price breaks down further.
2. Key Levels to Watch
Support Levels:
1. $10.00–$10.33 (POC Zone):
* Immediate support. A breakdown below this level could lead to further downside.
2. $8.00:
* Historical support zone where price might stabilize temporarily.
3. $6.21 (VAL):
* The last significant support where buyers could step in.
Resistance Levels:
1. $12.00:
* The first level of resistance where sellers may reappear.
2. $15.00 (VAH):
* A key resistance zone; breaking this level would suggest a potential shift to bullish sentiment.
3. $18.00:
* A major level to target if the stock shows significant recovery momentum.
Stay Short on this Quantum Computing 10xer RGTINothing special about RGTI, this is rising along other quantum companies like QBTS, QUBT, IONQ just simply due to quantum computing mania not an increase in sales or orders. RGTI burns cash every quarter and has been diluting shareholders every step of the way. Expect a big dilution from RGTI management to take advantage of the 10x run on the market cap; once announced it will send RGTI spiraling downward.
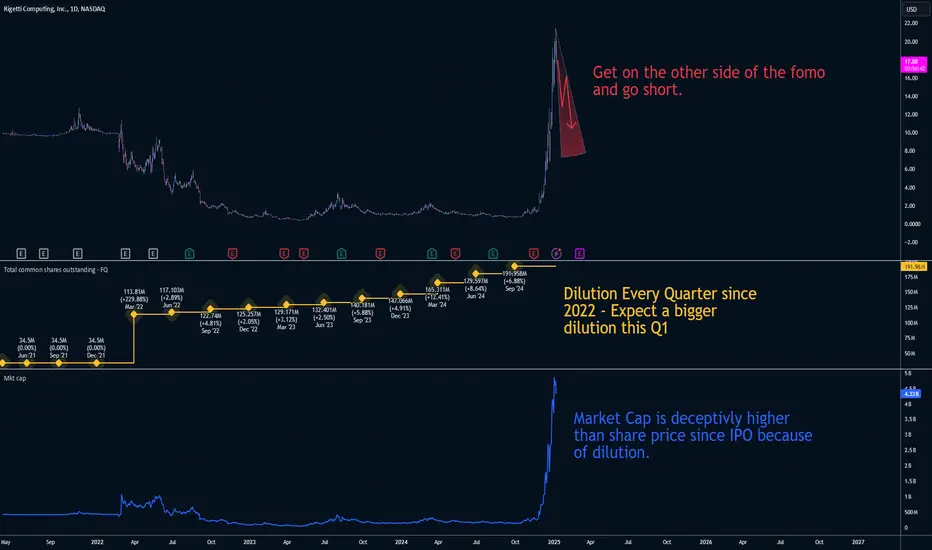
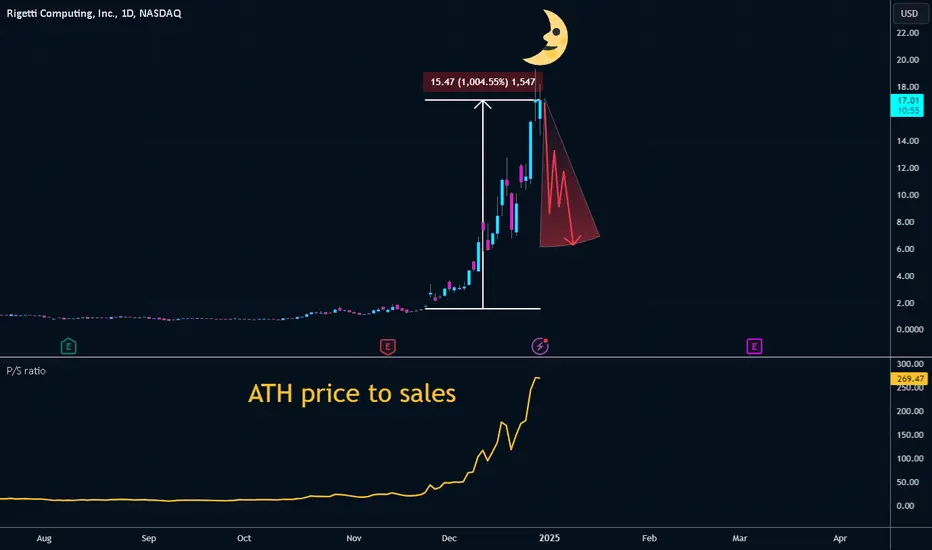
Quantum Bubble Ready to PopRGTI looks like the poster child of irrational exuberance in quantum stocks. New Year Dump incoming after a 1000% in a little over a month and around 2,500% from the 52-week low. No fundamental new sales or orders to back this new increase which is driving the price to sales to all-time highs.
50-60% pullback imminent. scale in.
Just buy - Edition: Multi-day Wedge BreakoutFrom 27 Dec up to Jan 2 we had a nice wedge creation. The graph is bullish.
It can run to 25$ easily.
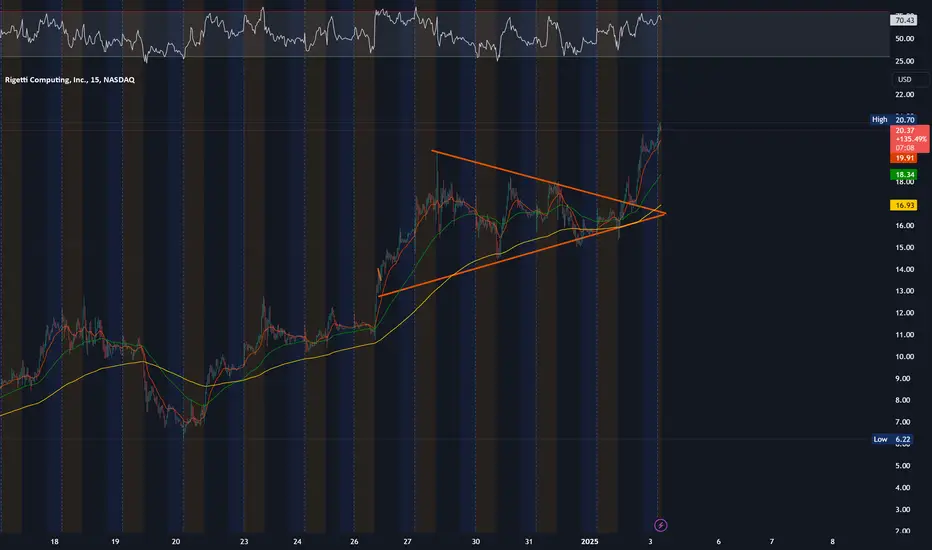
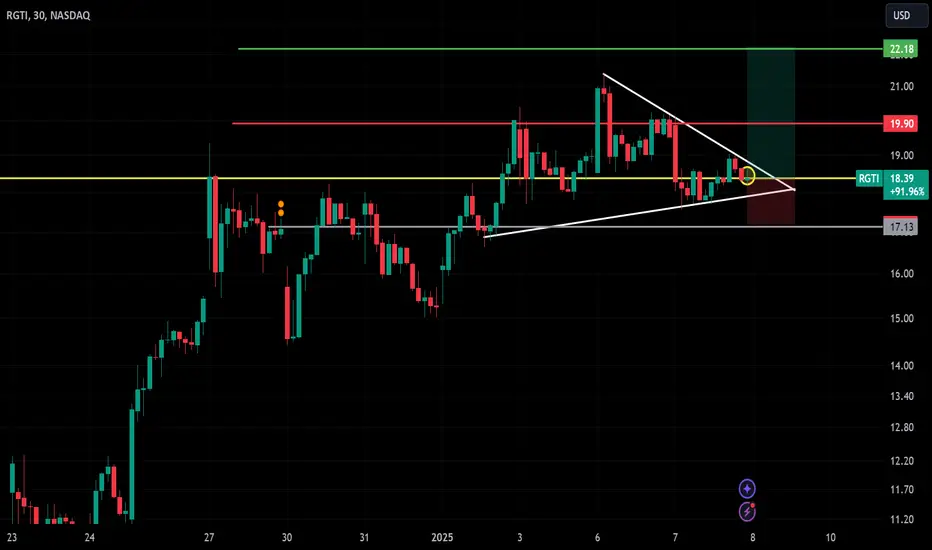
RGTI Symmetrical Triangle Breakout Setup - Entry, Targets & SL!
Entry Point: Around $18.39, marked by the yellow line.
Stop Loss (SL): At $17.13, marked by the white horizontal line.
Target 1 (T1): At $19.90, represented by the red horizontal line.
Target 2 (T2): At $22.18, represented by the green horizontal line.
This setup highlights a breakout from a symmetrical triangle pattern, with well-defined entry, stop-loss, and target levels.
#RGTI #StockTrading #BreakoutStrategy #SymmetricalTriangle #TechnicalAnalysis #TradingSetup #StockMarket #SwingTrading #DayTrading #ChartPatterns #RiskManagement #TradingSignals #PriceAction #ProfitToPath #StockTraders #TradingGoals #TradeSmart #StockBreakout #StockAnalysis!
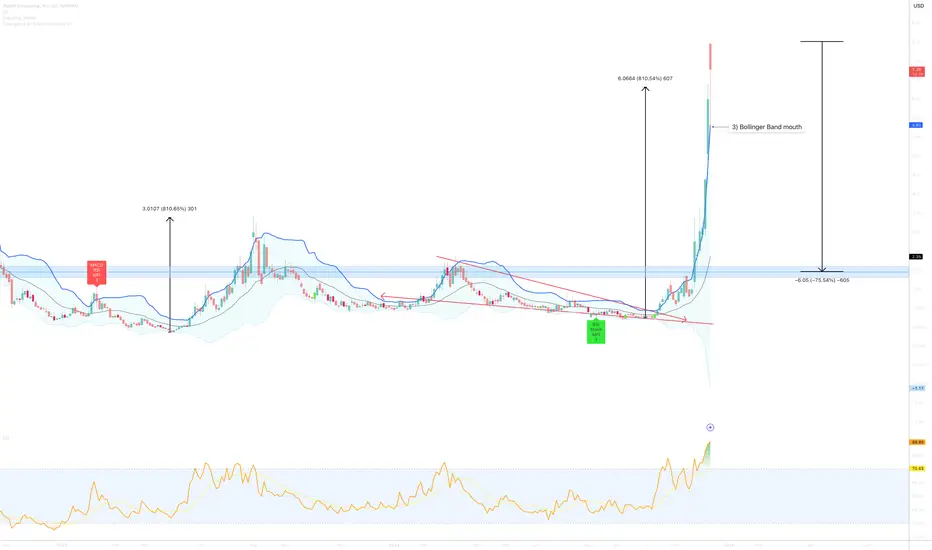
Rigetti Computing, Inc. to print a 70% market crash ??** short trade - weeks ahead **
On the above 2 day chart price action has rocketed up 800% in the last 60 days. Now is a good moment to be “short”, why?
1) Price action meets flag forecast.
2) The forecast area is also monthly resistance.
3) Price action is multiple sigmas from the Bollinger Band Mean. Do not forget, 95% of all price action trades around the mean.
4) First support is around $2.35
5) Everyone else on tradingview is long. WW is a contrarian, that means he opposes popular opinion.
tradingview.sweetlogin.com
Is it possible price action continues going vertical? Sure.
Is it probable? No
Ww
Type: Short trade
Timeframe for short entry: 48 hours
Risk: You decide
Return: 70%
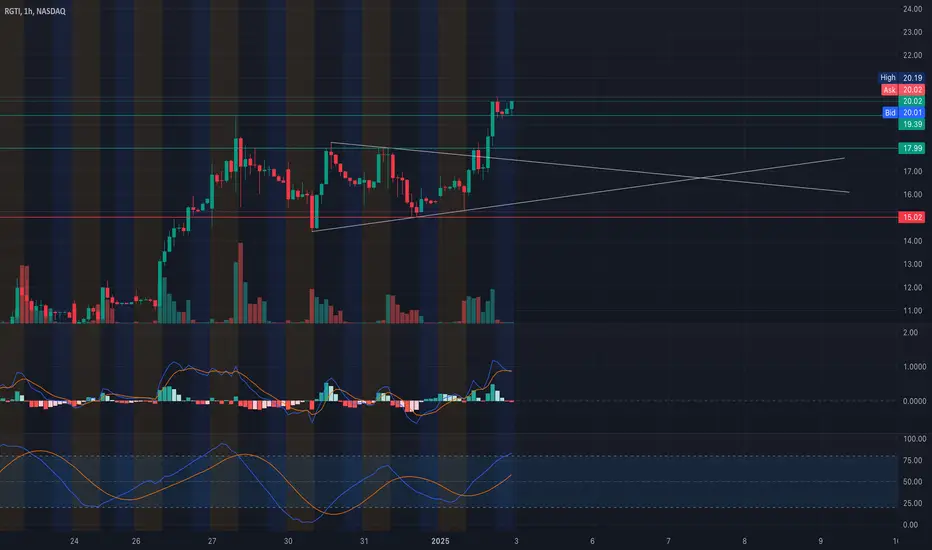
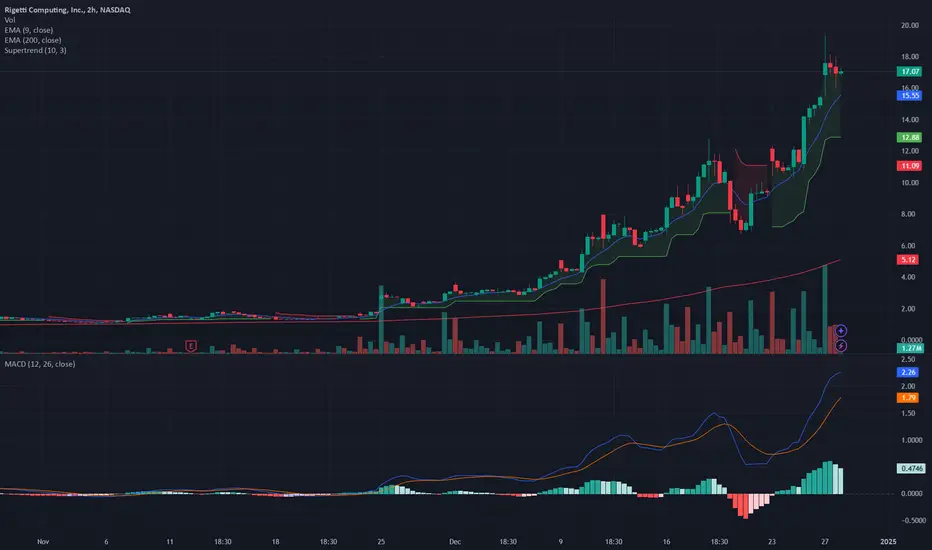
RGTI Technical Analysis and Long-Term Investment DiscussionTechnical Analysis:
* Trend and Momentum (1-Hour Chart):
* RGTI is displaying strong upward momentum, with price action recently breaking above a key resistance at $19.39.
* The price is forming a higher-highs and higher-lows structure, indicative of a bullish short-term trend.
* Volume: Noticeable volume surge during the breakout, confirming buyer strength.
* Indicators:
* MACD: Bullish crossover is confirmed, with the histogram expanding upwards, indicating increasing bullish momentum.
* Stochastic RSI: Approaching overbought levels, suggesting potential short-term consolidation or minor pullback.
* Support and Resistance:
* Support Levels:
* $19.39: Previous resistance turned into immediate support.
* $17.99: Major support aligning with the ascending trendline.
* $15.02: Critical support level; a breakdown below this would negate the bullish trend.
* Resistance Levels:
* $20.19: Current resistance; breaking this level could push the price toward higher zones.
* $24.00: Key psychological resistance and potential mid-term target.
Long-Term Investment Potential
Strengths:
* Industry Position:
Rigetti Computing is a leading player in quantum computing, a sector expected to revolutionize industries such as finance, healthcare, and cybersecurity over the next decade.
* Technology Leadership:
Rigetti focuses on full-stack quantum computing solutions, giving it a competitive edge in an industry still in its infancy.
* Market Sentiment:
Growing interest in quantum technologies could sustain investor enthusiasm, leading to strong capital inflows and partnerships with enterprise clients.
Challenges:
* Early-Stage Company:
Quantum computing is a highly speculative field with many unknowns about scalability, commercialization, and profitability. Rigetti's ability to deliver tangible results remains to be seen.
* Financial Viability:
Startups in this space typically require high R&D costs, and Rigetti may face challenges in maintaining a solid financial position without consistent revenue streams.
* Valuation Risks:
The stock's rapid appreciation may have already priced in much of the speculative future growth, increasing the risk of corrections.
Key Considerations for Long-Term Investors
1. Growth Drivers:
Evaluate Rigetti's ability to secure partnerships, government contracts, and enterprise clients for quantum applications.
2. Market Timing:
While the current bullish momentum is favorable for short-term gains, long-term investors should monitor fundamental developments such as earnings reports and R&D milestones.
3. Risk Management:
The speculative nature of quantum computing investments necessitates a diversified portfolio and a focus on risk management.
Conclusion
Rigetti Computing (RGTI) is a promising but speculative long-term investment in the quantum computing sector. The technical setup on the chart supports a bullish short-term outlook, with a possible rally toward $24.00 if resistance at $20.19 is breached. However, for long-term investors, the company’s financial stability and ability to commercialize quantum technologies will be crucial determinants of success.
Disclaimer: This analysis is for educational purposes only and does not constitute financial advice. Always conduct your own research and consult with a financial advisor before making investment decisions.
The next AppleBought big into this and the profits is insane, great long term stock and its the next apple so the profits will be billions, scoop it all up. I see Ionq as the quantum king and qubt and rgti as good ones too because of their unique systems.
IonQ (NYSE: IONQ): Positioned as a leader in the quantum computing space with its cutting-edge trapped-ion technology, IonQ's share price has already demonstrated impressive growth, reflecting market confidence in its potential. Vieira predicts further upward momentum as demand for quantum solutions increases across various sectors.
Rigetti Computing (RGTI): An emerging player in the quantum landscape, Rigetti is known for its cloud-based quantum computing solutions. With increasing partnerships and advancements in its technology, Vieira anticipates that Rigetti's stock could experience explosive growth as more industries seek to harness quantum capabilities.
Quantum Computing Inc. (QUBT): Vieira has highlighted QUBT as a potential standout, primarily due to its strategic positioning in the quantum ecosystem and its focus on practical applications of quantum technology. With predictions of share prices soaring dramatically, QUBT is on the radar of savvy investors looking for the next big opportunity.
Biggest short squeeze of 2024Massive short squeeze here. Clowns like shorting move up are now feeding the liquidity to the upside.
I wouldn’t be touching this stock without very tight stop losses and defined entry and exit points.
Do not be surprised if we pull back here and get one final move to the upside to take out the final shorts with a blow off top.
This is a fun trading stock, not an investment.
"Nothing better than all getting fresh cash" on steroids $RGTIYou thought $5 to $10 in 6 days was a lot?
$5 to $19+ in 13 days is much better on beautiful steady uptrend

There's nothing better than everyone getting fresh cashWhole team wins on another steady uptrend 🙌 RGTI
There's nothing better than everyone getting in on the action and profit
Keep those Santa gifts coming all month long 🎅🎁

RGTI -Is Quantum Computing the next bitcoin ?Alt coin fans take attention ,maybe the next bitcoin is not a crypto .
I strongly feel its quantum computing with 2 trillion expected to flow into this sector by 2030 after Google did a big breakthrough in this sector !
RGTI a small cap stock has gone up by 10x in the last 45 days .
Its a BUY but wait two weeks for a dip around 13-14 $ mark
RGTI...The Quantum leap down..extended hoursSame as the last post/idea I did but now its based on extended hours...Lines shift a bit and new trades become more clear. So, be careful cause if you suddenly hear a roaring meow come up...be ready to dodge, dip, duck, and get the .... out..
RGTI... Careful , there are Quantum risksJust a little rainbow magic on the screen...more so to prove points of big candles following big gaps...
Rigetti Computing (RGTI): Explosive Momentum—What’s Next?🔥 LucanInvestor’s Commands:
🩸 Resistance: $18.00. A breakout targets $19.50 and $21.00.
🩸 Support: $16.50. A breakdown exposes $15.00 and $13.50 as potential retracement levels.
🔥 LucanInvestor’s Strategy:
🩸 Long: Above $18.00, aiming for $19.50 and $21.00. Sustained high volume is essential to maintain the rally.
🩸 Short: Below $16.50, targeting $15.00 and $13.50. A loss of momentum could trigger profit-taking.
🩸 Rigetti is up an astounding 597% over the past month, showing parabolic growth. MACD remains positive but signals caution with reduced momentum. The stock is heavily overextended, making these levels critical for direction. Traders should watch volume spikes for confirmation at resistance and support levels.
👑 "In the chaos of volatility lies the chance for extraordinary rewards. Will you seize it?" — LucanInvestor
RGTI | Next Leg Higher Incoming | LONGRigetti Computing, Inc. provides full-stack quantum computing services. It serves global enterprise, government, and research clients through its Rigetti Quantum Cloud Services platform. The company was founded by Chad Rigetti in 2013 and is headquartered in Berkeley, CA.

$NASDAQ:RGTI breaking out of a bullish flagNASDAQ:RGTI appears to be breaking out of a bullish flag with ~$14 Price Target (PT).
Awaiting confirmation on volume, but 100M shares have traded 2 hours into the trading day, which matches recent daily volume. Long story short... looks like there's going to be a lot of volume today.
As I get closer to the PT, I'll set up a trailing stop to help maximize profits/minimize loss.
Good luck!
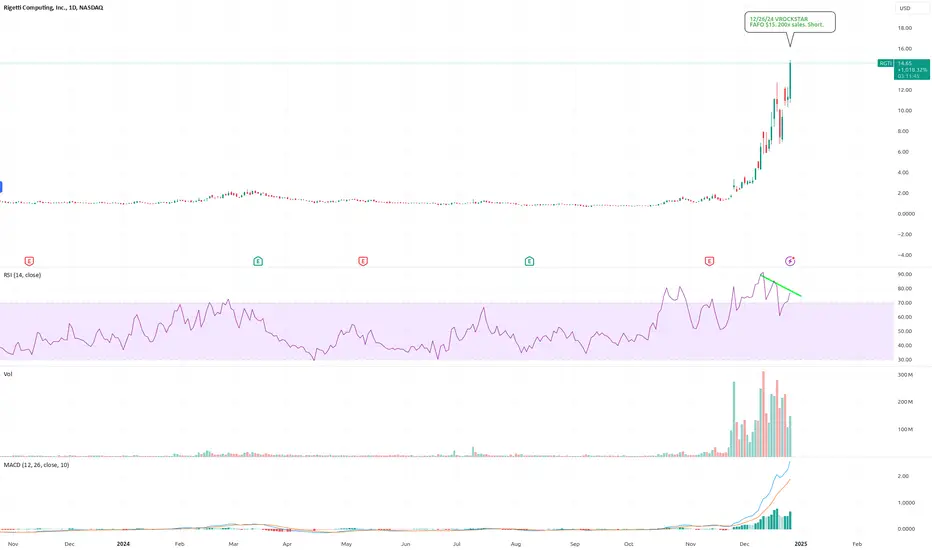
12/26/24 - $rgti - FAFO $15. 200x sales. Short. 12/26/24 :: VROCKSTAR :: NASDAQ:RGTI
FAFO $15. 200x sales. Short.
- you guys know my thoughts on quantum per a few recent posts on NASDAQ:QUBT (lol) and OTC:BTQQF (long, but measured).
- but C-tier garbage like NASDAQ:RGTI at 200x next year's sales and having missed missed missed (they do deliver pressers though!) might take a dump in your new year's stocking if mgmt r smart. they burn cash for as long as the eye can see... so dilution is par for the FAFO course.
- could it meme higher? obviously. y'all don't even own it, renting the C's and driving gamma in an illiquid tape.
- i'm short the next week P's at 13 strike will adjust accordingly, but one bad wick lower will drain the pond.
- as always, may the luckiest balls win. all the best if you're long, and in earnest, congrats. but if u don't pay urself here, i hope the logic is more nuanced than "quantum iz future".
- math matters
V