6/28/24 - $smr - short >$11let's be clear - i want nuclear/ esp the mini reactor-tech to succeed
but there's a difference btwn stonks and reality, sometimes. and this difference can persist for some time. the stronger the meme the stronger the stick.
and while my preferred way to play nuclear is OTC:SRUUF - the physical uranium - bc lets be honest i am not housing that lol. it's going into all of these products, large to mini scale, or will be very correlated to the success of the industry. the margin of safety is massively better as well when considering the valuation of some of these plays.
NASDAQ:NNE - go read it - fine to trade it - but you better have a killer entry to feel comfortable holding (you know who you are)
NYSE:SMR - did you see last quarter? this thing will trade at 100x SALES. mmhmm. honestly guys, it just comes down to math sometimes. i can't guarantee anything in the world we live in, but i'd guess there's a 95%+ chance in the coming year you'll see this stonk a lot cheaper.
does it go higher in the meanwhile? honestly idk.
nobody is going to take this out at a 3 bn valuation. i guess i should never say never about anything. but i'd say the probability is very (very very) low.
so just be careful here.
it's a hedge for me, to be sure against my $sruuf.
but this valuation is borderline hilarious. and nuclear isn't a meme yet.
just be careful at a minimum, k?
V
SMR trade ideas
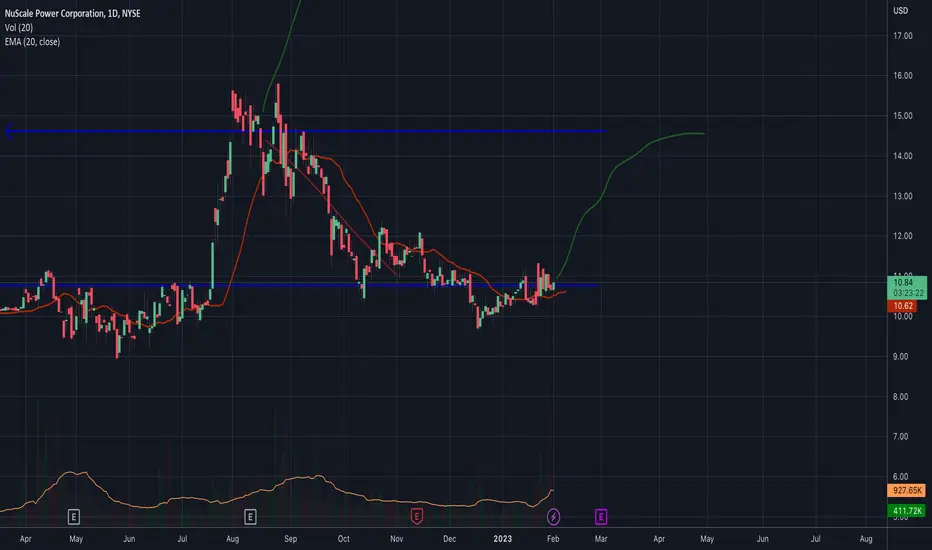
$SMR - Retesting all time highsPower move out of the channel, few bullish days in a row. Aim to retest $16 and then possibly move up. May need to cool a bit but not sure, last few days were aggressive. Cooled a bit on the 1 hour, maintain a buy at the 4 hour.
Not trade advice.

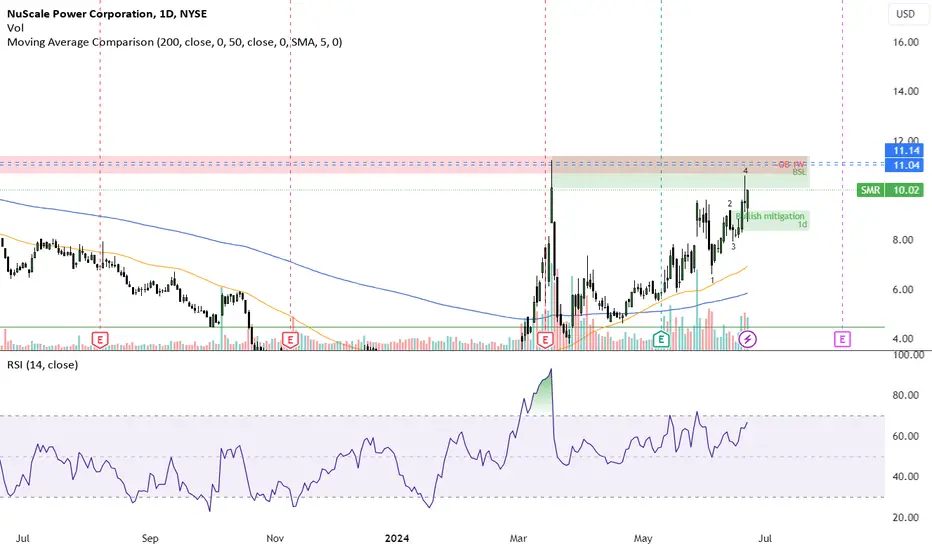
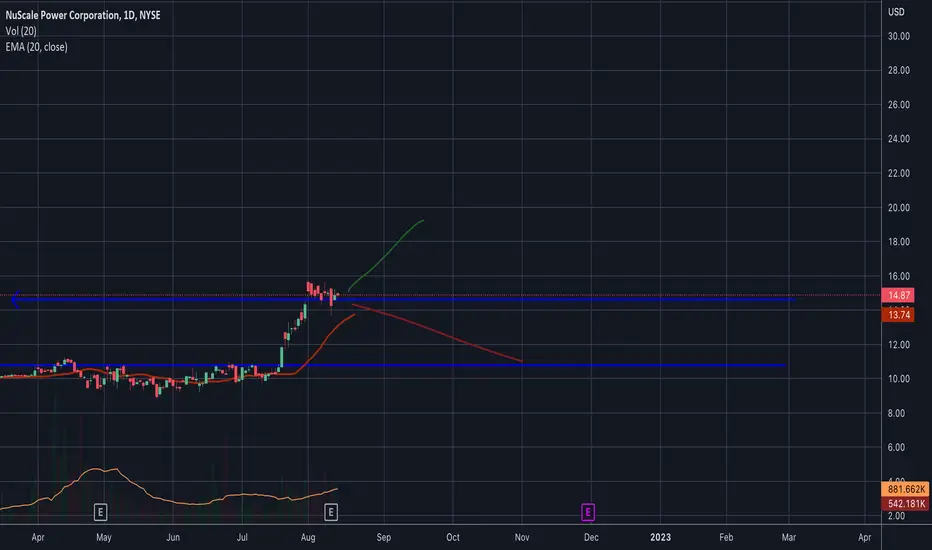
SMRHeading toward Buy side liquidity (BSL); if we fail to close above the weekly order block, another pull back is to be expected.
the Bullish mitigation block is also a high probability indicator that we will be going upwards, at least short term. we tested it and now going up to buy side liquidity.
SMR approaching DCA opprtunityNYSE:SMR is approaching a potential entry point for the start of a DCA strategy for a long term hold.
SUMMARY
Wait to see where the price moves. Using a combination of RSI reaching 30 and the price falling to (with a 3 day filter) around $4 or if the price continues to fall then around $2 (another 3 day filter at this level too), begin entry with a DCA strategy. Alternatively, if the price rises above $6, after a 3 day filter, begin DCA. If the price starts forming a flag between $5 and $5.80, enter once RSI has reached 30 (for those with a higher risk appetite can just use the RSI as an indicator) or await a range breakout/down to either enter at the $4 or $2 or $6 level as described above with or without a three day filter.
The price was seeing exponential growth in the leadup to the latest quarterly earnings report and popped a few days after. However, the price has subsequently fallen back down and now seems to be forming a pattern.
It is unknown really what caused the price to jump. And there has not been any significant insider trading on the day (or lead up to the day) where the price recently peaked.
The company itself has a healthy balance sheet and debt/equity ratio. It is still in the growth phase as they build somewhat emerging tech (nuclear power is established but their approach to providing customers modular smaller power stations is unique) and a large part of their customer base is still a maturing market (power hungry data centres wanting their own onsite nuclear power source, particularly those now being setup for providing AI). The company's income statement reflects this as net income over the recent years remains negative and is also not showing an upwards trajectory.
With this in mind this would be a stock for a long term hold with a DCA investment strategy until, whichever comes first, either a total dollar figure invested is reached or the company becomes long term profitable (i.e. exits the growth phase).
With the recent price fluctuations it is crucial to not enter too early as due to the immature nature of the industry and company, the price also has a high likelihood of remaining at a low level for quite some time. However, a DCA entry opportunity is also forming based on one of the 3 of the more likely price trend scenarios described in the chart. Details on these are as follows.
Scenarios 1 and 2:
Wait to see which way the price begins to move and see if it falls to one of the two support levels identified, make use of the RSI to identify the optimum entry point. If the price falls to $4, add in a 3 day filter to see if the price doesn't fall further and likewise add in a 3 day filter if the price continues to fall from $4 to $2. If the RSI has reached 30, and the 3 day filter has shown that $4 or $2 were a support level begin DCA. If the price continues to fall below 2, halt the DCA to see where the price becomes stable and then restart once the RSI starts trending upwards again.
Scenario 3:
If the price begins ranging between $5.30 and $5.80, depending on risk appetite, begin DCA once the RSI reaches 30 or starts trending upwards. If the price breaks out above $6, then add in a 3 day filter to ensure the breakout wasn't a false dawn, and start the DCA investment independent of where the RSI is.

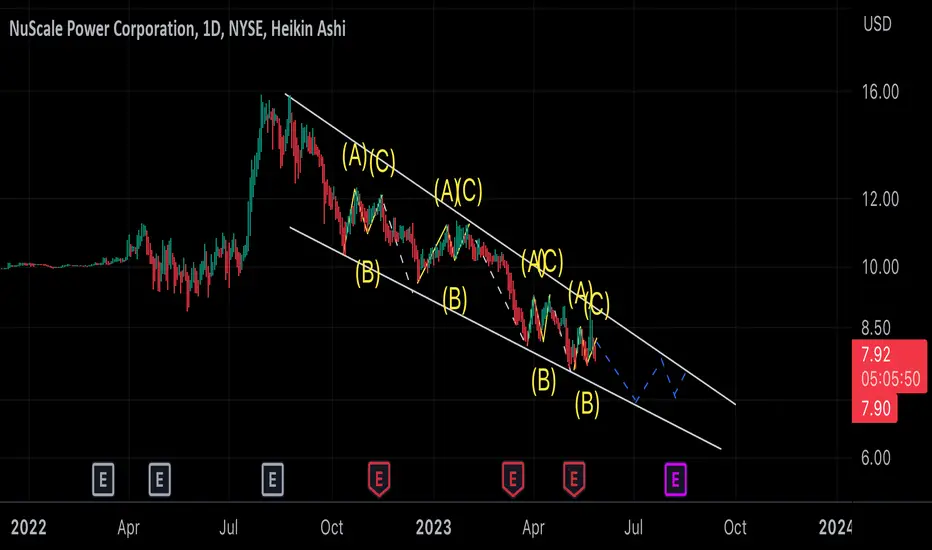
SMR, an algorithmic correctionSMR has been in a steady and predictable decline for about 9 months now. We recently just observed another rejection from the top of the descending macro wedge trend line, and there is currently a fight around the $7.70 to $8.00 range. A strong break below the $7.60 level may have enough momentum to push the price to a new low and I will look for support at the psychological support level of around $7.00.
I am using Elliot Correction waves here to illustrate the correctional structure playing out, and local highs and lows have been reliably trading within the larger descending wedge formation. I believe an upside break of the wedge will occur at some point, but for the time being the downtrend is still intact.
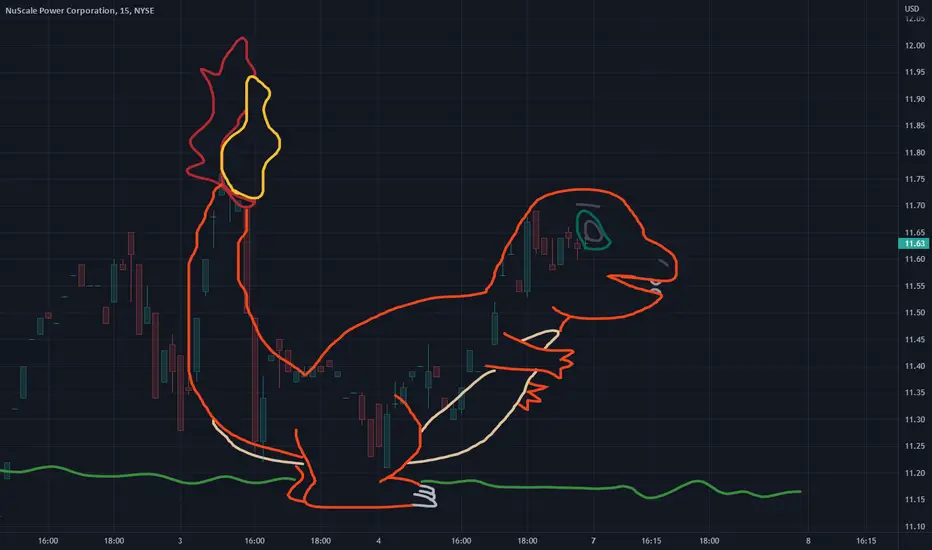
CharmanderIt looks like that $SMR pick up as starter a stubborn Charmander. Hopefully he doesn't set everything on fire.
$SMR Future Expect it to come back down and chop between $10-$15 since no revenue is expected for at least another 5 years.
WyvernWe are slightly above backbone trendline. Hopefully we will close around tail area but prepare your SL at ass level.