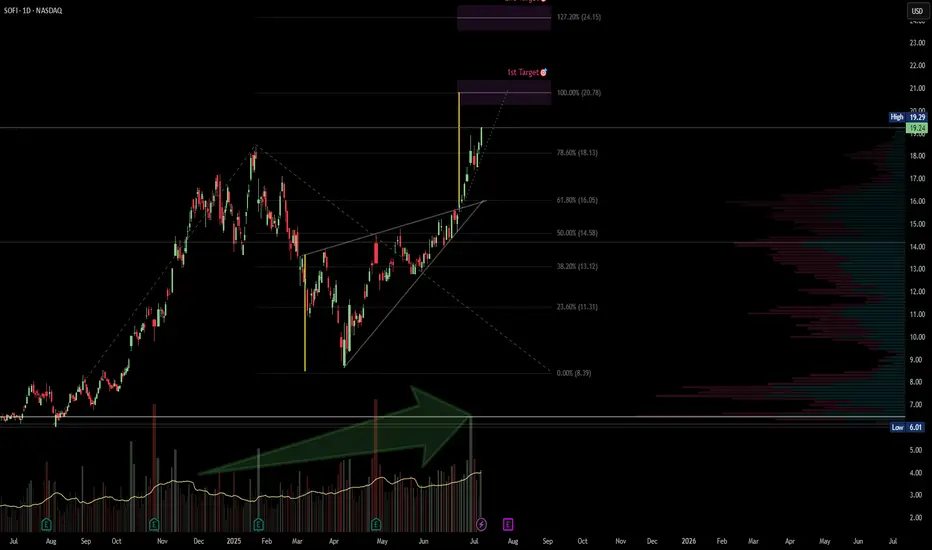
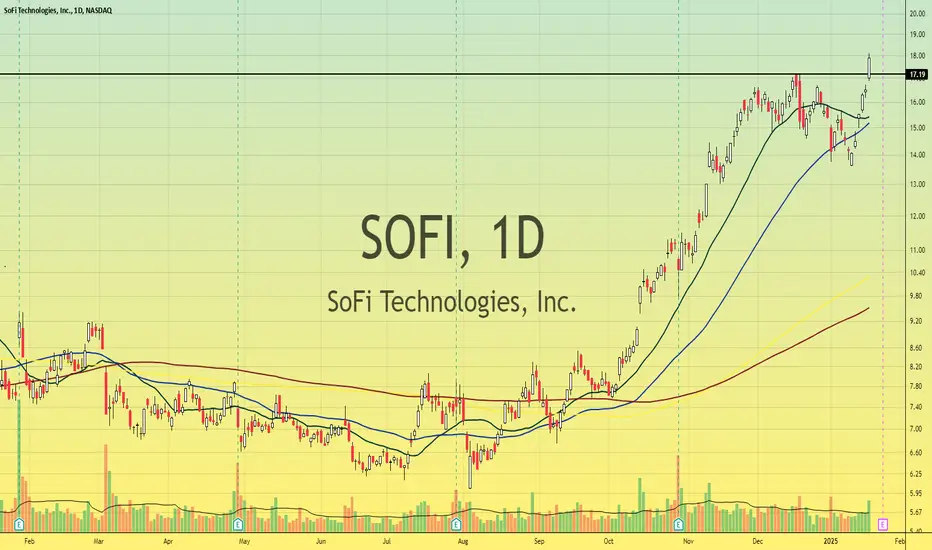
SOFI 4-Hour — “Measured-Move” Breakout Toward $20.8 → $22Structure: Price broke out of a year-long falling-wedge and then punched through an ascending trend-line confluence at ≈ $17.00–$17.50.
Impulse Leg (Yellow): The vertical rally that followed is ≈ $3.75 tall. Projecting that height from the breakout pivot ($17.00) gives 100 % extension = $20.78.
Ta
Key facts today
Next report date
—
Report period
—
EPS estimate
—
Revenue estimate
—
0.385 CHF
452.89 M CHF
3.42 B CHF
1.08 B
About SoFi Technologies, Inc.
Sector
Industry
CEO
Anthony J. Noto
Website
Headquarters
San Francisco
Founded
2011
FIGI
BBG01QF0DG22
SoFi Technologies, Inc. is a financial service platform, which engages in the provision of student loan refinancing options to the private student loan market. It operates through the following segments: Lending, Technology Platform, and Financial Services. The Lending segment offers personal loans, student loans, home loan products, and related servicing activities. The Technology Platform segment focuses on technology products and solutions revenue. The Financial Services segment includes the SoFi Money product, SoFi Invest product, SoFi Credit Card product, SoFi Relay personal finance management product, and other financial services such as lead generation and content for other financial services institutions. The company was founded in 2011 and is headquartered in San Francisco, CA.
Related stocks
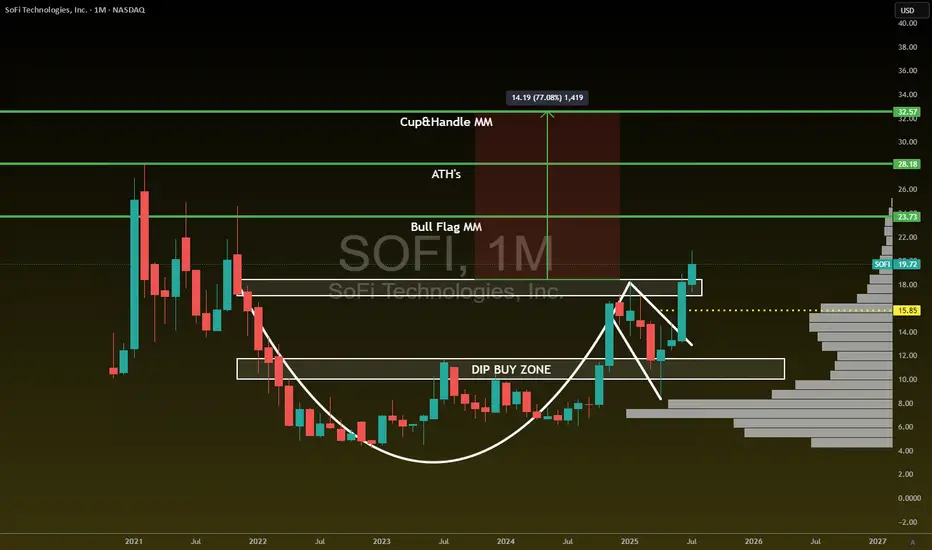
$SOFI - Just getting started!NASDAQ:SOFI - Just getting started!
Monthly CupnHandle Breakout
Looks like we will push into new ATH's this year.
Targets: $23.73/ $28.18/ $32.57
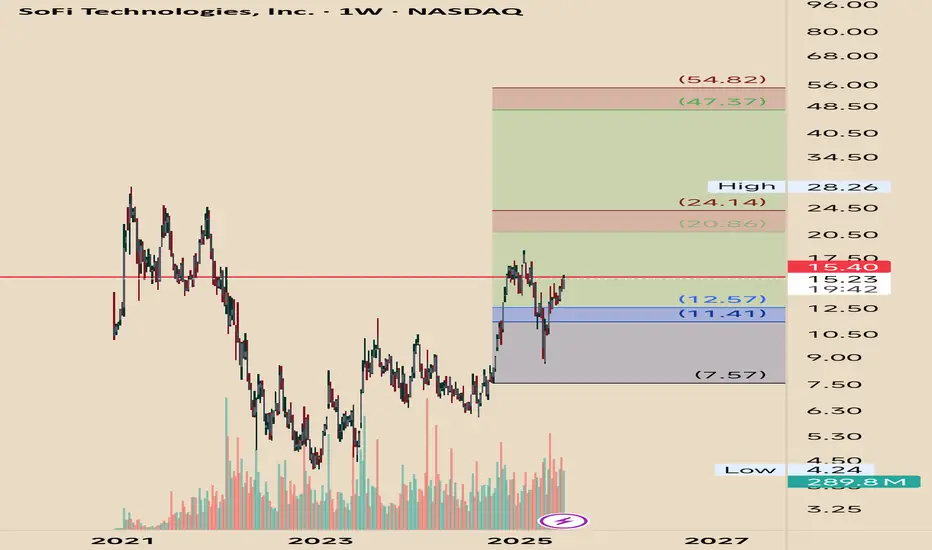
Sofi long ideaHi,
SOFI, at a key technical juncture, reacted to the imbalance or equilibrium of the quarterly bullish breaker. With one level of algo-targets still to test, I'll be looking to add on any downward opportunities.
NFA
LONG 4HR Wave Count Possibilities
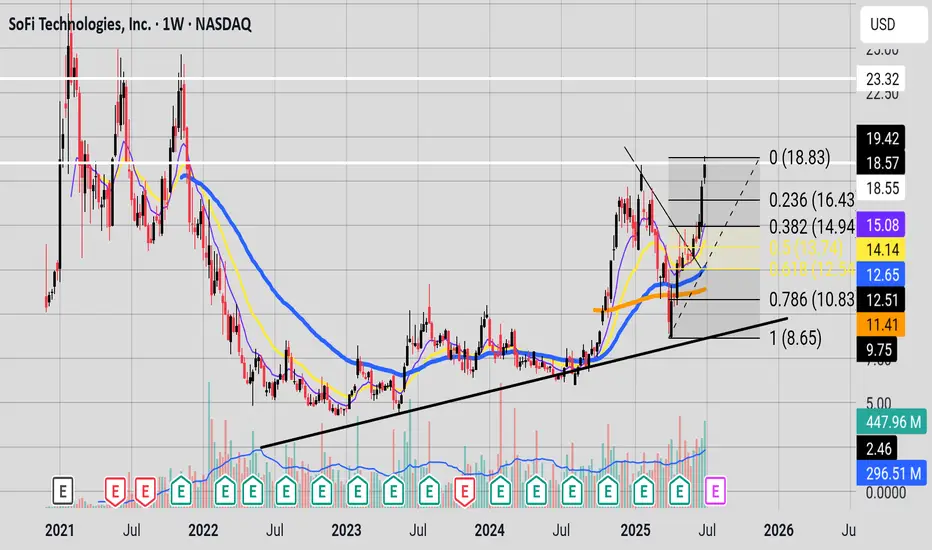
Using the Weekly time frame, Wave 1+3 of a larger degree shows a possible extension to the 1.68 extension which is a common wave 5 of a larger degree target . That Price Target being $26.35.
In April of this year the price reacted to a Reversal Pivot Point but failed to form a proper impulse for
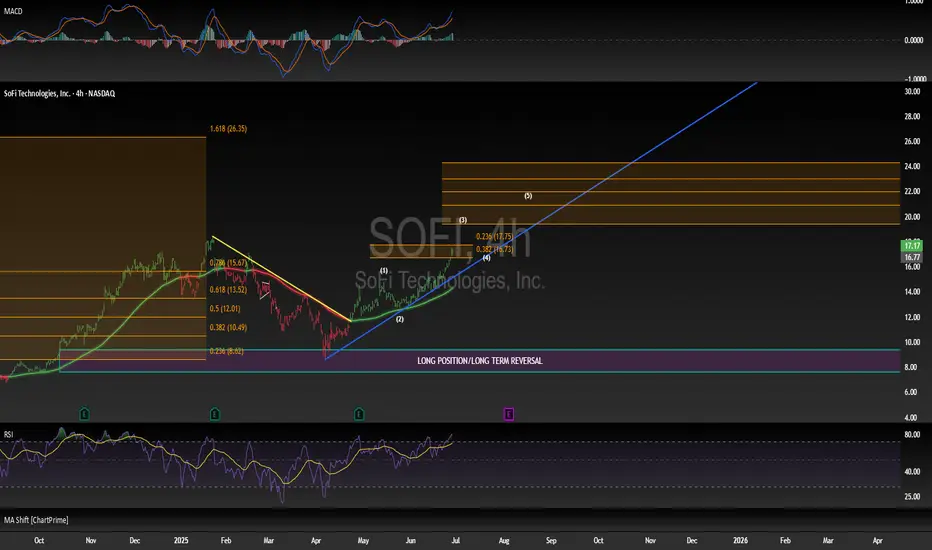
Long for now but would suggest taking profits. Even though major move already happened, I can see it going to 20-21.5 before we hit supply and head lower into next buy zone, unfortunately I don't see strong support until 15 area. Macd's play a role as momentum from buying is going to turn into selling soon.
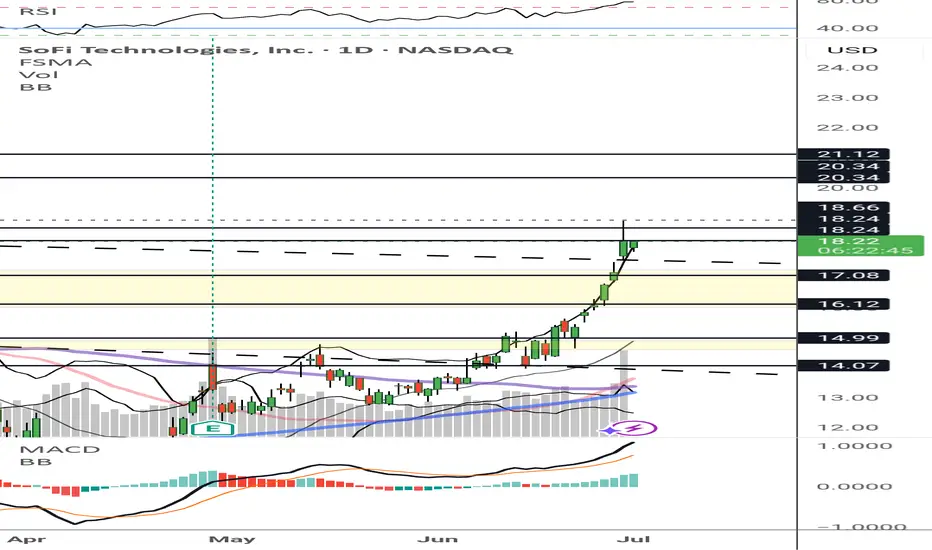
Key Level and QuestionsWe have strong momentum RSI 68.81 at a key level 18.55 . Will the bulls push through the key level at 18.55 and march to next key level at 23.30 price area or will bears take price down to the 16.00 down price level?
How to Do Your “Trading Homework” (The Smart Way)
If you’ve been following this channel, you’ve heard me say it many times:
Trading is war — and you should never enter a battle unprepared.
But here’s the real question:
How exactly do you prepare?
The answer lies in a powerful strategy I use called:
💡 Thematic Investing
Read more here →
Instead of
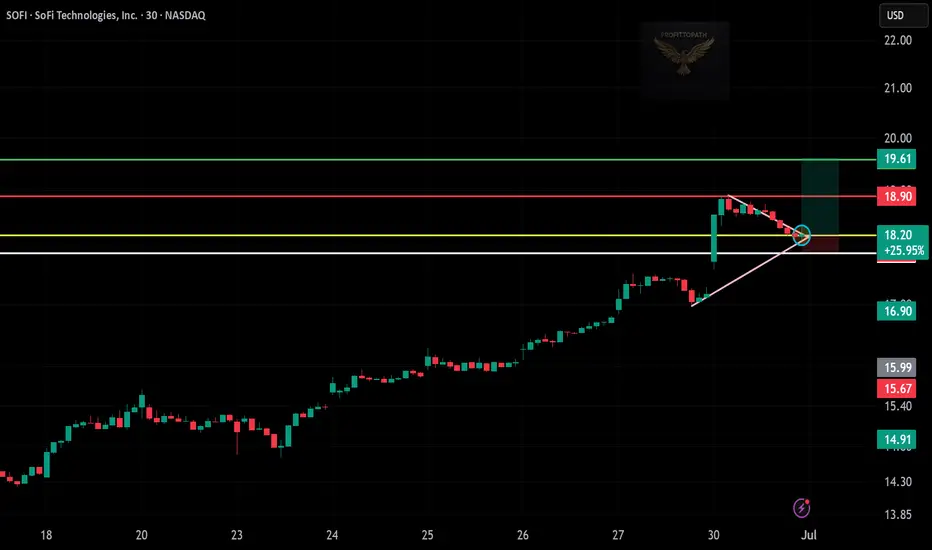
SOFI Breakout Watch!🚀
Pullback into triangle support — bulls eyeing $19.61 next 📍
Entry: $18.20 | SL: $17.80 | TP: $19.61
Pattern says “retest and rip!”
#SOFI #BreakoutSetup #StockAlert #BullishMove #ProfittoPath
Super performance candidate NASDAQ:SOFI has shown strong quarterly earning's growth, with its latest earnings quarter reporting 30% YoY, improving from losses to profits at an impressive rate
Being positioned as a Leader in the FinTech sector and significant institutional adoption, reflecting investor appetite and confidence
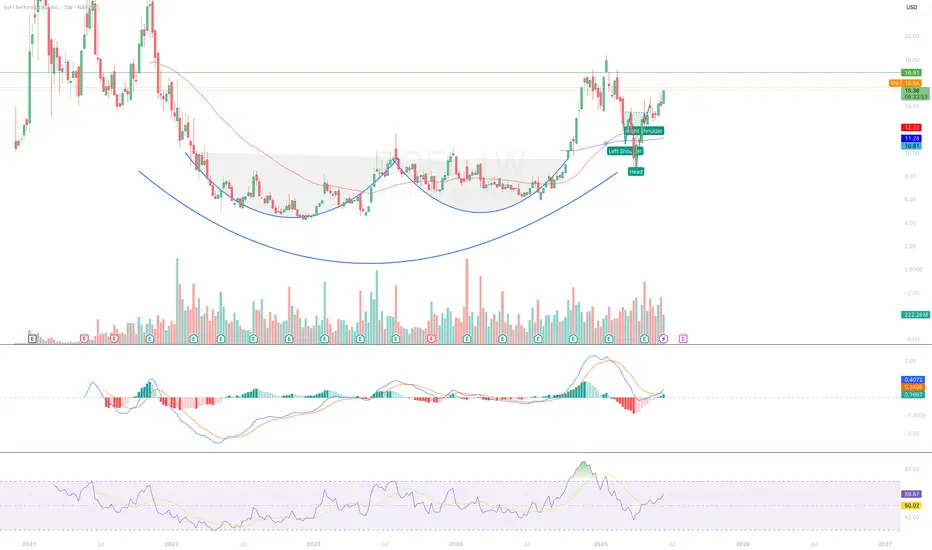
SOFI Classic BUMBUM Breakout !I think I am beginning to like this classic bumbum formation.
NASDAQ:SOFI broke from the classic bumbum formation and retraced back to its support levels at $8.
It has recently started making a bullish reversal move back to $15, in the turn forming an inverse head and shoulder formation.
If t
See all ideas
Summarizing what the indicators are suggesting.
Neutral
SellBuy
Strong sellStrong buy
Strong sellSellNeutralBuyStrong buy
Neutral
SellBuy
Strong sellStrong buy
Strong sellSellNeutralBuyStrong buy
Neutral
SellBuy
Strong sellStrong buy
Strong sellSellNeutralBuyStrong buy
An aggregate view of professional's ratings.
Neutral
SellBuy
Strong sellStrong buy
Strong sellSellNeutralBuyStrong buy
Neutral
SellBuy
Strong sellStrong buy
Strong sellSellNeutralBuyStrong buy
Neutral
SellBuy
Strong sellStrong buy
Strong sellSellNeutralBuyStrong buy
Displays a symbol's price movements over previous years to identify recurring trends.
US83406FAA0
SOFI TECH. 21/26 ZO CVYield to maturity
−11.57%
Maturity date
Oct 15, 2026
US83406FAC6
SOFI TECH. 24/29 CV 144Yield to maturity
−14.93%
Maturity date
Mar 15, 2029
See all SOFI bonds
Curated watchlists where SOFI is featured.


Frequently Asked Questions
The current price of SOFI is 16.787 CHF — it has increased by 16.21% in the past 24 hours. Watch SOFI TECHNOLOGIES stock price performance more closely on the chart.
Depending on the exchange, the stock ticker may vary. For instance, on BX exchange SOFI TECHNOLOGIES stocks are traded under the ticker SOFI.
SOFI stock has risen by 16.21% compared to the previous week, the month change is a 53.83% rise, over the last year SOFI TECHNOLOGIES has showed a 93.62% increase.
We've gathered analysts' opinions on SOFI TECHNOLOGIES future price: according to them, SOFI price has a max estimate of 16.73 CHF and a min estimate of 4.78 CHF. Watch SOFI chart and read a more detailed SOFI TECHNOLOGIES stock forecast: see what analysts think of SOFI TECHNOLOGIES and suggest that you do with its stocks.
SOFI reached its all-time high on Jul 10, 2025 with the price of 16.787 CHF, and its all-time low was 8.670 CHF and was reached on Oct 29, 2024. View more price dynamics on SOFI chart.
See other stocks reaching their highest and lowest prices.
See other stocks reaching their highest and lowest prices.
SOFI stock is 13.95% volatile and has beta coefficient of 2.46. Track SOFI TECHNOLOGIES stock price on the chart and check out the list of the most volatile stocks — is SOFI TECHNOLOGIES there?
Today SOFI TECHNOLOGIES has the market capitalization of 18.70 B, it has increased by 10.48% over the last week.
Yes, you can track SOFI TECHNOLOGIES financials in yearly and quarterly reports right on TradingView.
SOFI TECHNOLOGIES is going to release the next earnings report on Jul 29, 2025. Keep track of upcoming events with our Earnings Calendar.
SOFI earnings for the last quarter are 0.05 CHF per share, whereas the estimation was 0.03 CHF resulting in a 84.00% surprise. The estimated earnings for the next quarter are 0.05 CHF per share. See more details about SOFI TECHNOLOGIES earnings.
SOFI TECHNOLOGIES revenue for the last quarter amounts to 682.28 M CHF, despite the estimated figure of 654.18 M CHF. In the next quarter, revenue is expected to reach 638.21 M CHF.
SOFI net income for the last quarter is 62.96 M CHF, while the quarter before that showed 301.95 M CHF of net income which accounts for −79.15% change. Track more SOFI TECHNOLOGIES financial stats to get the full picture.
No, SOFI doesn't pay any dividends to its shareholders. But don't worry, we've prepared a list of high-dividend stocks for you.
As of Jul 15, 2025, the company has 5 K employees. See our rating of the largest employees — is SOFI TECHNOLOGIES on this list?
EBITDA measures a company's operating performance, its growth signifies an improvement in the efficiency of a company. SOFI TECHNOLOGIES EBITDA is 518.00 M CHF, and current EBITDA margin is 16.72%. See more stats in SOFI TECHNOLOGIES financial statements.
Like other stocks, SOFI shares are traded on stock exchanges, e.g. Nasdaq, Nyse, Euronext, and the easiest way to buy them is through an online stock broker. To do this, you need to open an account and follow a broker's procedures, then start trading. You can trade SOFI TECHNOLOGIES stock right from TradingView charts — choose your broker and connect to your account.