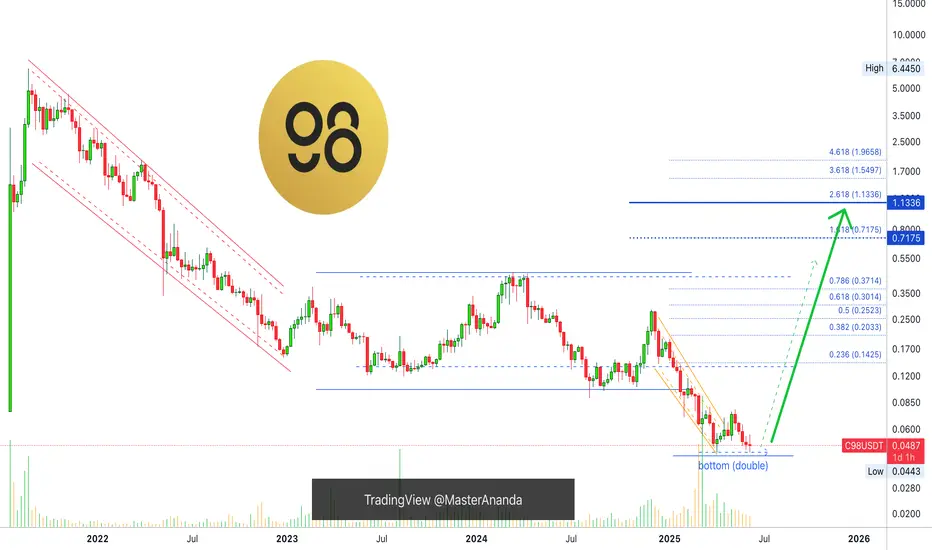
C98 Hits Bottom, More Than 3,333% Growth PotentialHere C98 breaks the pattern, a channel breakdown after going sideways for years. This is the liquidity hunt event. Two signals reveal that this drop is the bottom and precedes a change of trend.
1) The highest volume ever and since 2021 came in March as C98USDT looked for a new low.
2) We have a d
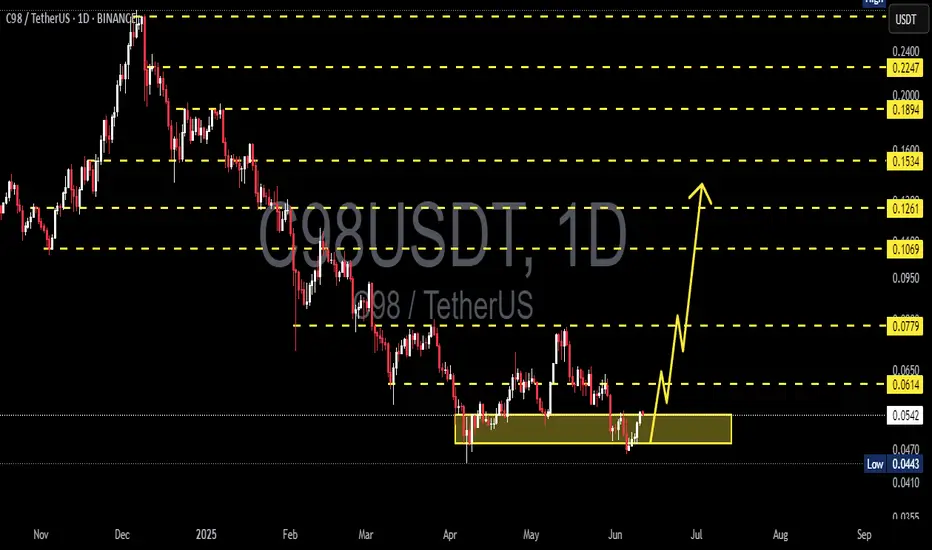
C98USDT 1D AnalysisC98 ~ 1D Analysis
#C98 Buy gradually from here if you still have confidence in this coin with a short term target of at least 15%+ from here.
C98 ANALYSIS FOR Q3 2025🧠 $C98 is grinding against a 15-month down-trend at $0.055, sitting on a 0.048-0.055 demand that’s defended 7× since ʼ23. CMF + falling-wedge basing = compressed spring. 📉→📈
2025 catalyst stack:
• AI Wallet v15 w/ Cypheus assistant 👾
• PowerPool Staking V2 + airdrops
• SwapX cross-chain swap (Sol
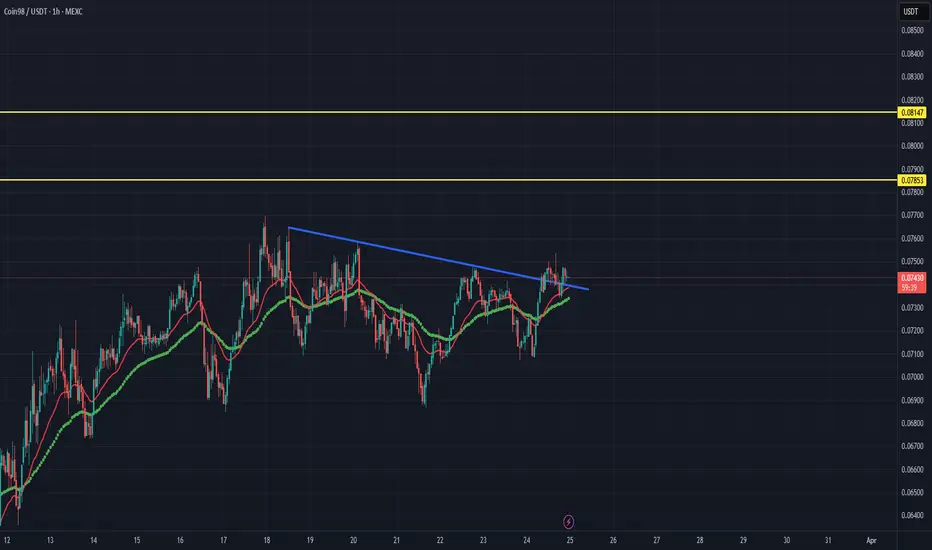
RR=3 buy ideaBullish cypher pattern + price bounced on support level + Bullish RSI divergence + breakout of double bottom's neckline
PS never risk more than 2% of your capital per trade

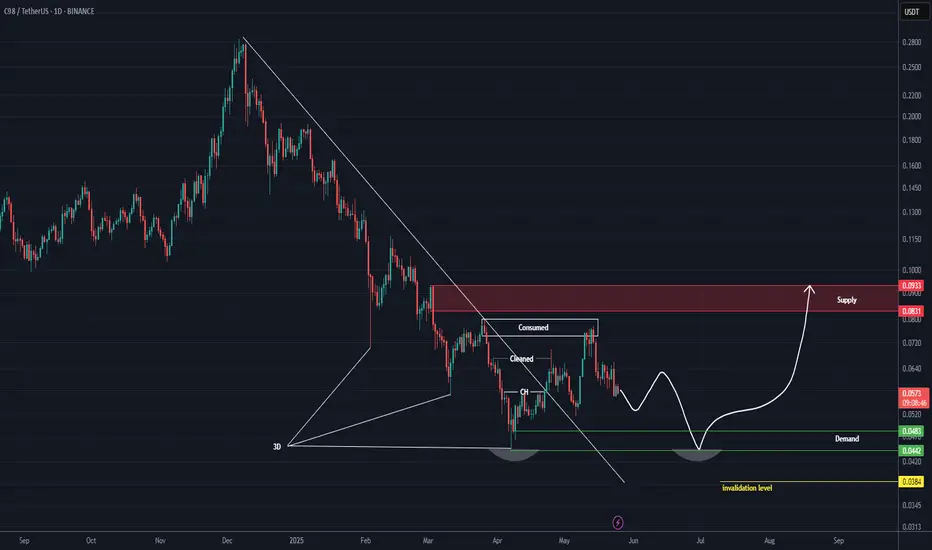
C98 Buy Setup (1D)Based on the 3D pattern formed at the bottom and the breakout of the trigger line, it seems that the origin zones of the move may contain enough orders to trigger a trend reversal for C98.
A double bottom is expected to form, and the price may attempt to attack the marked supply zone.
The support
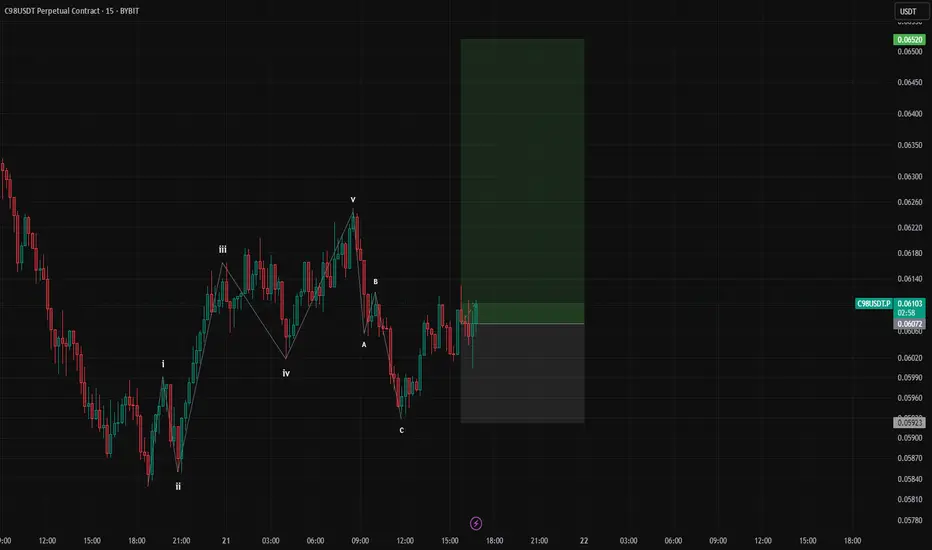
C98/USDT 15M ANALYSISHey Traders! 👋
I'm tracking a potential impulsive Elliott Wave structure on C98/USDT.
📈 Wave Count So Far:
- We completed a clean 5-wave impulsive move up — labeled i through v.
- This was followed by a classic zigzag (ABC) correction, forming what looks like a textbook
Wave 2.
- The corrective
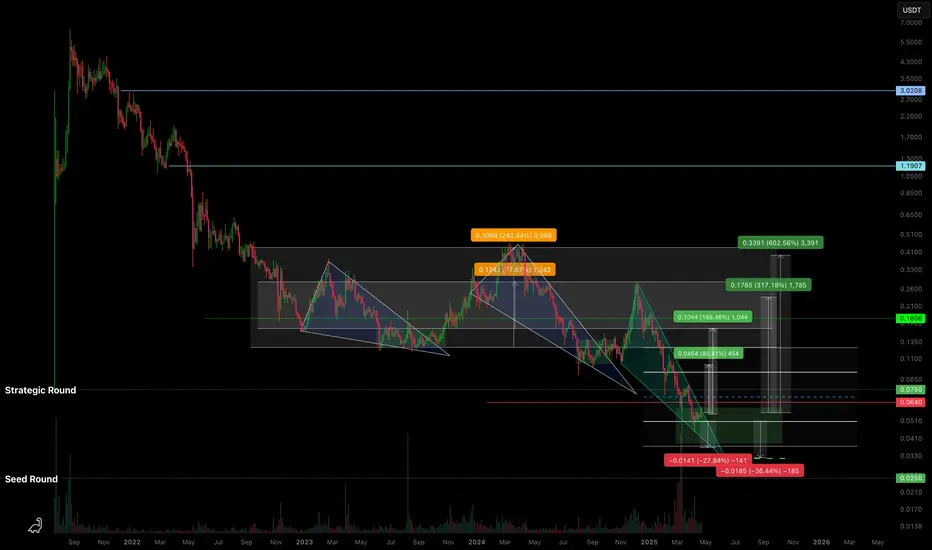
C98USDT — Descending Wedge & High R/R ZoneBased on the current structure, BINANCE:C98USDT is moving within a descending wedge , approaching zones that align with early investor positions.
🔍 What I’m seeing:
Potential drop into the range of a previous horizontal channel - marked on the chart.
We've already reached the Strategic
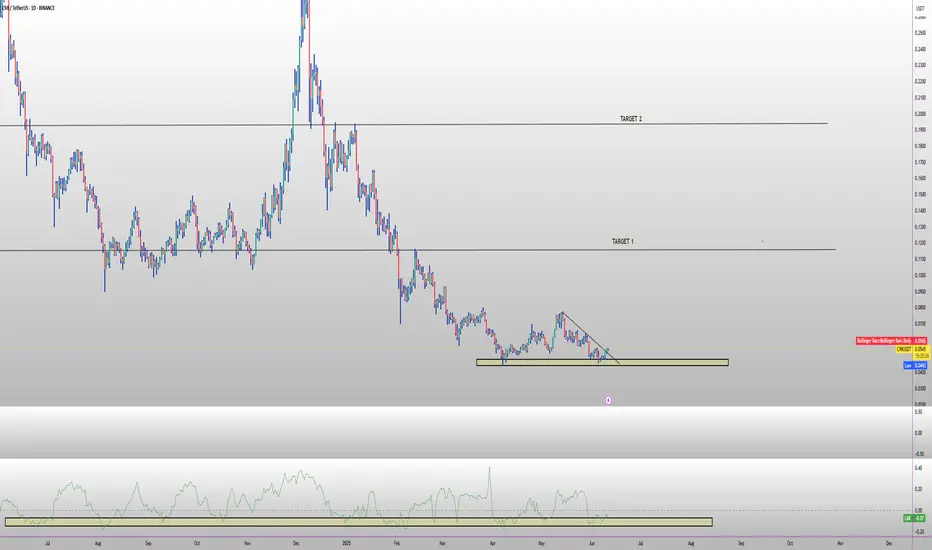
C98USDT 1DC98 ~ 1D Analysis
#C98 Buy after successfully penetrating this resistant line with a short -term target of at least 10%+.

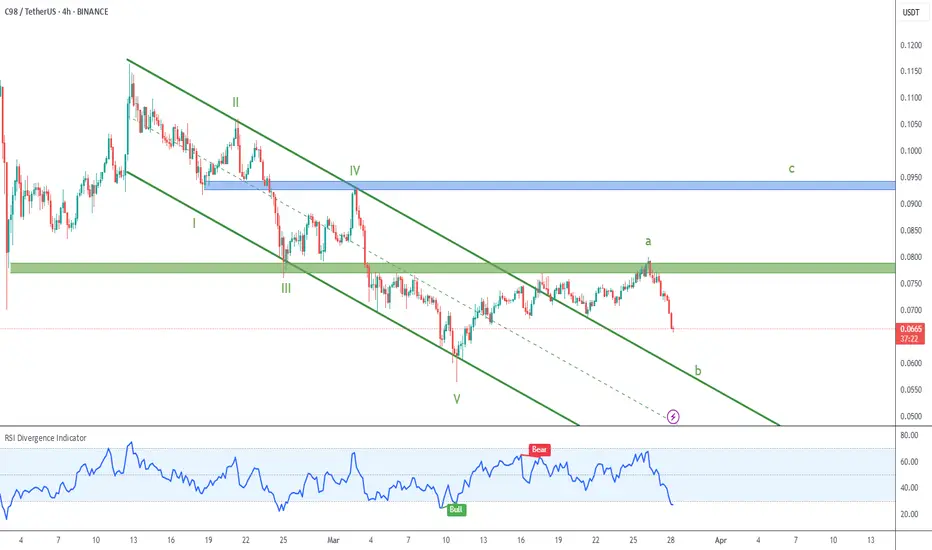
C98 Targeting Higher Levels
Price found support with divergence in the bottom trendline of the green descending channel for green V.
The recovery effort found resistance at the green zone, which I´m considering to be wave a. Let´s see how the correction plays out (green b) for long trade opportunities.
C98USDT // reverse head and shoulders formationAlthough there is a reverse head and shoulders formation on the chart, the targets are drawn according to Fibonacci.
See all ideas
Summarizing what the indicators are suggesting.
Oscillators
Neutral
SellBuy
Strong sellStrong buy
Strong sellSellNeutralBuyStrong buy
Oscillators
Neutral
SellBuy
Strong sellStrong buy
Strong sellSellNeutralBuyStrong buy
Summary
Neutral
SellBuy
Strong sellStrong buy
Strong sellSellNeutralBuyStrong buy
Summary
Neutral
SellBuy
Strong sellStrong buy
Strong sellSellNeutralBuyStrong buy
Summary
Neutral
SellBuy
Strong sellStrong buy
Strong sellSellNeutralBuyStrong buy
Moving Averages
Neutral
SellBuy
Strong sellStrong buy
Strong sellSellNeutralBuyStrong buy
Moving Averages
Neutral
SellBuy
Strong sellStrong buy
Strong sellSellNeutralBuyStrong buy
Displays a symbol's price movements over previous years to identify recurring trends.