SELL TO DEMAND ZONEi will be looking for sell via the hourly timeframe, or sell from 15mins structure.. sellers in control
CADAUD trade ideas
AUD/CADShort position initiated based on recent market trends indicating potential downward pressure.
AUDCAD On The Rise! BUY!
My dear subscribers,
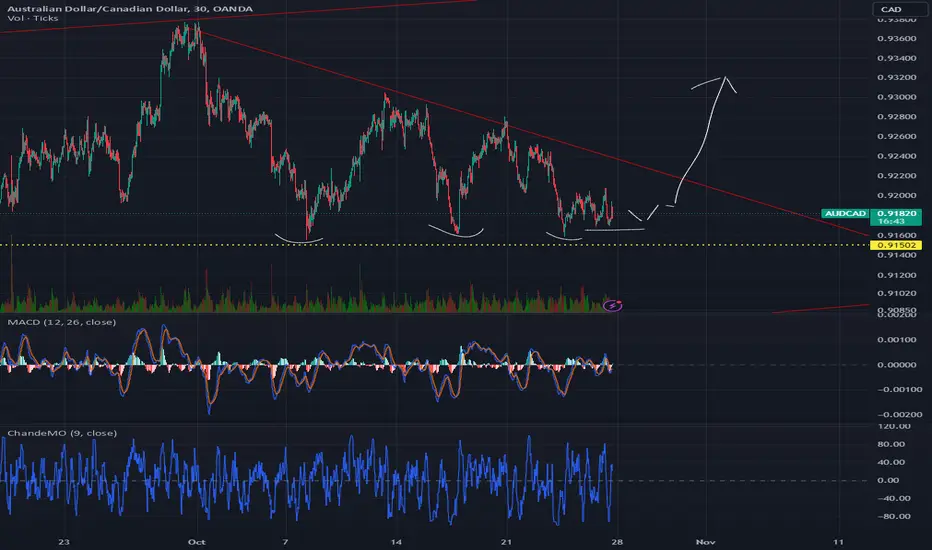
AUDCAD looks like it will make a good move, and here are the details:
The market is trading on 0.9117 pivot level.
Bias - Bullish
My Stop Loss - 0.9084
Technical Indicators: Both Super Trend & Pivot HL indicate a highly probable Bullish continuation.
Target - 0.9177
About Used Indicators:
The average true range (ATR) plays an important role in 'Supertrend' as the indicator uses ATR to calculate its value. The ATR indicator signals the degree of price volatility.
———————————
WISH YOU ALL LUCK
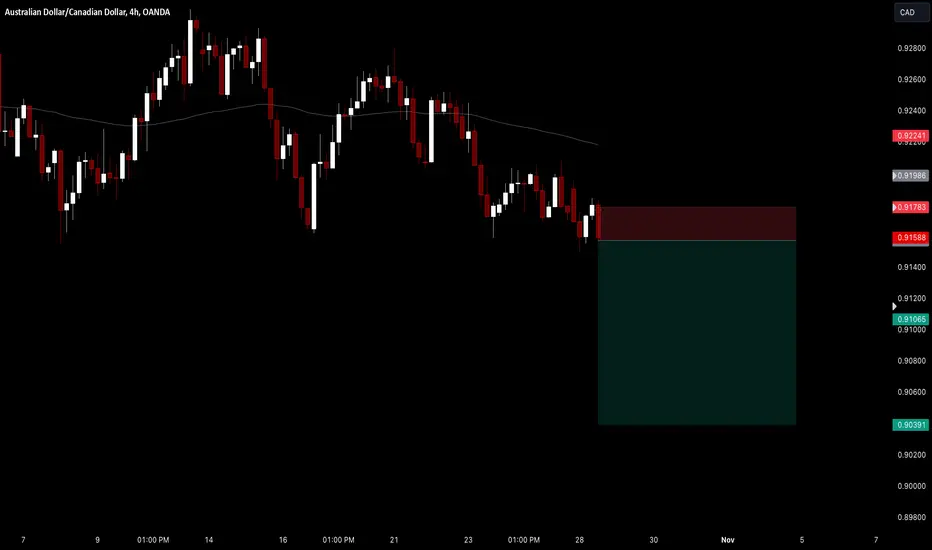
AUDCAD - BEARISH MOVEHello Traders !
The AUDCAD failed to create a new higher high,
The price broke the support level (0.91966 - 0.91551).
This key level becomes a new resistance level !
So, I expect a bearish move📉
______________
TARGET: 0.90475🎯
AUDCAD BUY SETUPGET READY!!! AUDCAD IS GOING TO BUY SOON !!!
Again GOLD is kissing my Supply for the second time and maybe for the last time before Massive Drop. Hello Level 2650.00
( +27 691 362 472 )
AUD/CAD For Bearishyou can go short now
or
wait for entry point as pull-back and then go short
- General Trend is Down Trend
- AUD under pressure
have fun :)

AUDCAD SC43M
BM
Impuls en correction of the big Inv H&S also with the descending channel
M
BM
HIGH NOT TAPPED YET!
W
Very clean S&D zone with impulse from the bulls
BM + Impuls en Correction
D
Fib completion -27 BW
IC
4H
Decel 3
Took a ME
AUDCADAUDCAD is in strong bullish trend.
As the market is consistently printing new LHs and LLs.
currently the market is retracing a bit after last LL, which is also the 50% Fib retracement level and local support as well. if the market successfully sustain this buying confluence the next leg down could go for new LL.
What you guys think of this idea?

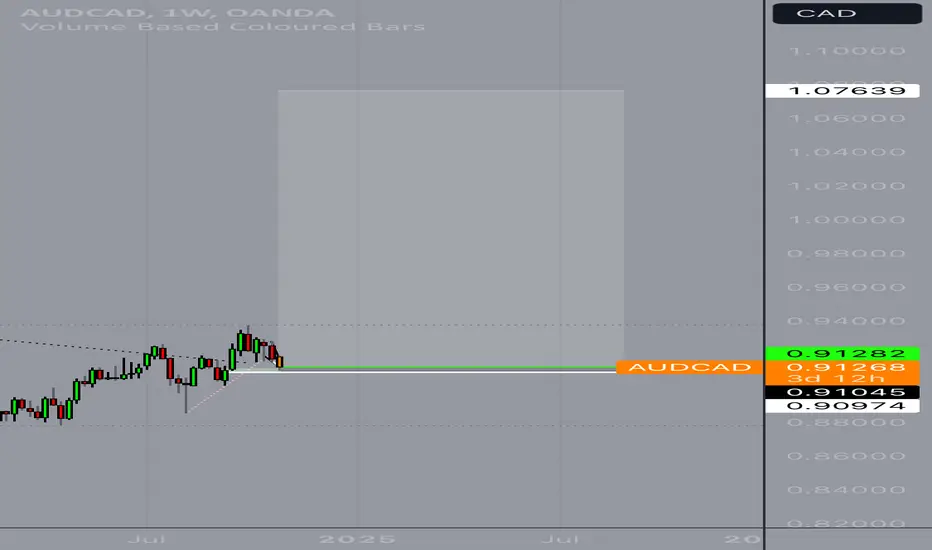
69R Long Trade AUDCADExpecting a big move up on AUDCAD to take course over the period of several months to a few years.
Long term trade
AUDCAD PRINTING DECENDING TRIANGLETechnically:
AUDCAD is printing decending triangle
AUDCAD broke support level which conformition of decending triangle
AXY:Bearish
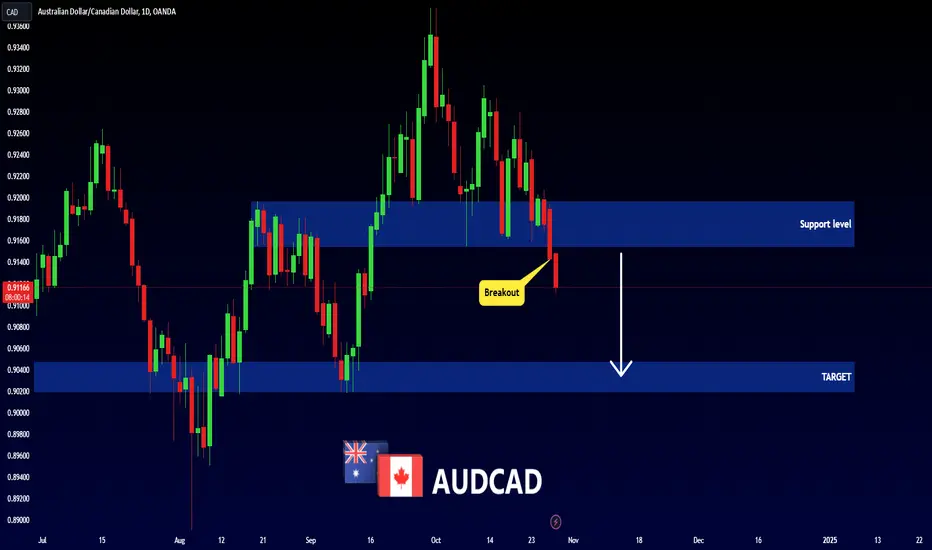
AUDCAD: Breakout & Bearish Continuation 🇦🇺🇨🇦
AUDCAD formed a huge descending triangle pattern on a daily.
A violation of its neckline is an important bearish signal.
Probabilities are high that the pair will drop much lower.
Next support - 0.907
❤️Please, support my work with like, thank you!❤️

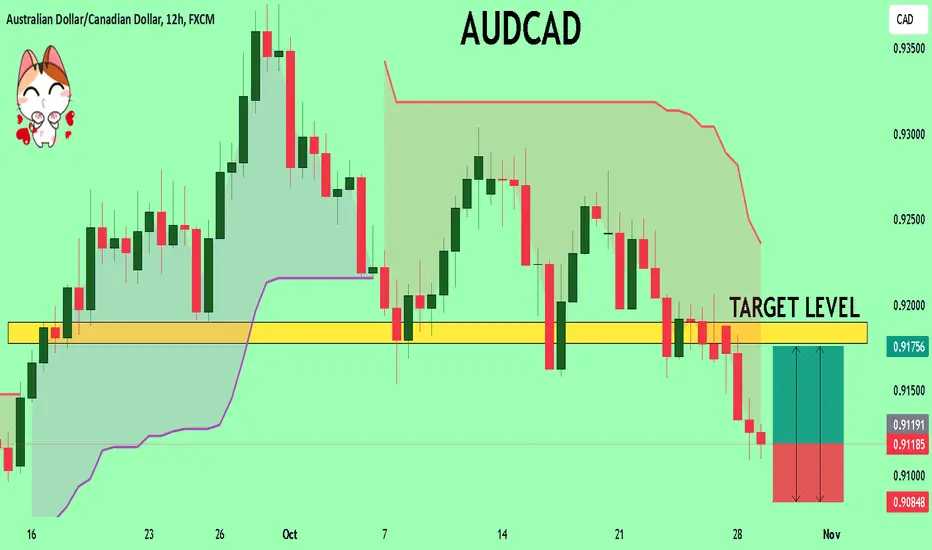
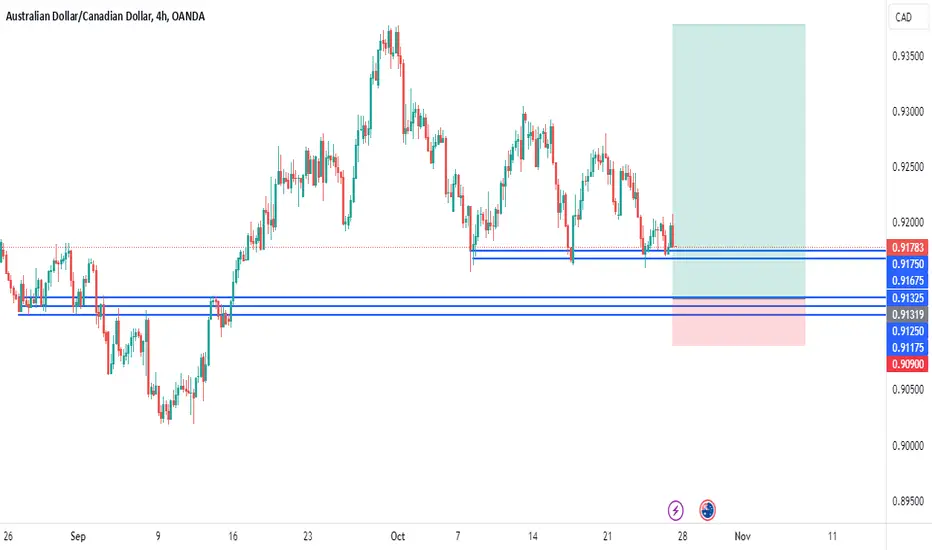
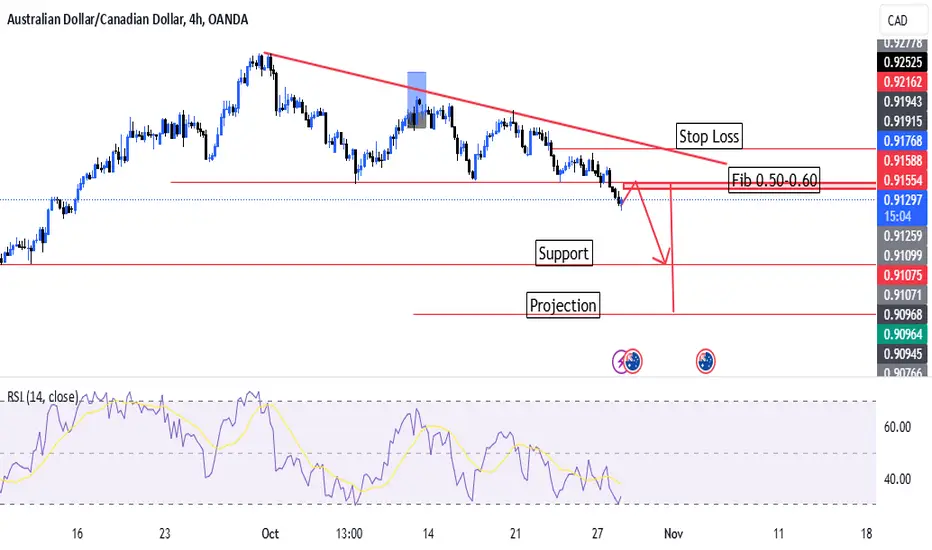
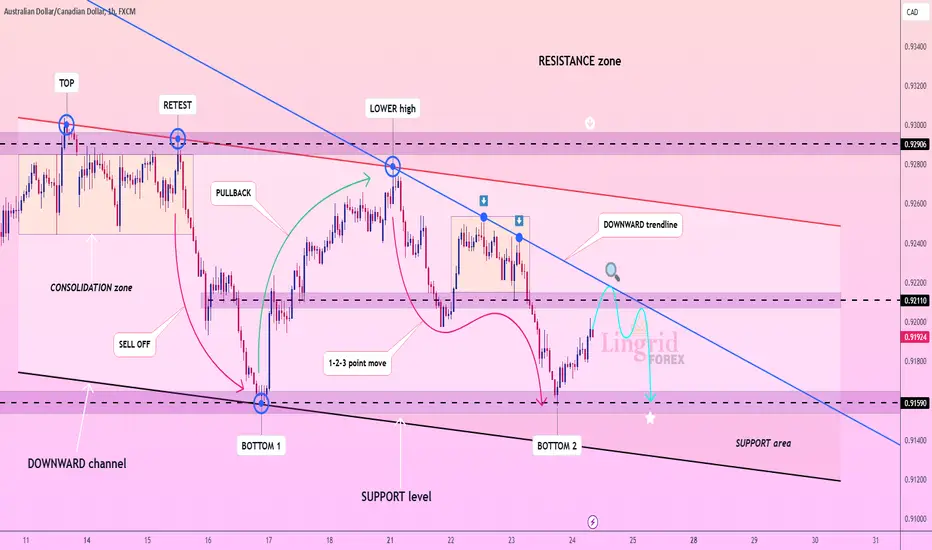
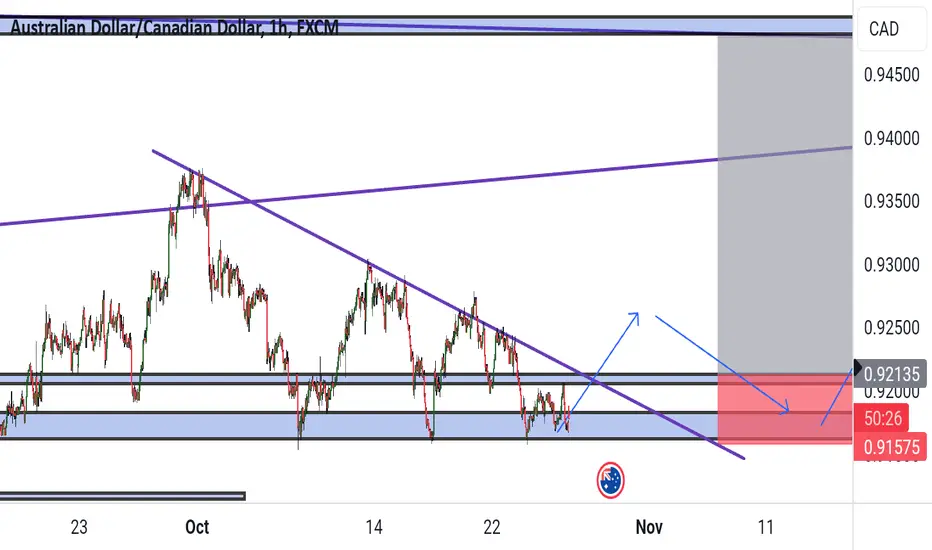
Lingrid | AUDCAD sideways Price ACTION. Potential SHORTThe price perfectly fulfilled my last idea. It hit the target level. FX:AUDCAD created a lower high and formed a double bottom. Overall, the trend appears to be moving sideways on the 4H timeframe. I believe the market is forming a descending triangle pattern, which suggests that the double bottom may be retested. I expect the market to move higher toward the resistance zone that has been respected multiple times before, and potentially take liquidity above the psychological level at 0.92000 before moving downward. My goal is support zone around 0.91590
Traders, if you liked this idea or if you have your own opinion about it, write in the comments. I will be glad 👩💻
AUDCAD - 4hrs ( Sell Trade target Range 100 PIP ) 🟢 Pair Name :AUD/CAD
Time Frame : 4hrs Chart / Close
Scale Type : Large Scale
------
spreading knowledge among us and to clarify the most importan+t points of entry, exit and entry with more than 5 reasons
We seek to spread understanding rather than make money
🟢 Key Technical / Direction ( Short ) Bearish
Type : Mid Term Swing
———————————
Bearish Break
0.91450 Area
Reasons
- Major Turn level / D
- Visible Range hvn
- Inner Trend
- Major Channel Middle Band
- Day Low break
- Week low Break
Bullish Reversal
0.90000 Area
Reasons
- Major Turn level
- Visible Range Hvn / Poc
- Week low Area / P
- Pattern Target
- Fibo Golden

AUDCAD- SHORTBearish Indicator
1- Series of LH and LL
2- rejection from 23.60 level of FIb
3- Rejection from Trend line resistance
4- Rejection from 1D resistance level
Entry Price- 0.91457
SL - 0.92098
TP1 - 0.90827
Tp2 - 0.90180

Bearish AUDCAD They cut interest for the Canandian dollar and it's been declining against the Australian dollar.
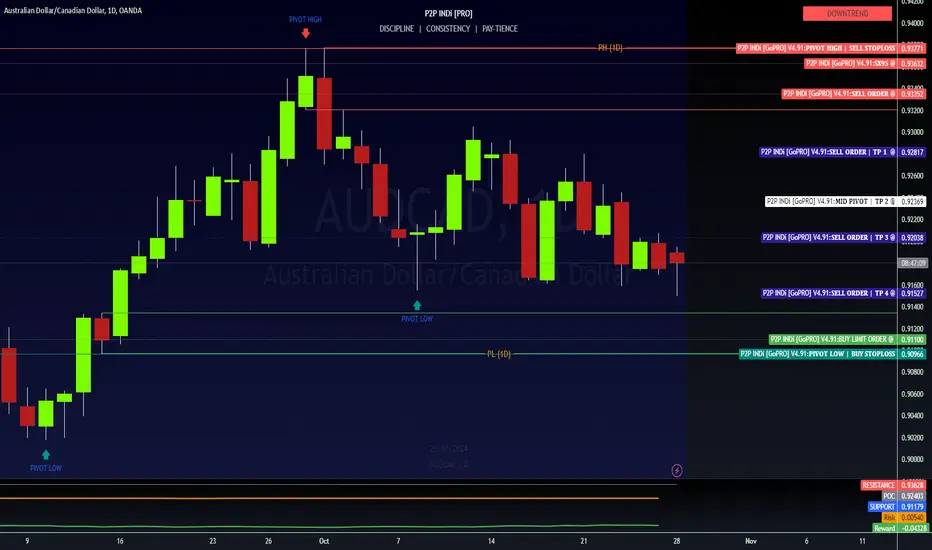
AUDCAD: 1D Curve AnalysisPIVOT HIGH = Resistance @ 093771
PIVOT LOW = Support @ 0.90966
⚠️ HIGH RISK SELL ORDER
(with tight stop loss)
FINAL TP @ 0.9138 🤑
AUDCAD reached resistance of its trendline!AUDCAD reached the resistance and potentially will make reversal in 1H
Good luck!
SELL AUDCAD 0.925
SL 0.9305
TP 0.915

AUDCAD - (500 pip move)Longing AUD
Expecting pullbacks in DXY - 3 of 4 weeks were positive
Weak Oil prices - Weak CAD pair
Expecting a strong move with Aussie moving up.
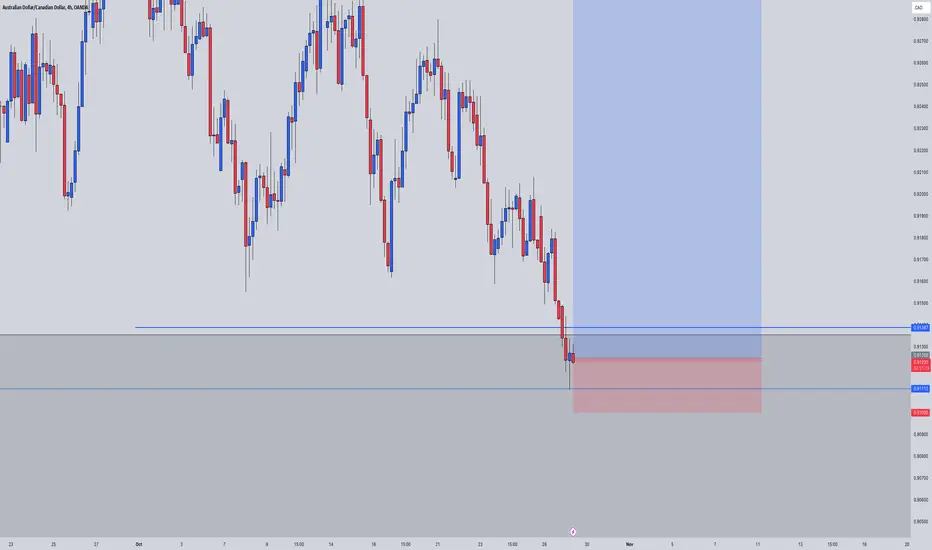
Short on the daily AUD/CADShort on AUD/CAD with the usual 1% risk set at 1.5xATR. However, in this case, we've also set the TP at 1:1 RR for 50% of the position as the level also coincides with the 161.8 level on a Fib we're observing. If price should breach the TP, the second half of the position would be left to run with a trailing stop at 1xATR

Audcad for buy.Price formed a rising channel on higher timeframe, on lower timeframe, price formed a descending triangle. Let price breakout of the trendline and retest the support zone, wait for bullish candlestick pattern and then we take a buy.
AUDCAD potential sell Strong opportunity to sell. I’ll be waiting for price to break the neckline then I believe we can push down to our next support point
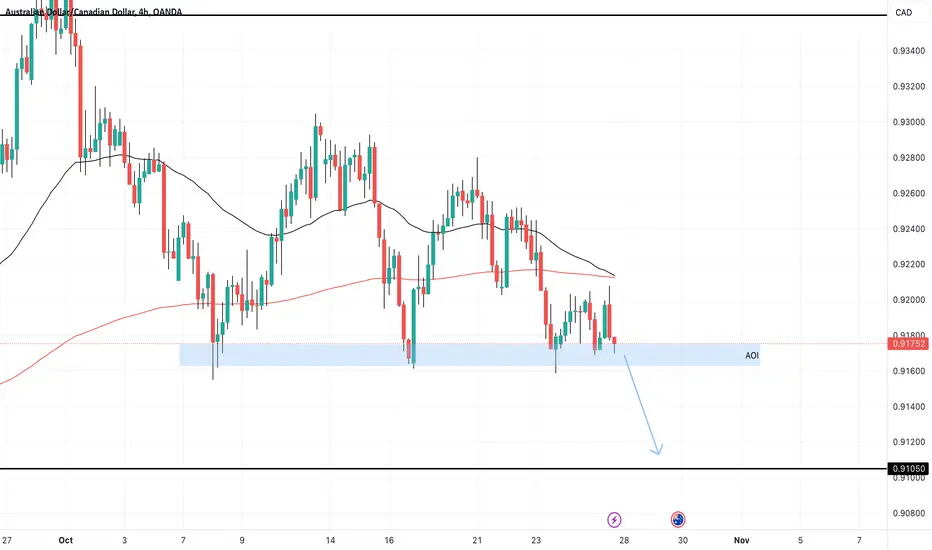
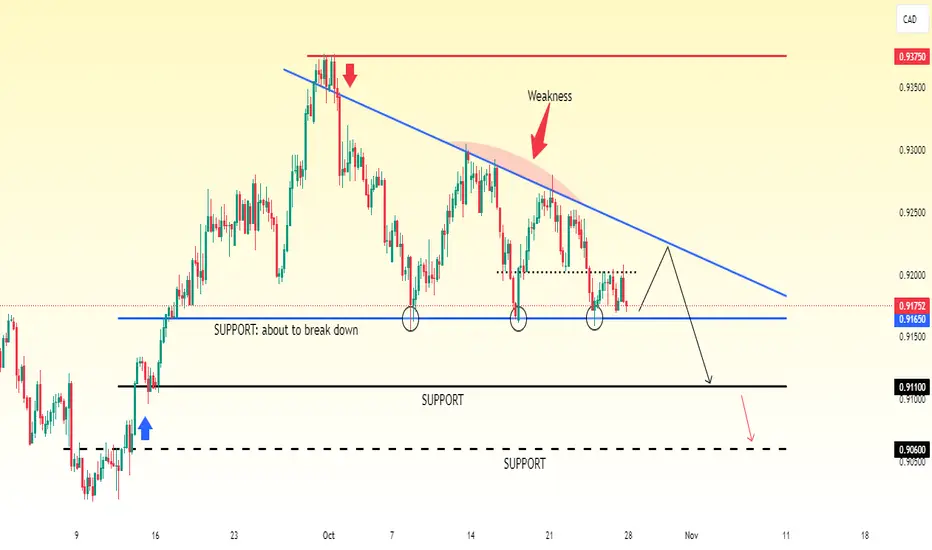
AUDCAD Descending Triangle: Key Support Levels to WatchAUDCAD moved up from 0.9060 to reach 0.9375, and now forming a descending triangle pattern. This pattern usually appears when the price is making lower highs, meaning sellers are pushing it down, but there’s still a solid support level holding it steady, around 0.9165.
Currently, AUDCAD is trading at 0.9175, and it seems likely to keep dropping. The first level to watch is 0.9110, if the price breaks below this, it could continue down to 0.9060, where the previous rally began.
If sellers keep control, we might see more downward movement. But if support holds, there’s a chance for a bounce.
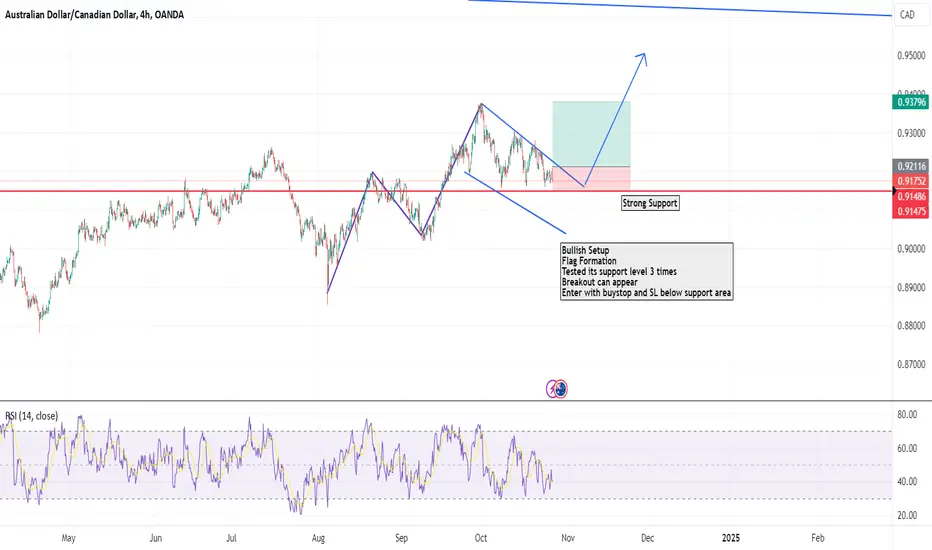
AUDCAD, Bullish FlagBullish Setup
Flag Formation
Tested its support level 3 times
Breakout can appear
Enter with buy stop and SL below support area